Saturday, October 17, 2020

Weekly Indicators for October 12 - 16 at Seeking Alpha


 - by New Deal democrat

My Weekly Indicators post is up at Seeking Alpha.

What was most noteworthy about the past week is the confirmation that consumer spending, so far, has continued to hold up even as emergency Congressional assistance has been terminated for a month and a half.

As usual, clicking over and reading will bring you up to the moment on all of the important economic data, and will reward me with a penny or two in my pocket for putting the information together for you.

Friday, October 16, 2020

Real retail sales continue (inexplicably) strong, still bode well for employment


 - by New Deal democrat


This morning we got two important monthly September reports: industrial production and retail sales.

I have more to say about industrial production, and some general economic analysis about retail sales, which are pending at Seeking Alpha. I will post a link once that article goes up. UPDATE: Here’s the link: Link

For this blog, let’s focus on how real retail sales are likely to affect employment. 

Just to start, here is are CPI adjusted retail sales. You can see that they have actually jumped once the Congressional stimulus kicked in, and have remained well ahead of pre-pandemic levels:


As I have said many times in the past, consumption slightly leads employment. It has almost universally done so for the entire 70+ year history that both measures have been kept. Basically, demand for goods and services drives hiring to fulfill that demand (or at least to an increase in hours employed) typically within a few months later.

I am frankly very surprised that sales have held up in the past several months, despite the ending of emergency Congressional assistance. But done so they have - although it may largely be a function of seasonal distortions caused by the pandemic.

But, turning to employment, historically consumption has led employment (/2) by several months (albeit with lots of noise), and has an even closer relationship with aggregate hours (all shown YoY below):


Here is a close-up on the past year:


Because sales have made a full recovery, and indeed on a YoY basis are accelerating, I expect employment and hours worked to continue to show gains for the next several  months, although at a slower pace similar to what we have seen in the August and September reports. 

Thursday, October 15, 2020

Jobless claims: only one week’s data, but cause for significant concern


 - by New Deal democrat

Today marked the biggest increase in new jobless claims in two months, and one of the two biggest increases since May, while the slightly lagging continuing claims continued to decline.

On a non-seasonally adjusted basis, new jobless claims rose by 76,670 to 885,885. After seasonal adjustment (which is far less important than usual at this time), claims rose by 53,000 to 898,000. The 4 week moving average also increased by 8,000 to 866,250: 


Here is a close-up of the last four months highlighting the overall glacial progress in initial claims since the beginning of August:


Continuing claims declined on a non-adjusted basis declined by -1,188,202 to 9,631,790. With seasonal adjustment they declined by 1,165,000 to 10,018,000. On the bright side, both of these numbers are new pandemic lows:


 Continuing claims are now about 60% below their worst level from the beginning of May, but remain about 3 to 3.5 million higher than their worst levels during the Great Recession.

Only one week’s data, but it is a significant concern that claims have risen, after largely stalling for two months. The situation is at best only improving at a snail’s pace, and at worst is deteriorating again as we head into winter and a likely renewed increase in COVID cases.

Wednesday, October 14, 2020

Coronavirus dashboard for October 14: winter is coming


 - by New Deal democrat

Total US confirmed cases: 7,806,805*
Average cases last 7 days: 51,038
Total US deaths: 215,887
Average deaths last 7 days: 714

*Actual cases probably more like 14 million, or over 4% of the US population

Source: COVID Tracking Project

Today let’s take a look at the most recent upsurge in COVID not just in the US, but in the entire West.

Here is the 7 day average of new cases per capita in the US, Canada, and the 5 most populous countries in Europe:


Every single country, even Germany, is experiencing an upsurge. France, Spain, and the UK are having an even worse outbreak than the US.

Here are deaths per capita. Note that this graph only shows the past 12 weeks. Early on the US, UK, Spain and Italy all had daily deaths on the order of 14 to 18 per capita, dwarfing everything since:


We know that these will follow new cases with a 2 to 4 week lag. Spain already exceeds the US. France and the UK are following behind.

All things considered, Canada and Germany are still doing quite well. But the increase in cases there certainly points to how hard it is to keep this virus contained.

Within the US, here is the spaghetti chart of cases in all 50 States plus DC and the territories:


Note that the Dakotas and Montana now have worse outbreaks than even NY did in April.

Here are deaths:


In April, NY had deaths of about 50 per capita every day, so even North Dakota, at 14 per day, while the worst since then - even surpassing Arizona’s summer spike - is nowhere near that bad - yet.

Here are the bottom 10 jurisdictions for infections:


Only Maine and Vermont among the 50 States still have the pandemic controlled.

Finally, here are the bottom 10 for deaths:


Again, only Maine and Vermont have still fully contained the virus.

And winter is coming.

Tuesday, October 13, 2020

Consumer prices rise a “normal” 0.2% in September


 - by New Deal democrat

In September Consumer prices rose a “normal” 0.2%, the first such typical increase since the pandemic began (blue in the graph below):


For the past 40 years, recessions had typically happened when CPI less energy costs (red) had risen to close to or over 3%/year. We are nowhere near that now (last 15 years shown in graph):


Because wages are “stickier” than prices, typically as recessions beat down prices (or at least price increases), in real terms wages rise. That has been the case for the coronavirus recession as well:


As a result, as I’ve noted for the past several months, real hourly wages for non-supervisory workers have finally exceeded their previous 1973 peak:


Of course, this is also because lower wage workers disproportionately lost their jobs during the pandemic. Until several months ago, they were buoyed by emergency Congressional assistance. One of the big mysteries in the past few months is why the expiration of those benefits has not caused a steep drop in consumer spending. Retail sales will be reported on Friday, and that is when we will know the answer for September.

Monday, October 12, 2020

College educational attainment by age demographic


 - by New Deal democrat


There is no economic data today due to the Columbus Day observance.


So let me drop this graph of a metric I have been trying to find, of college educational attainment by age demographic, that I finally came across a couple of days ago:


It is a commonplace that among Whites at least, support for Democrats is highly correlated by college education. What is unclear is whether that is actually a function of education itself, or is simply confounded by age group.

The above graph shows are steady rise in the percentage of both men and women with college degrees over the past 80 years. But we know that the strongest support for the GOP, and for Trump in particular, is in the age cohort of younger Boomers and the first half of Gen X, roughly birth years 1960-1970. That equates with college degrees being granted about 20 years later, from 1980 to 1990 or so.

Yet there is no notable exception in the growth of the percent of college educated persons during the 1980s. That strongly suggests that it was the condition of the economy in particular during the 1970s and 1980s that led to such strong GOP identification among that age group, rather than their educational attainment.

I still haven’t found any good information that provides cross-tabs on both educational attainment and age group, to more specifically sort out the strongest correlation. So for now, this will have to do.

Sunday, October 11, 2020

The 2020 Presidential and Senate nowcast: birds coming home to roost


 - by New Deal democrat


Here is my weekly update on the 2020 elections, based on State rather than national polling in the past 30 days, since that directly reflects what is likely to happen in the Electoral College. 

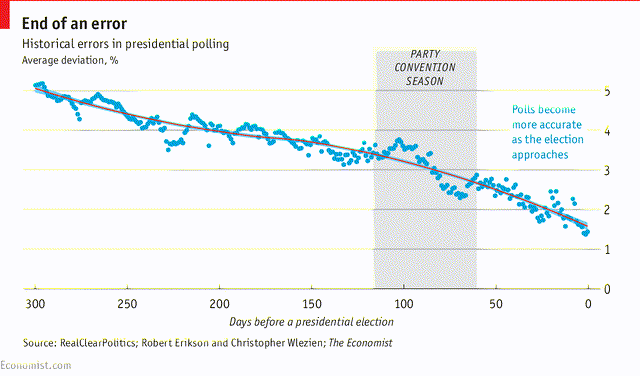
Now that we are only 23 days from Election Day, let me update and revise a few comments. First of all, while polls are really only nowcasts - snapshots of the present, rather than forecasts - at this point they are probably only about 2% off the final result: 


At the moment, according to 538, Biden is up 52.2% to 41.9%. Even if each % moved 2% favorable to Trump, that would still be a 50.2% to 43.9%, or 6.3%, advantage for Biden. That’s a pretty solid lead.

A dditionally, all of the important COVID and economic information is already “baked in the cake.” There is nothing that is going to greatly change perceptions for either outlook (unless one of Trump’s inner circle were to die of the disease). The one issue that is likely to be very front and center in the next several weeks is the Supreme Court. So far I have not seen any polling indicating which if either of the candidates might benefit.

Further, I expect that we are already seeing marginal voters “come home” to their respective parties, as will be apparent in the maps below. 

Because of the vast increase in the numbers of early voters in States where voting is already underway, it’s not clear at all that polls in late October or the first several days of November should receive increased weight. Beginning next week, my plan is to slightly increase the weighting of any polls conducted during October vs. September, and leave it at that. 

Finally, because the polling has become extremely persistent, when we get to the last week before the election I will probably move any State with a 1%+ differential to “lean Democrat/GOP, rather than stay with 3%.

With those statements out of the way, here is this week’s update.

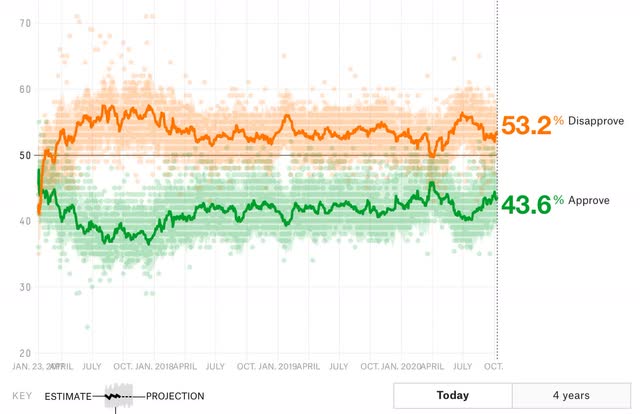
Trump had a particularly bad past 12 days - and as a presumed result of which, his approval rate has declined all of -0.6%, while his disapproval rate has increased by +0.9%. Needless to say, this is well within the normal range of approval going back 3.5 years: 


Here is this week’s updated map through October 10 for the Presidential election. To refresh, here is how  it works:

- States where the race is closer than 3% are shown as toss-ups.
- States where the range is between 3% to 5% are light colors.
- States where the range is between 5% and 10% are medium colors.
- States where the candidate is leading by 10% plus are dark colors.


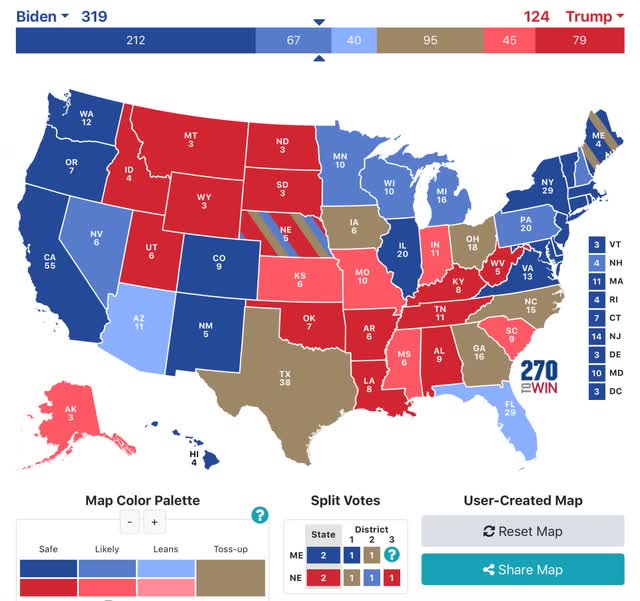
Two weeks ago there were a number of changes adverse to Biden. This week they have all disappeared. Additionally, both Indiana and Mississippi went from “solid” to “likely” GOP, on the basis of relatively weak new polls. But most importantly, Florida has moved back from toss-up to “lean Biden.” I have seen lots of information that seniors have decisively soured on Trump, and it appears to be showing up there.

Biden’s “solid” plus “likely” Electoral College votes remained at 279 this week, below their peak of 302 two months ago. In other words, Biden doesn’t even need Florida or Arizona in order to win.

Biden’s support also improved to 50%+ in Arizona, in addition to Michigan, New Hampshire, Pennsylvania, Wisconsin, and Minnesota. This makes it extremely hard for Trump to mount a successful comeback in those States.

Turing to the Senate, there were 3 changes: Montana went from toss-up to “lean GOP,” while Iowa, importantly, went from toss-up to “lean Democrat.” Additionally, we have more clarity in the 2nd Georgia “jungle primary” election. It appears that Democrat Warnock will make it through to the finals. But once there, the combined GOP vote looks to be nearly 10% more than the combined Democrat vote. I have thus moved the race to “likely GOP”:


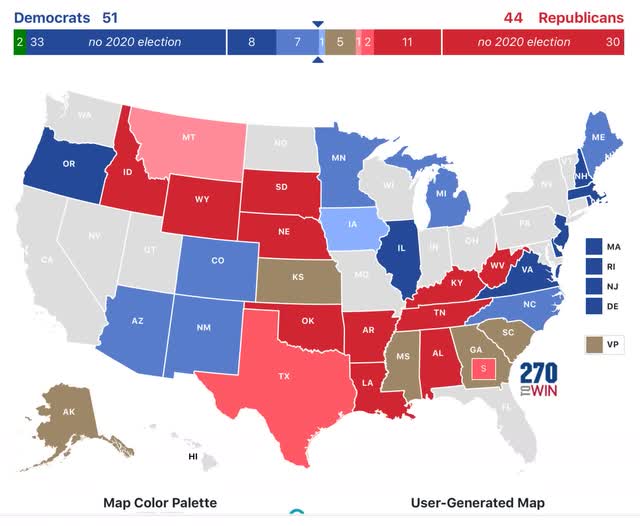
At current polling, if Democrats win all those races in which they lead, they will have 51 seats. The number of “toss-ups” has declined to 5.

A Biden victory and a majority Democrat Senate looks increasingly likely, which is probably why we are beginning to see a few Senate Republicans publicly put distance between themselves and Trump.