Saturday, February 17, 2007

Sub-Prime Mortgage Derivatives Drop for 4th Week

From Bloomberg:

A derivatives index used to bet on bonds backed by the riskiest U.S. mortgages fell for the fourth straight week as more subprime lenders reported losing money.

Prices for credit-default swaps linked to 20 securities rated BBB-, the lowest investment grade, and created in the second half of 2006 fell 2.8 percent to 82.82 this week, and are down 15 percent since being introduced Jan. 18. The decline means an investor this week would have paid more than $950,000 a year to protect $10 million of bonds against default.

The tumble is being exacerbated by hedge funds using the index to make bearish bets and a dearth of investors willing to use them to make bullish bets, said investors such as Dean Smith of New York-based Highland Financial Holdings Group LLC, which manages $2 billion including mortgage bonds. The cost to protect against default using the index was more than two-and-a-half times that to insure individual securities on Feb. 12, Bear Stearns Cos. said.

``We've yet to see the floor on where these things can go,'' said Paul Colonna, a fixed-income manager for Stamford, Connecticut-based GE Asset Management, which oversees $199 billion. ``And it's not based on housing data or performance data'' on mortgages in the bonds.


These bonds were recently introduced -- as in about a month ago. Since then they have only decreased in value. The only people buying these bonds are short sellers. No one appears to be bullish right now. In addition, there is no market floor on these bonds. Some of this is due to their lack of a trading history. But when a chart is solidly trending in one direction, traders will follow the trend until it stops. Then some traders will hold on to their positions to see if the trend is simply taking a break. In other words, this market could go down for awhile.

Fed President Moscow on Inflation

From a speech on February 16:

Taking all of these factors into account, my assessment is that the risk of inflation remaining too high is greater than the risk of growth falling too low. Thus, some additional firming of policy may yet be necessary to address this inflation risk. Of course, whether policy will need to be adjusted and the degree of any adjustment will depend on the data we see in the months to come and how that data influences our forecast of the economy.


Translation: I'm not going to vote for lower rates in the current environment.

Friday, February 16, 2007

The Market's Last Week

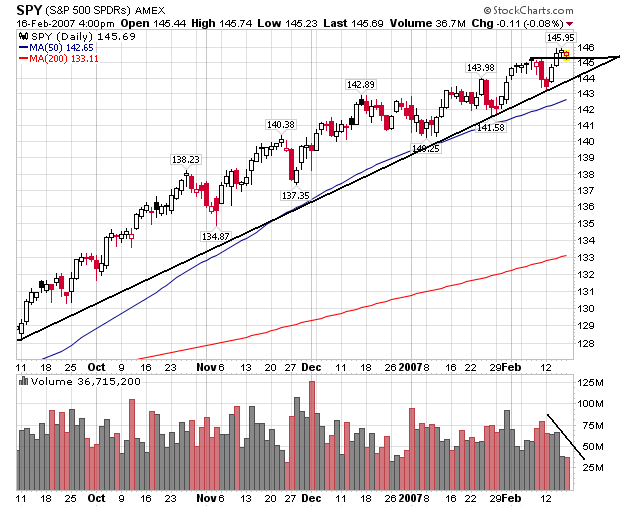
Here's a chart of the SPYs

Photobucket - Video and Image Hosting

We're still firmly in the uptrend that started in September. We had two strong rallies this week, followed by two days of consolidation. The last two days of consolidation were on weaker volume, but the markets didn't sell-off. This indicates traders are willing to hold their positions over the weekend. The only negative of the last few days was the decreased volume.

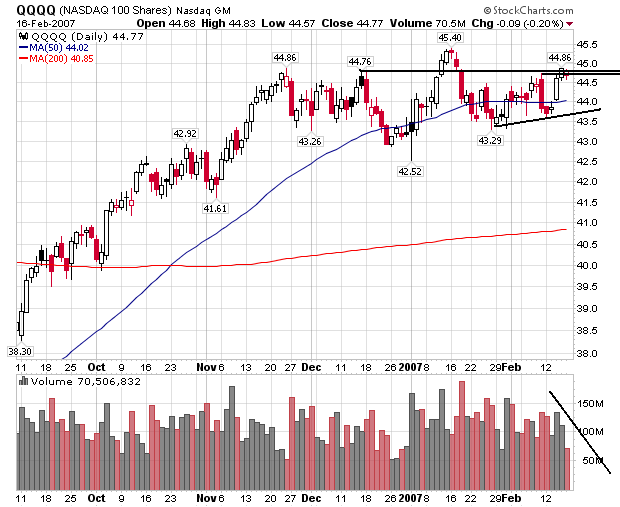
Here's a chart for the QQQQs

Photobucket - Video and Image Hosting

The QQQQs are still mired in a trading range between 42.5 to 45.5. While the QQQQs also rallied, we have three days of decreasing volume. The decreasing volume is always a concern. However, as with the SPYs, traders were willing to take their gains over the weekend, which is bullish for next week.

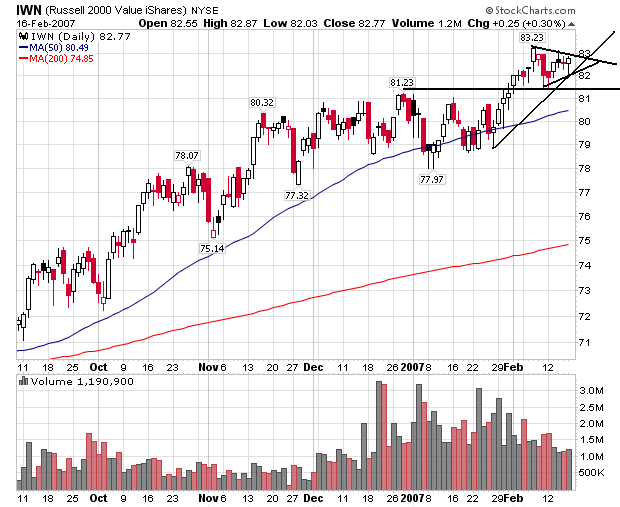
Here's a chart for the IWNs

Photobucket - Video and Image Hosting

This is a classic consolidation chart. After making new highs, the IWNs are forming a triangle on lower volume. While we didn't have the same type of gains as the QQQQs or SPYs, we also didn't have any major losses either.

All of these charts are a net positive going into next week. The QQQQs are the weakest because they are still in a trading range, but as with the SPYs and IWNs, QQQQ traders were willing to hold their gains over the weekend.

Housing Starts Plummet 14.3%

From Bloomberg:

Builders in the U.S. started work last month on the fewest number of new homes since August 1997 as a glut of unsold houses and the onset of colder weather discouraged new projects.

Housing starts slumped 14.3 percent to an annual pace of 1.408 million, less than forecast and down from December's 1.643 million rate, the Commerce Department said today in Washington. Building permits declined 2.8 percent to a 1.568 million pace.

Treasury yields fell after the figures showed residential construction will remain a drag on the economy until the inventory of unsold homes declines. Federal Reserve Chairman Ben S. Bernanke told lawmakers this week that the process may extend through much of the year.

``Housing inventories are still beyond bloated, and starts aren't going to recover in any meaningful way until those inventories come down,'' Chris Low, chief economist at FTN Financial, said before the report. ``I would be cautious about calling an end to the housing slump just yet.''


First -- this news while shocking, shouldn't be. Housing inventories have indeed been bloated for some time. Last month's increase took me by surprise, largely because of the massive amount of overbuilding. It looks like that's coming to an end.

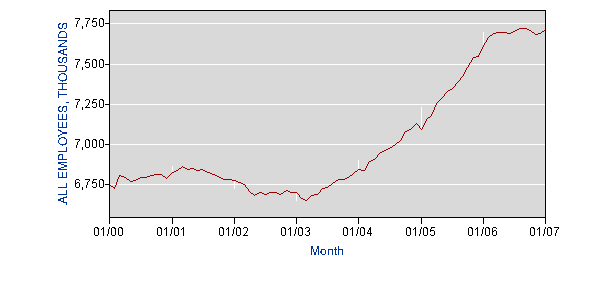
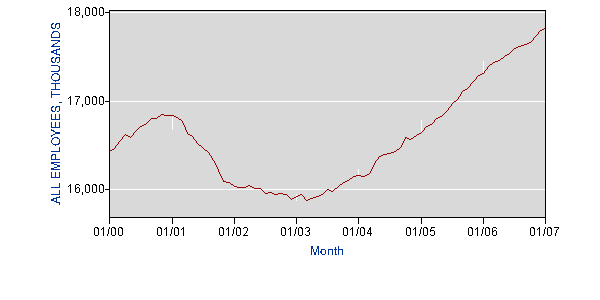
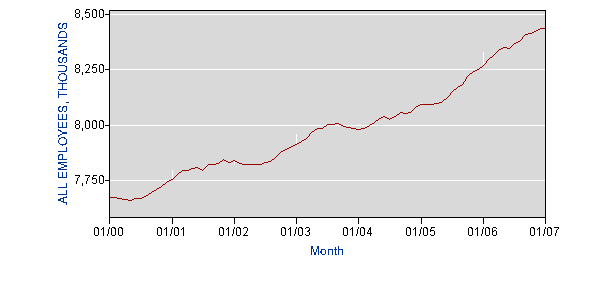
Going forward, this has some really important implications. The most important is construction employment. The blog Calculated Risk has been all over this and done a great job. The link is at the right on the blog roll. I would add two more job areas: professional services and financial services. Here's a chart of each of the preceding areas:

Construction:

Photobucket - Video and Image Hosting

Professional Services:

Photobucket - Video and Image Hosting

Financial Services:

Photobucket - Video and Image Hosting

We've already started to see cracks in the sub-prime mortgage market. With fewer houses being built, there is less of a need for a sales and financing force. However, I wouldn't expect a big drop for at least a 3-6 months. This means we could start to get a very painful slow bleed in employment with construction lay-offs beginning, followed by a decreasing sales and financing force.

Producer Prices Decrease .6%

From the BLS:

The Producer Price Index for Finished Goods declined 0.6 percent in January, seasonally adjusted, the Bureau of Labor Statistics of the U.S. Department of Labor reported today. This decrease followed a 0.9-percent advance in December and a 1.8-percent jump in November. At the earlier stages of processing, prices for intermediate goods moved down 0.7 percent compared with a 0.5-percent increase in the prior month. The crude goods index decreased 6.3 percent after rising 2.8 percent in December. (See table A.)


Before we get too excited ---

Energy prices dropped 4.6%. That's because oil prices cratered in mid-January, only to rebound later in the month. We won't see a drop like this unless oil retreats again.

The number ex-food and energy was up .2%. The unadjusted change from a year ago was also up .2%. That's good news.

However -- and Bernanke made this abundantly clear in his Congressional testimony this week -- oil is a big reason for the drop. Remember that oil rebounded from lows in mid-January. In addition, oil is a pretty unstable commodity.

Chrysler Cuts Production: Industrial Production to Follow?

From the AP

The Chrysler Group, which had an operating loss of $1.475 billion in 2006 and expects to show losses through 2007, announced Wednesday that it would eliminate 13,000 positions, including 11,000 production jobs and 2,000 white-collar posts, as it seeks to cut costs and return to profitability in 2008.

Of the production job cuts, 9,000 are in the U.S. and 2,000 are in Canada.

Chrysler, part of Germany-based DaimlerChrysler AG, said Wednesday it plans to close the Newark, Del., assembly plant during the next two years and cut shifts at plants in Warren, Mich., and St. Louis. The company also announced that a parts distribution center which employs 100 workers near Cleveland also will close this year.

On Thursday, company officials said much of the impact would be in southeastern Michigan, where 5,300 people will lose their jobs by 2009.


Yesterday, the Fed released the January Industrial production numbers. They decreased by .5%, largely caused by a big drop in auto production. This plan will go into effect throughout 2007 and probably into 2008. This means another US automaker is scaling back production. Don't be surprised if this hits the industrial production numbers going forward.

I should also add the Ford (F), GM (GM) and Daimler Chrysler (DCX) stocks have all rallied over the last few months, probably in anticipation of these plans working. I have been wondering if these rallies were warranted given the underlying problems of these three companies.

Don't Worry -- It's Only an Inverted Yield Curve

From CBS Marketwatch:

But S&P says, in effect, that we shouldn't be worried.

Their argument, which appears in the Feb. 14 edition of flagship newsletter The Outlook, is that global capital flows have made this country's yield curve less important than it once was. As Alec Young, S&P's international equity strategist, puts it, "Capital flows around the world more freely than ever -- meaning the global yield curve is far more relevant in assessing U.S. economic and profit trends than its domestic counterpart."

What's the current picture painted by global interest rates? To find out, Young turned to a global yield curve in which each country's individual yield curve is weighted according to the share that its gross domestic product has of global GDP. In contrast to the U.S.'s inverted yield curve, this GDP-weighted global yield curve is positive right now, according to Young.


From USA Today:

Every recession since 1960 has been preceded by an inverted yield curve. The indicator's only wrong signal was in 1966, when the curve inverted but no recession followed.

The indicator carries logic behind it. The Federal Reserve pushes up rates to slow the economy, and bond traders push yields down if they smell a slowdown.

"The bond market is telling you they have a pessimistic view of the next 12 months," says Russ Koesterich of Barclays Global Investors.

But Koesterich thinks demand for long-term bonds, especially from China and oil-producing nations, has twisted the curve. As demand rises, yields fall.

Oil exporters held $97.1 billion in Treasuries at the end of November, up from $79.3 billion a year earlier. China's Treasury holdings have swelled to $347 billion, up from $303.9 billion a year before.

In other ways, too, globalization may be diminishing the yield curve's accuracy as a recessionary signal. On one hand, increases in the fed funds rate, the interbank overnight loan rate, can slow the economy. Banks must pay more for deposits. Consumers pay more for loans.

On the other hand, U.S. companies can now often borrow overseas at lower rates. The funds rate, for instance, is 5.25%; the European Central Bank rate is 3.5%. "Our own yield curve is less important when companies can borrow elsewhere," Kalish says.


OK -- I think the S&P argument is pretty weak. A global yield curve sounds like a really nice idea on paper, but I don't think it has much weight outside academia.

The USA Today article makes more sense. They are essentially arguing the following.

Company A is no longer constrained by US geographical boundaries when looking for loanable funds. For companies of a certain size this is true. For example, a company in the S&P 500 does have access to pretty much the whole world's capital pools if it so chooses. However, this argument assumes a low interest rate is the only cost involved in borrowing money. There is also currency risk which has to be hedged against. There may be a ton of other costs involved in borrowing in another country. For example, some countries may have different, more arduous legal requirements for off-shore borrowing. Then there is the cost of investigating and developing the offshore relationships to actually borrow offshore. Short version for borrowing offshore -- there are probably alot of hoops to jump through that go beyond the simple "it's cheaper over there" argument.

The article is also right about the "global savings glut". Basically, the flood of petro-dollars is returning to the US in some form with increased purchases of US Treasury bonds. That makes sense and I think it carries some weight. However, the International Monetary Fund made an observation at the beginning of 2006 that the "global savings glut" is really a decrease in Asian investment. At the beginning of the 21st century, Asian economies were investing at a lower rate. This freed up a large amount of international capital which looked for a new home. If Asian countries return to their previous level of investment, the US economy will be competing with Asian economies for these excess funds.

In addition, US financial institutions' profit margins are less constrained by the US yield curve. For the last 20 years, banks have worked diligently to develop revenue streams that are not dependent on borrowing short and lending long. For example, most banks have built up larger internal businesses that service loans which are more immune to yield curve fluctuations.

However -- and maybe I'm just an old fashioned economists who can't learn new tricks -- the inverted yield curve still bothers me. But I've been wrong before -- I thought Madonna was a 1-hit wonder, after all.

Thursday, February 15, 2007

Net Capital Outflow From US in December

From CBS Marketwatch:

U.S. monthly capital flows reversed in December to an outflow for the first time since June 2005, the Treasury Department reported Thursday.

The U.S. recorded an outflow of $11 billion in December, compared with an inflow of $70.5 billion in November, the Treasury said.

The U.S. economy has required big inflows of capital of about $70 billion every month to fund its large current account deficit, which totaled $225.6 billion in the third quarter -- about 6.8% of gross domestic product.

The large inflows of foreign capital have kept U.S. interest rates lower than they would otherwise be, boosting the real-estate sector and other asset markets with cheap money.

The dollar fell against yen and the euro following the report, which, according to Action Economics, "didn't sit too well" with the markets after Tuesday's report on the nation's growing trade gap and a Wall Street Journal report that China is considering shifting some of its $1 trillion in foreign reserves into riskier assets, such as corporate bonds, stocks and even commodities. See full story on currency markets.

The December flows data include both long- and short-term securities. The outflow resulted from total sales of $42.5 billion in securities by private investors, partially offset by $31.5 billion in purchases by official institutions.


Here's a link to the official data.

Let's look at this in a bit more detail.

The grand total of outflows was $11 billion. In the big scheme of things, this is not large number and could be adjusted to a positive figure in the coming months.

The one figure that jumps out from the Treasury release is the net 11.1 billion sale by private foreigners of equities. This was the first negative number in the last few months. It could easily have been simple, year-end profit taking.

We're still seeing large purchases of corporate bonds at the expense of US Treasury bonds. This is probably for two reasons. First, Corporate bonds have a higher yield. Secondly, it could be simple portfolio diversification.

We also see a net sale of foreign official institutions selling of US Treasury Bills, although not by much.

Again, given the US trade deficit (which set another record this year) this number should raise eyebrows. However, it could just as easily beenb the result of year end profit taking in equities.

New Home Prices Decrease 2.7% in 4Q

From the National Association of Realtors in PDF format

The link has a list of prices in various US cities.

The NE decreased 2.5%, the South decreased 3.7% and the Midwest Decreased 4.2%. The West increased .4%.

Florida is a bloodbath right now. We're seeing big declines.

California is mixes. San Diego and San Francisco are down while Los Angeles and San Jose are up. Go figure.

It takes a great deal of downward pressure to move the national number lower. That means this number is significant.

Retail Sales unchanged in January

From the Department of Commerce.

This is in PDF format.

The DOC revised the December figure higher from a .9% increase to a 1.2% increase.

Motor Vehicles, electronics stores, and restaurants and bars were all down slightly.

Gas stations were down big, but then again so were oil prices for the first half of January.

Building materials, home furnishings and clothing/apparel were up slightly.

Basically, it looks like the consumer stopped spending on more extravagant purchases (autos and wide screen TVs) and bought more of the traditional needs based items. This shouldn't surprise anybody coming after Christmas.

Industrial Production Drops .5%

From the Federal Reserve:

Industrial production decreased 0.5 percent in January after an increase of 0.5 percent in December. Output in the manufacturing sector declined 0.7 percent in January; about one-half of the decrease was a result of a drop of 6 percent in motor vehicles and parts. The output of utilities rebounded 2.3 percent, as temperatures moved back toward seasonal norms, while the output of mines moved down 1.2 percent. At 111.9 percent of its 2002 average, overall industrial output for the month was 2.6 percent above its January 2006 level. The rate of capacity utilization in January fell 0.6 percentage point, to 81.2 percent. Even so, it was 0.1 percentage point above its year-earlier level and 0.2 percentage point above its 1972-2006 average.


OK -- let's break these numbers down a bit.

1.) Auto production accounted for half of the decline. That means we have a 1-time factor disproportionately hitting this number. While the decrease still means something important for this number, it's doubtful we'll see auto production drop that much again in the near future. The drop occurred in autos and trucks. Even without the auto numbers, overall production decreased .2%.

2.) Energy products increased in production. While the 4th quarter still saw a big drop, this large increase may bode well for this sector in the future.

3.) Computers, semi-conductors and communication equipment all saw increases. Excluding high-tech, non0energy production decreased 1.1%. That indicates technology production is really important to the industrial base right now and negative news from that sector will be doubly important.

4.) Industrial capacity decreased in a big way. This should help the Fed continue t argue that inflationary pressures are lessening.

Import Prices Decrease 1.2%

From the Department of Labor:

Import prices fell 1.2 percent in January after increases of 1.1 percent and 0.5 percent, respectively, in December and November. A 7.3 percent decrease in petroleum prices drove the overall January drop, as petroleum prices resumed a recent downward pattern after increasing 4.6 percent in December. Nonpetroleum prices were unchanged in January after a 0.5 percent advance the previous month. Prices for nonpetroleum imports rose 1.6 percent over the 12 months ended in January.


Let's look at a chart of oil to see if this trend will continue:

Photobucket - Video and Image Hosting

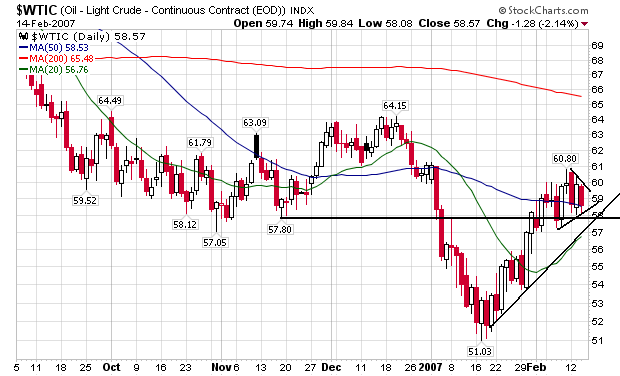
Oil bottomed in mid-January around $52/bbl. Since then it has broken through technical resistance in the $57/bbl area. Currently it's still in an uptrend and appears to be consolidating its gains in the $58-$60 area.

In other words, so long as oil remains at or near current levels we can't expect this inflation number to repeat. In addition, this month's increase more or less canceled out last months increase, so we'll be back to square one next month.

However, this news should add fuel to the "inflation is decreasing from natural factors" bulls from yesterday.

NY State Manufacturing Index Rebounds

Here's a link to the full report:

Short version: The overall situation jumped up. New Orders, shipments and unfilled orders all increased. Prices paid decreased while prices received increased.

The last ISM index has hovering around recessionary levels. Since that time, we've had a moderately positive Philly Fed report and a very strong NY report. That should help to ease some concern about the manufacturing sector of the economy for now.

As with all things economic, we'll have to wait and see if the trend continues. We're not out of the woods yet, but we're making a start.

Weekly Unemployment Increases 44,000

From the Department of Labor:

In the week ending Feb. 10, the advance figure for seasonally adjusted initial claims was 357,000, an increase of 44,000 from the previous week's revised figure of 313,000. The 4-week moving average was 326,250, an increase of 17,500 from the previous week's revised average of 308,750.


Watch the 4-week moving average.

What's interesting about this report is that despite a large increase, there are only two states in the 1,000+ layoff category.

According to CBS Marketwatch

The unemployment lines grew longer last week, in part because of bad weather in the Midwest and Northeast, the government reported Thursday. The number of people collecting unemployment benefits rose to the highest level in a year.


So at least some of this is weather related. We'll have to see if the trend decreases over the next few weeks.

Greenspan: The Worst of Housing Is Over

First, welcome to all the people referred by Crooks and Liars:

From Reuters:

The worst of the U.S. economic adjustment to the housing slowdown is in the past, although housing starts and prices likely still have room to fall, former U.S. Federal Reserve Chairman Alan Greenspan said on Wednesday.

"The worst is behind us," he told a C$400-a-plate luncheon audience in Toronto via video conference, according to a source who was in attendance.

Greenspan had been expected to deliver his speech in person, but his flight was canceled due to snowstorms across much of eastern Canada and the United States.


There are some important points to remember here.

1.) As a former Central Banker, Greenspan is playing the, "I'm the voice of reason" card. He probably doesn't view his position as someone who should issue warnings of concerns. If memory serves, only did that one with his "irrational exuberance" statement in the mid-1990s.

2.) I disagree strongly with Greenspan's statement. Over the last two months, we've seen two waves of sub-prime mortgage (SPM) defaults and bankruptcies. The first included Ownit Mortgage which at the time was the 11th largest SPM lender. The second started at the beginning of this week when HSBC announced it was increasing its loan loss reserve and NEW said it was restating earnings for the last year and was reporting a loss for the latest quarter. UBS securities has said the 2006 SP mortgages were going into default at a record pace. The same article notes that delinquencies are above 2000 levels. That means delinquencies in an economic expansion are higher than delinquencies during the last contraction. Housing vacancies are over 2% -- the highest ever on record. None of these factors indicate housing is at a bottom.

I predicted a recession in 4Q 2006 or 1Q 2007 based on the assumption the housing market's problems would bleed into consumer spending. That assumption was wrong as housing problems have been contained so far. But it also looks like we have a long way to go before housing bottoms.

Wednesday, February 14, 2007

Bernanke's Inflation Statement

From today's testimony:

I turn now to the inflation situation. As I noted earlier, there are some indications that inflation pressures are beginning to diminish. The monthly data are noisy, however, and it will consequently be some time before we can be confident that underlying inflation is moderating as anticipated.


Translation: The recent numbers have been down, but we don't know if the trend will continue.

Recent declines in overall inflation have primarily reflected lower prices for crude oil, which have fed through to the prices of gasoline, heating oil, and other energy products used by consumers.


Inflation's decrease is commodity specific. If oil goes up, we will have inflation problems again.

After moving higher in the first half of 2006, core consumer price inflation has also edged lower recently, reflecting a relatively broad-based deceleration in the prices of core goods. That deceleration is probably also due to some extent to lower energy prices which have reduced costs of production and thereby lessened one source of pressure on the prices of final goods and services.


Oil rears its ugly head again.

The ebbing of core inflation has likely been promoted as well by the stability of inflation expectations.


People aren't freaking out about inflation.

A waning of the temporary factors that boosted inflation in recent years will probably help foster a continued edging down of core inflation. In particular, futures quotes imply that oil prices are expected to remain well below last year's peak. If actual prices follow the path currently indicated by futures prices, inflation pressures would be reduced further as the benefits of the decline in oil prices from last year's high levels are passed through to a broader range of core goods and services. Nonfuel import prices may also put less pressure on core inflation, particularly if price increases for some other commodities, such as metals, slow from last year's rapid rates.


Right now, the trend in oil prices is down. That's good.

But as we have been reminded only too well in recent years, the prices of oil and other commodities are notoriously difficult to predict, and they remain a key source of uncertainty to the inflation outlook.


Remember -- we're talking about oil.

The contribution from rents and shelter costs should also fall back, following a step-up last year. The faster pace of rent increases last year may have been attributable in part to the reduced affordability of owner-occupied housing, which led to a greater demand for rental housing. Rents should rise somewhat less quickly this year and next, reflecting recovering demand for owner-occupied housing as well as increases in the supply of rental units, but the extent and pace of that adjustment is not yet clear.


Here, Bernanke is talking about owner's equivalent rent, which is used in calculating the official inflation rate. Instead of using the actual price of a house, the Bureau of Labor Statistics uses OER, hoping to get a measurement of the investment value of the home. Yes, this is an economic way of saying, "we're basically rigging the number with a heavily downward bias, especially in an overbuilt real estate market."

Upward pressure on inflation could materialize if final demand were to exceed the underlying productive capacity of the economy for a sustained period. The rate of resource utilization is high, as can be seen in rates of capacity utilization above their long-term average and, most evidently, in the tightness of the labor market. Indeed, anecdotal reports suggest that businesses are having difficulty recruiting well-qualified workers in certain occupations. Measures of labor compensation, though still growing at a moderate pace, have shown some signs of acceleration over the past year, likely in part the result of tight labor market conditions.


Econ 101: when demand is greater than supply, prices increase.

The implications for inflation of faster growth in nominal labor compensation depend on several factors. Increases in compensation might be offset by higher labor productivity or absorbed by a narrowing of firms' profit margins rather than passed on to consumers in the form of higher prices; in these circumstances, gains in nominal compensation would translate into gains in real compensation as well. Underlying productivity trends appear favorable, and the markup of prices over unit labor costs is high by historical standards, so such an outcome is certainly possible. Moreover, if activity expands over the next year or so at the moderate pace anticipated by the FOMC, pressures in both labor and product markets should ease modestly. That said, the possibility remains that tightness in product markets could allow firms to pass higher labor costs through to prices, adding to inflation and effectively nullifying the purchasing power of at least some portion of the increase in labor compensation. Thus, the high level of resource utilization remains an important upside risk to continued progress on inflation.


If companies start raising prices to make-up for an increase in wages, we could have more inflation.

Monetary policy affects spending and inflation with long and variable lags. Consequently, policy decisions must be based on an assessment of medium-term economic prospects. At the same time, because economic forecasting is an uncertain enterprise, policymakers must be prepared to respond flexibly to developments in the economy when those developments lead to a re-assessment of the outlook. The dependence of monetary policy actions on a broad range of incoming information complicates the public's attempts to understand and anticipate policy decisions.


This whole thing could change at a moments notice.

Personally, I don't think this is a very bullish statement. It seems like Bernanke is saying the same thing he always says. The Fed is data dependent. Things can change. Oil's a huge wild card.

Obviously, the market thinks differently. And the market's actual reaction is more important than in individual's interpretation.

It's Valentines Day

I am in court this morning. I may get back to the office after that or not. It all depends on the judge. Here's the first rule of being a lawyer: in court, the judge wins.

Starting in the early to mid afternoon, I am spending the rest of the day with my girlfriend. It is Valentine's Day which should bring out the romantic in all of us.

In other words, posting will be light today. As it should be for us all.

Happy Valentine's Day.

Tuesday, February 13, 2007

Foreclosures Up 25% in January

From CBS Marketwatch:

The number of U.S. homes entering the foreclosure process because of nonpayment on mortgages rose to 130,511 in January, 25% more than in January 2006, according to data released Monday by Realtytrac Inc.

The foreclosure rate was one for every 886 U.S. households.

The 130,511 foreclosures is the highest monthly total since the firm began tracking national foreclosures two years ago. Foreclosures were up 19% compared with December.


This data set is only two years old, so reading too much into it is a bit dangerous. But, 25% is a big jump and too large to be considered statistical noise.

I also wanted to add that if memory serves, the national foreclosure rate is still pretty low by historical standards. If someone has a chart on an exact figure, please chime in.

Title And Surety Sector Looks Vulnerable To Short Sellers

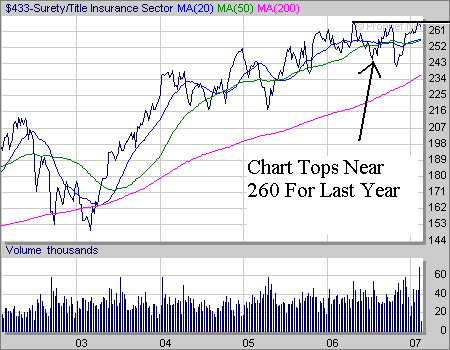
As I mentioned below, the local biz radio network was talking about how to play the sub-prime mortgage (SPM) break-up. They mentioned the surety/title insurance sector would be the next to get hit. Here's a chart of that sector from Prophet.net.

Photobucket - Video and Image Hosting

The sector has not been able to get above the 260 market, despite three different tries. That indicates it may be vulnerable to short selling or investors who are nervous about the SPM market.

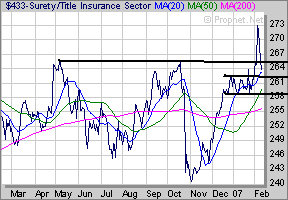
Here's a 1-year chart (sorry about the size. I'm cheap, so I use their free site).

Photobucket - Video and Image Hosting

Notice how the last few days have really hammered the sector. There's an area of congestion in the 258 - 261 area that should provide some technical support. But if the sector breaks through that area there's a lot of downward room to move.

For those of you who are interested in looking in more detail, go to the Prophet.net site. There's a link on the right. I think it's one of the best sites out there.

Another Sub-Prime Lender Files For Bankruptcy

From Bloomberg:

ResMae Mortgage Corp., a U.S. home lender to people with bad credit, filed for bankruptcy protection and said Switzerland's Credit Suisse Group agreed to buy most of its assets for $19.1 million.

``The subprime mortgage market has recently been crippled,'' ResMae said in its Chapter 11 filing yesterday. The company didn't have enough reserves to cope with an ``enormous'' surge in loan defaults, it said.

Closely held ResMae is at least the 20th mortgage company to be sold or closed as delinquencies rise and the market for home loans to risky borrowers contracts at the fastest pace ever, according to a Bloomberg tally of company announcements. Credit Suisse rivals Merrill Lynch & Co., Morgan Stanley and Barclays Plc are swooping in, buying home lenders to produce more revenue from packaging the loans into bonds.


WOW -- I had not realized the number of SPM lenders to either be sold or closed was at 20. I've followed the big stories of the last few months, but I have obviously missed a few.

I was listened to the Biz radio network today, and they mentioned the next domino to fall would be the mortgage insurers. That makes a lot of sense.

Trade Deficit Expands and Sets Another Record

From Bloomberg:

he U.S. trade deficit increased more than forecast in December as the price of imported petroleum rose and purchases of foreign cars and consumer goods reached records.

The gap between imports and exports widened 5.3 percent to $61.2 billion in December, from a 16-month low of $58.1 billion in November, the Commerce Department said today in Washington. For all of 2006, the trade imbalance expanded to a record $763.6 billion.

Higher petroleum prices in December increased the value of oil and gas imports into the U.S. Prices have since receded, and economists expect economic growth overseas, combined with the continued weakness in the dollar, will boost demand for U.S. products and keep the trade gap in check.

``The big picture is exports are growing, but in '06, imports grew faster, particularly consumer goods from China,'' said Chris Low, chief economist at FTN Financial in New York. ``We are looking for a small downward revision'' in fourth- quarter economic growth based on today's figures, he said.


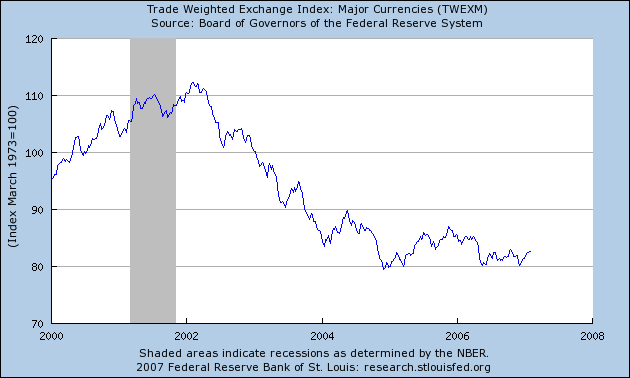
Now we understand why the dollar chart for the last 4-years is in a big downtrend.

Photobucket - Video and Image Hosting

Housing Bottom? Not This Year

From CBS Marketwatch:


"I don't think we've seen the bottom," said David Berson, chief economist for Fannie Mae. "We're going to see a much bigger drop in investor demand this year. But by the second half of the year the market will stabilize, if investors pull out quickly."

Berson said he expects the home-price index calculated by the Office of Federal Housing Enterprise Oversight will show a nationwide decline in values for 2007, the first time that will have happened since the data began being collected in 1975. Unlike other measures, the OFHEO data measure the price changes on the same homes over time, meaning the index is less likely to be skewed by the types and locations of sales.

"It won't be a big decline, maybe 1%. And the declines will be far more centered in areas that have had the most investor activity," he said. "Real home-price gains, adjusted for inflation, will be negative this year, next year and possibly the year after that."


One of the big problems with national housing statistics is they group low-activity areas with high-activity areas. So the national number includes Boise Idaho and Southern California. These two areas are not comparable, but we lump them together in the national number. However, that means a drop at the national level would be pretty severe because the hot areas are seeing a large enough drop in price to lower the national, macro-statistic.

It's also very telling that the statistics have not declined in 30 years.

The biggest problem the housing market faces is "a seriously large inventory situation," said David Seiders, chief economist for the National Association of Home Builders, which is hosting the International Builders Show here this week. Seiders said the housing boom in 2004 and 2005 produced at least 400,000 more housing units than demand could support, and builders are having to push hard to move those homes off the market.


There is a ton of inventory on the market right now. The amount of vacant houses on the market is at record levels by a large margin.

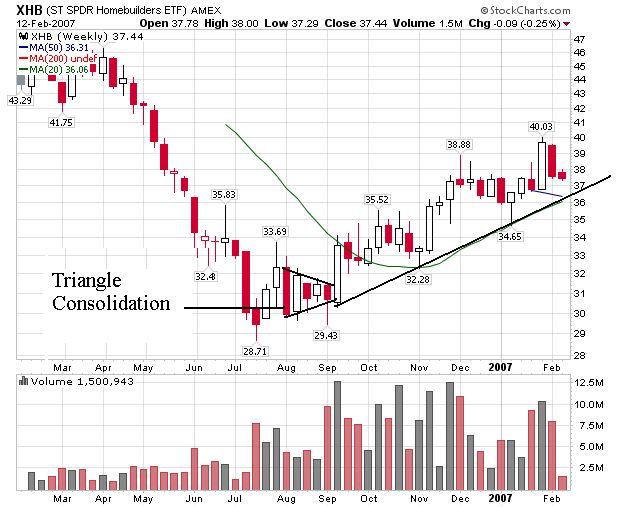
Here's a weekly chart of the homebuilders ETF from Stockcharts:

Photobucket - Video and Image Hosting

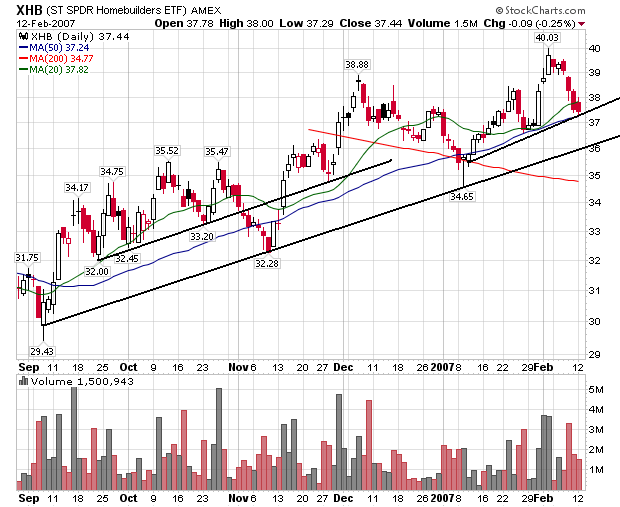
The sector consolidated in a triangle bottom in August before participating in the last 2006 rally. Here's a closer look at the late 2006 rally.

Photobucket - Video and Image Hosting

We have a primary trend ling with a few minor supporting trend lines. There was an article in the latest edition of Barons asking of the homebuilders rally had run its course. We'll have to wait and see how that plays out.

Monday, February 12, 2007

Market Hammers Mortgage Lenders

From Bloomberg:

Countrywide Financial Corp. and New Century Financial Corp. led shares of mortgage companies down for a third day as rising defaults drove the perceived risk of owning bonds backed by ``subprime'' loans to a record high.

Shares of Irvine, California-based New Century, the second- largest company that specializes in lending to people with low credit ratings, fell $1.01, or 5.5 percent, to $17.21 in New York Stock Exchange composite trading. Countrywide, based in Calabasas, California and the nation's biggest home lender, fell $1.37, or 3.3 percent, to $40.84.

Subprime loans that have gone bad are at the highest level in at least six years, according to a Friedman, Billings, Ramsey Group report. The U.S. Mortgage Bankers Association said payments were late on almost 13 percent of subprime loans in the third quarter of 2006, and Bear Stearns Cos. President Warren Spector predicted last week problems will get still worse this year.

``There's just a lot of uncertainty,'' said Richard Eckert, an analyst at Los Angeles-based Roth Capital Partners. ``The market reacts a lot more hostilely to uncertainty than it does to bad news.''


13% of loans were late. That's an extraordinarily high amount of loans going bad. And we are just beginning to see the problems with the 2006 vintage loans. I would expect those numbers to really hit home in the next 9-12 months.

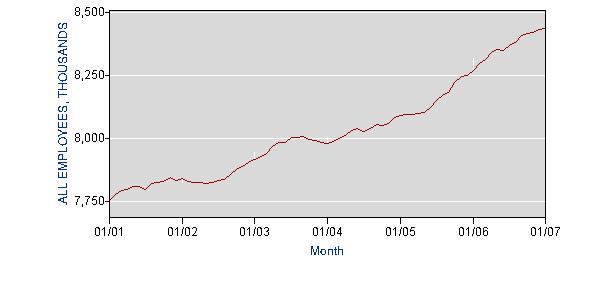
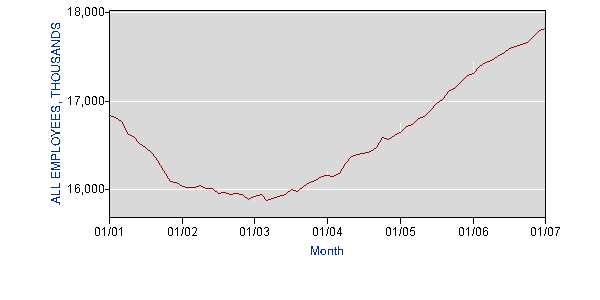
Here's where this will really start to hit home: jobs. If memory serves, the Blog Calculated Risk has projected construction job losses in the 200,000 - 400,000 range. Let's look at job growth in two other areas:

Financial services (mortgage lenders):

Photobucket - Video and Image Hosting

And Professional jobs (real estate brokers)

Photobucket - Video and Image Hosting

Let's assume for a minute that 10% of the above created jobs are related to real estate (actually, I have no idea what the actual percentage is). Eyeballing the professional services chart gives us about 1.8 million jobs and doing the same for financial services we get 500,000 from trough to peak. Neither of these areas has seen any major downturn in the last year. 10% of each sector gives us a total of 230,000 jobs. That's not good going forward.

America's Workers: Boxed In

Committee hearings on Capitol Hill focusing on the abuse of taxpayer funds, Iraq re-construction process and wrangling in the Senate over non-binding resolutions on Bush’s Iraq war have understandably taken center stage in recent media coverage. But there’s another set of congressional hearings under way equally as important for America’s workers.

Rep. George Miller, head of the House Committee on Education and Labor, on Jan. 23 launched hearings on Strengthening America's Middle Class: Finding Economic Solutions to Help America's Families.

The committee is considering three main items:
  • Creating a competitive economy that includes good new jobs that pay well.
  • Restoring workers' rights—including their freedom to bargain for better wages and benefits.
  • Making health care more affordable and accessible.
Or, as AFL-CIO Secretary-Treasurer Richard Trumka summarized when the hearings reconvened Feb. 7:
Why, in the richest country in the world, is it so difficult for so many families to make a living by working?

It’s safe to say that in the Republican-controlled Congress of recent years, this committee—which under Republicans was renamed the Committee on Education and Economic Opportunities, in a deliberate slap at unions—never considered the growing economic distress of the middle class.

When hearings opened Jan. 23, William Spriggs, an economics professor at Howard University in Washington, D.C., told committee members the economic recovery, which began six years ago, has not benefited working families. Instead it has meant more money for the rich while working people and the poor have seen their standard of living stall or drop.

One cause of the widening gap, says Spriggs, is the failure to raise the minimum wage for 10 years. But that’s only one source of the problem. Says Spriggs:
The other source is the redistribution of corporate income, from wages to capital income. The latest data from the Bureau of Economic Analysis shows that the share of corporate-sector income going to wages is down to its lowest share in over 25 years….The latest CBO [Congressional Budget Office] figures show that almost 60 percent of capital income goes to the top 1 percent in the U.S. income distribution.
Behind the unequal distribution of the nation’s wealth is a much more fundamental change in our country’s economic policies, according to Trumka. He told the committee:
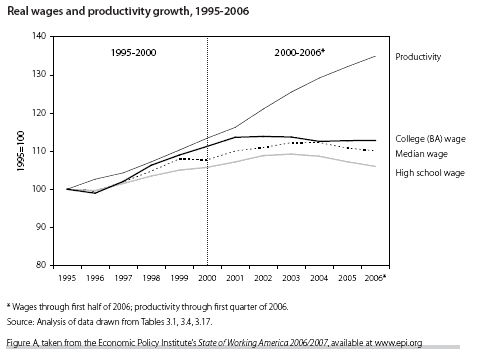
The shift in economic policies in the late 1970s from a “Keynesian consensus” to what George Soros has called “free market fundamentalism” explains much, in my view, about changing corporate behavior, the imbalance of power between workers and their employers, stagnating wages and the growing divide between productivity and wages.
Describing “free market fundamentalism” policies as a box that systematically weakens the bargaining power of America’s workers and drives the growing inequality of income and wealth in our country, Trumka continued:
On one side of the box is “globalization,” unbalanced trade agreements that force American workers into direct competition with the most impoverished and oppressed workers in the world, destroy millions of good manufacturing jobs and shift bargaining power toward employers who demand concessions under the threat of off-shoring jobs.

On the opposite side of the box are “small government” policies that privatize and de-regulate public services and provide tax cuts for corporations and the wealthy, all to “get government off our backs.”

The bottom of the box is “price stability.” Unbalanced macro-economic policies that focus exclusively on inflation and ignore the federal government’s responsibility to “maximize employment,” even out the business cycle and assure rapid economic growth.

The top of the box is “labor market flexibility,” policies that erode the minimum wage and other labor standards, fail to enforce workers’ right to organize and bargain collectively and strip workers of social protection, particularly in the areas of health care and retirement security.
Climbing out of this box won’t be easy.

Bottom line, Trumka told committee members: We need to follow three important economic values that resonate powerfully with all Americans:
  • Anyone who wants to work in America should have a job.
  • Anyone who works every day should not live in poverty, should have access to quality health care for themselves and their family and should be able to stop working at some point in their lives and enjoy a dignified and secure retirement.
  • American workers should enjoy the fundamental freedom to associate with their fellow workers and, if they wish, organize unions at their workplace and bargain collectively for dignity at work and a fair share in the value they help create.
We took a step in recent days toward achieving the last goal with the introduction of the Employee Free Choice Act in the House, which I discussed here in detail last week.

And in coming weeks, we are looking forward to a robust discussion on creating policies that encourage family-supporting jobs stay in this country and developing new strategies for ensuring working families have access to quality, affordable health care. Economists in a new progressive network, the Agenda for Shared Prosperity, will publish issue papers on these and other critical topics for America’s working families.

In its debut media conference, the Agenda for Shared Prosperity, a project spearheaded by the Economic Policy Institute (EPI), highlighted a paper by EPI economist Jeff Faux on globalization and economist Jacob Hacker’s plan for health care reform. The next series of papers will be released Feb. 22 in an event that may include New York Times columnist Paul Krugman, and we’ll be back here with the details.
A Tale of Two Currencies

I wanted to follow up with charts of the post I cross-posted from the Forex Blog, because that post concisely explained the current situation in the currency markets.

First, here's what the FB said about the euro:

The British Pound and Euro represent suitable alternatives to the USD. Both are strong currencies backed by political and monetary stability, as well as strengthening economies and rising interest rates. Risk-averse investors can already earn comparable returns from the side of the Atlantic opposite the US. In addition, as European capital markets expand and develop, foreign investors are discovering new assets to scoop up. Private equity and other forms of alternative investing are booming in Britain and the EU, which means even investors in search of risk have options in Europe.


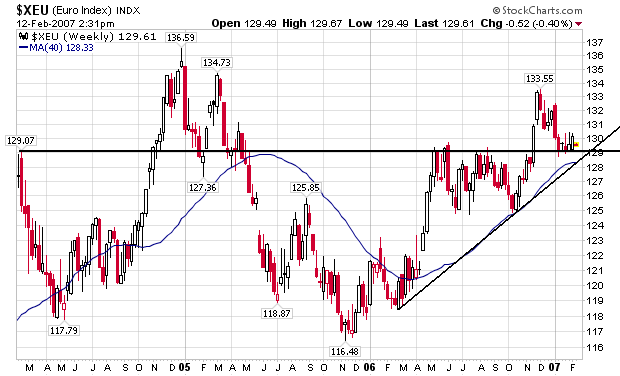
Here's a chart of the euro, courtesy of stockcharts:

Photobucket - Video and Image Hosting

Notice the euro has been in an uptrend for the last year. It is currently testing support at roughly 129. Looking at the chart, 129 looks like an important number for the euro. If it successfully tests this level another solid rally looks very possible.

Here's what the FB said about the dollar:

The USD has begun 2007 in neutral, idling against most of the world’s currencies, even gaining a few PIPS. However, this current period most likely represents a respite-rather than a reversal-from the USD’s long-term downward trend. The fundamentals behind the USD haven’t changed; if anything, they have worsened. Meanwhile, as the price of oil sinks back to sustainable levels and Central Banks move to diversify their reserves, governmental demand for USD-denominated assets may begin to stall.


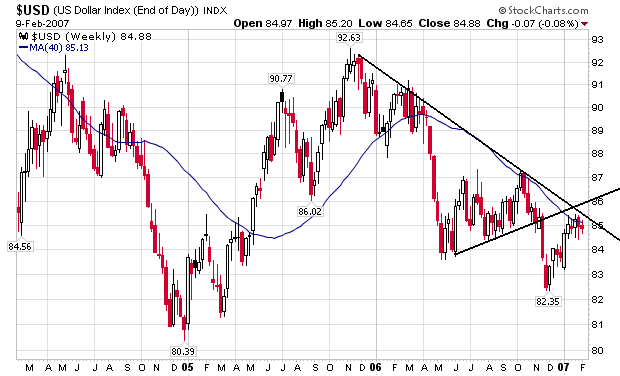
And here's a chart for the dollar that represents everything the FB said about the dollar.

Photobucket - Video and Image Hosting

Starting from the end of 2005, the dollar has been on a clear downward trajectory. Given the clusters of small candles at the top of the latest upward move, it's doubtful the dollar will be able to break the downward trend.

More on Today's Oil News

From CBS Marketwatch:

The world oil market is in "much, much better health and balance" now and, if trends hold, there will be no need for further production cuts or increases in supply when members of the Organization of Petroleum Exporting Countries meet in March, Saudi Arabian Oil Minister Ali Naimi was quoted as saying in a media report.

Naimi said the kingdom's production is now 8.5 million to 8.6 million barrels a day, confirming its reduction by 1 million barrels a day from its output about six months ago, The Journal said. Mostly mild winter weather, heavy selling by financial funds and falling oil use among developed nations have contributed to prices dropping from the record $77.03 a barrel settlement price last summer, The Journal said.

Saudi Arabia's 1-million-barrel-a-day reduction, reported in The Journal in January, is nearly double what it agreed to under two OPEC output cuts hammered out by the cartel at meetings in Doha, Qatar, in October and in Abuja, Nigeria, in December.


We have two major oil producers lowering supply by 1 million BPD each. At the same time we had a mild winter in the US, lowering supply. In other words, we have lower supply and lower demand, at least for now.

According to the latest This Week In Petroleum oil stockpiles are above average and gasoline stockpiles are spiking. This may mean a lowered short-term demand from the US, further lowering prices.

However, we still have India and China growing at a quick pace. This may ameliorate the drop-off in US demand.

And remember we are dealing with oil -- a commodity located in a geopolitically unstable region.

So -- short version, $60/bbl still seems to be the line where certain energy stocks may start to rally. That's a completely arbitrary line on my part. So while the short-term pull-back in oil makes a move into the energy sector unwarranted today, a return to that level in the oil market may still be attractive when and if that level comes.

Saudi And Qatar Say They Probably Won't Cut Oil Production Further

Over the weekend, I discussed how to play the energy market. That theory was based on oil rising about and staying about $60/bbl. This news obviously hurts that play a great deal.

Oil tumbled $1 to $59 a barrel on Monday after the oil ministers of Saudi Arabia and Qatar said OPEC may well keep output unchanged at its March 15 meeting.

Ali al-Naimi, oil minister of the world's biggest exporter, said in an interview with the Wall Street Journal the oil market was in "much, much better health and balance".

U.S. crude was down 79 cents at $59.10 a barrel at 1024 GMT, having fallen as low as $59.61.

London Brent crude slid 81 cents to $58.20.

"If you are asking me are we going to make additional cuts or increase supply I do not know...But, most probably if the trend is like it is today with the market getting in much, much better balance, there may not be any reason to change," he said.

The remarks were consistent with comments Naimi made on Jan. 16, when oil was nearer $51. The Saudi view won immediate backing on Monday from Qatari Oil Minister Abdullah al-Attiyah.

Only On the Web -- Sub Prime "Implode - o- meter"

Keep up with all the defaults in the sub-prime mortgage business.

Sunday, February 11, 2007

Sub Prime Mortgage Bond Risk Rises

From Bloomberg:

The perceived risk of owning low-rated subprime mortgage bonds surged today after the two largest U.S. lenders reported growing problems stemming from the loans, an index of credit-default swaps suggests.

An index used to create swaps based on 20 BBB- rated bonds sold in the second half of 2006 and consisting of home loans to the riskiest borrowers fell 1.7 percent to about 89.05 today, the lowest since it was created Jan. 18. Before today, the so-called ABX index was down 10 percent since its introduction.


We had the second round of sub-prime mortgage (SPM) problems last week with NEW and HSBC having to restate earnings and increase their loan loss reserve, respectively.

In December we had OWNIT mortgage, Sebring Capital and Mortgage Lenders Network all either close, seek bankruptcy protection or both.

Redfish posted this link that noted Merrill Lynch is calling in some loans:

Merrill Lynch & Co. -- which has been stung by two high-profile subprime bankruptcies in six weeks -- is conducting margin calls on certain B&C originators that receive financing through the firm's warehouse group.


If Merrill is pulling up the liquidity ladder, expect other brokers who financed sub-prime mortgages to do the same.

Forex Blog on the US Dollar

This post from the Forex Blog sums up the basic problems the US dollar faces. It also explains why the US dollar is probably headed lower. I think this commentary explains the basic problems facing the dollar, which are structural in nature. Therefore, they can't be cured with quick fixes.


The USD has begun 2007 in neutral, idling against most of the world’s currencies, even gaining a few PIPS. However, this current period most likely represents a respite-rather than a reversal-from the USD’s long-term downward trend. The fundamentals behind the USD haven’t changed; if anything, they have worsened. Meanwhile, as the price of oil sinks back to sustainable levels and Central Banks move to diversify their reserves, governmental demand for USD-denominated assets may begin to stall.

The British Pound and Euro represent suitable alternatives to the USD. Both are strong currencies backed by political and monetary stability, as well as strengthening economies and rising interest rates. Risk-averse investors can already earn comparable returns from the side of the Atlantic opposite the US. In addition, as European capital markets expand and develop, foreign investors are discovering new assets to scoop up. Private equity and other forms of alternative investing are booming in Britain and the EU, which means even investors in search of risk have options in Europe.

Moreover, Asia and the Middle East are in early stages of developing regional currencies, which would also pose a threat to the dominance of the USD as the world’s reserve currency. As the global economy becomes more stable and as European and Asian capital markets surpass their American counterparts in size and clout, investors will no longer feel compelled to pool their wealth in American securities.

As former Treasury Secretary Robert Rubin recently noted, the only thing that is propping up the USD is that the demand for US assets (i.e. stocks and bonds) still exceeds supply. However, as equity prices approach levels never before seen and as the supply of bonds either dries up or yields are driven down to completely unattractive levels, the US will certainly lose its appeal to foreign investors and the USD will follow the foreign demand for US assets downward.

The Week Ahead

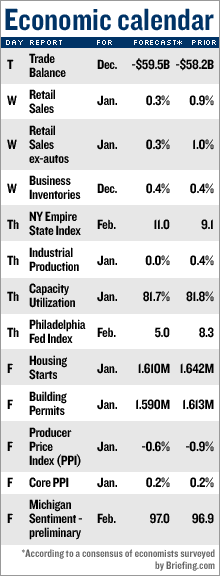
It's going to be a busy week:

Photobucket - Video and Image Hosting

A few points:

I've been critical of the retail sales numbers for the last two months because the official number did not jibe with the news on the ground. I was right regarding November's number, which was revised down. Now we'll see about December's number.

The NY Fed and Philly Fed numbers will be very important. Most of the Fed manufacturing districts had lower numbers in their latest report. In addition, the Chicago PMI has been decreasing for the last year and dropped below 50 in the latest survey. This also ties in with industrial production. Although it rose .4% in December the 4th quarter number was negative.

Housing starts -- let's see if the builders are going to continue to add to an already overbuilt situation.

PPI -- All of the Fed governors have warned on inflation in their latest public speeches. That makes this number perhaps a bit more important.

Bernanke address Congress on Wednesday.