Saturday, September 30, 2023

Weekly Indicators for September 25 - 29 at Seeking Alpha


 - by New Deal democrat


My Weekly Indicators post is up at Seeking Alpha.

Interest rates continued to head higher, with mortgage rates briefly going over 7.5%. With the long leading indicators having worsened, With the decline in commodity (including gas) prices over, I am looking for evidence that the short leading indicators are also beginning to turn lower.

As usual, clicking over and reading will bring you up to the virtual moment as to the state of the economy, and reward me a little for my efforts in organizing the data.

Friday, September 29, 2023

Consumer spending holds up well in August, despite ending of disinflation


 - by New Deal democrat


As I have repeated for the past several months, in the current economy the personal spending and income report is just as important as the jobs report. That’s because, despite the downturn in manufacturing production and many parts of the housing market, consumer spending especially on services has continued to power the economy forward.


Today’s report generally showed a continuation of this slow but steady improvement in almost all of the metrics since June 2022, when gas prices peaked at $5.

Real personal spending rose 0.1%, while real personal income rounded to unchanged in August, as shown in the below graph in which both real personal income (red) and spending (blue) are normed to 100 as of the onset of the pandemic:


The NBER has indicated they place great weight on both of these, and neither are consistent with the onset of recession.

Another of the important coincident measures for the NBER, real personal income less government transfer receipts, also rose a slight 0.1%, and is up 1.7% from a year ago:


This series has risen pretty consistently since the peak of gas prices at $5 in June 2022.

On the spending side, here’s how goods vs. services spending compare. I show this because real spending on goods has in the past declined months in advance of recessions, while real spending on services has frequently powered right through. Both of these also increased in August, another positive sign:


Meanwhile, the personal saving rate - income that isn’t spent - declined further to 3.9%:


There were extensive historical revisions to this series published yesterday. Last month was initially reported at 3.5%, but as you can see that has been revised away. Last month Inwrote that “With the exception of several months last year, and the 2005-07 lows, the personal saving rate is at its lowest level ever.” This has also mainly been revised away. The net effect is that consumers are less vulnerable to shocks than it previously appeared. Further, the savings rate typically rises before recessions, as consumers get more cautious. Needless to say, that isn’t happening now.

The one negative in today’s report was that the deceleration in the personal consumption deflator, which started with the peak in gas and commodity prices generally in June 2022, has likely ended. The PCE deflator, the chain type measure of inflation in this report, rose 0.4% in August, the highest monthly change since January. On a YoY basis, prices are up 3.5%. This was the second increase in a row:


Finally, the personal consumption deflator gets used in the calculation of real manufacturing and trade sales, which is another important coincident indicator monitored by the NBER. These rose a sharp 0.8% in August to within 1% of their December2021 record, and are well above their June 2022 low:


Two months ago I summed up by writing about this report with “If that tailwind [of YoY decelerating prices] is ending - and I suspect it is - what happens next?” So far, sales and spending are certainly holding up. The next big clue will be whether the deceleration in hiring continues in next Friday’s jobs report.

Thursday, September 28, 2023

Initial jobless claims remain higher on a YoY basis, but do not suggest near term recession


 - by New Deal democrat


Initial jobless claims rose 2,000 last week to 211,000. The 4 week moving average declined -6,250 to 211,000. With a one week lag, continuing claims rose 42,000 to 1.670 million:


Although this appears very strong on an absolute scale, we had a very similar sharp decline to new 50 year lows last September as well, which make me think that there is some unresolved post-pandemic seasonality in play.

On the YoY% basis more important for forecasting, initial claims were up 12.1%, the 4 week average up 10.8%, and continuing claims up 29.5%:


While this indicates weakness, it does not cross the 12.5% threshold which would suggest a recession is likely.

On a monthly basis, so far in September initial claims are up 10.8%. Since initial claims lead the unemployment rate by several months, this implies that the average unemployment rate by the end of this winter is likely to be approximately 4.0% (i.e., one year ago the average unemployment rate was 3.6%; 3.6*1.108 = 4.0):


Again, this suggests a weakening of the jobs market ahead, but does not yet indicate a recession in the immediate future.

Wednesday, September 27, 2023

Why the public still views inflation as a major problem, despite the official numbers


 - by New Deal democrat

This is the topic I indicated last week I wanted to write about more at length.  Paul Krugman wrote last week about the disconnect between most economists, who see inflation declining, and voters, who still see inflation as a major concern. Here’s a couple of his tweets:


As I wrote last week, the “shrinkflation” in new homes is very much a part of why the public continues to believe that inflation remains a big problem. So let me elaborate a little more.

As an initial matter, Krugman is absolutely correct that the official measures of inflation are abating, as shown in the below graph of YoY headline and core inflation:


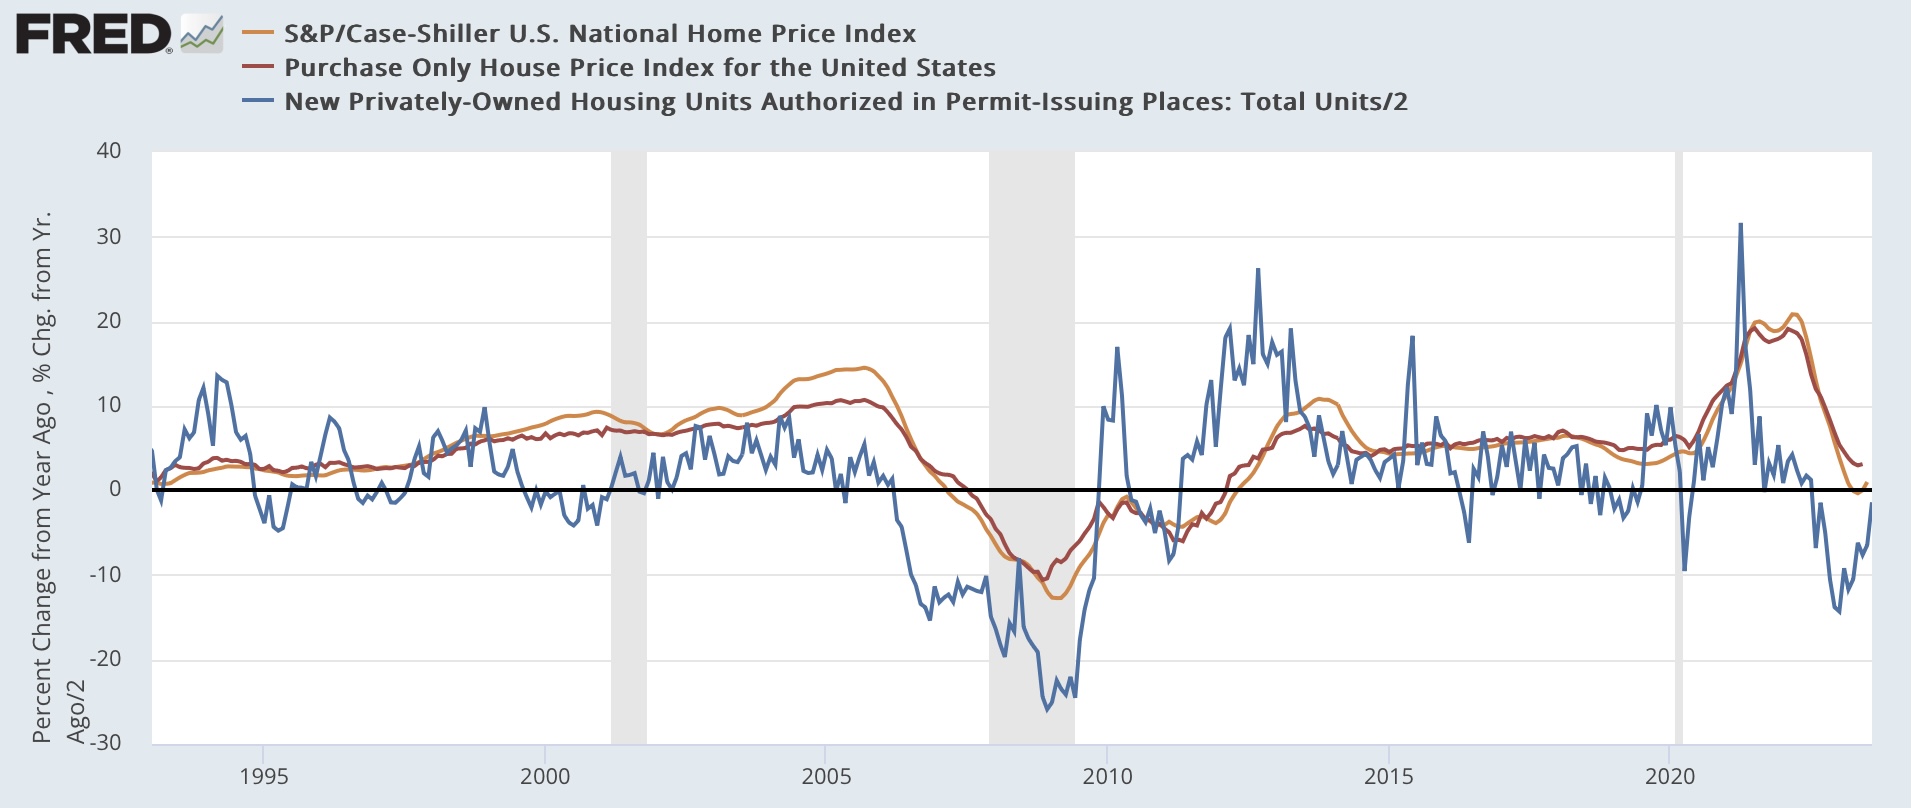
More importantly, when we eliminated fictitious shelter inflation, everything else has risen only 1.0% YoY. And measured by home prices, as we saw yesterday, shelter prices have only risen about 1% YoY as well:


So “inflation” as economists look at it, i.e., the change in prices, is clearly abating.

But consumers don’t just look at price changes like the above, or even price changes as compared with wages. Because there are at least two big expenses - houses and cars - that aren’t just purchased out of pocket, but rely on changes in wealth as well.

And that I suspect is where voters’ perceptions are coming from.

For example, when we look at the prices of new and used vehicles compared with wages, we see that new cars cost no more compared with wages than they did before the pandemic. Both have increased by about 20%; and indeed the long term view shows that new vehicles cost less than they typically did as a share of wages over the past 30 years. Used vehicles, on the other hand, still do cost about 15% more:


But most people finance their vehicle purchases. And interest rates on vehicle loans have risen from roughly 5% to 7.5%:


So the monthly payment for a new car is about 50% higher than it was before the pandemic, and for a used vehicle it’s about 80% higher (1.2*1.5). If I am calculating my monthly car payment in how I look at inflation, that’s a big increase.

The situation is even more stark when it comes to housing. Compared with wages, house prices are still 15% higher than they were before the pandemic:


On top of that, as I wrote yesterday, mortgage rates at 7.5% are now 2.5* higher than they were at 3%. So the total monthly payment for a new house is nearly 3x as much as it was in 2019.

In other words, to summarize: the two biggest purchases made by most people have gone up about 80% and 200%, respectively. From the viewpoint of their monthly payment, inflation is a huge problem - despite officially rising less than 3%.

Tuesday, September 26, 2023

New 20+ year record high mortgage rates begin to impact home sales; bifurcation in new vs. existing home prices continues


 - by New Deal democrat


In addition to updated reports on new home sales and prices, and existing home prices this morning, there’s some very important news on mortgage rates.

Namely, at 7.51%, mortgage rates are the highest they have been since December 2000. Here’s what they looked like through the end of last week:


As I wrote last week, this has caused a seizing up of the existing home market, with sales down 40% from their peak over a year ago.

This is also going to worsen the new home market, which has held up better until now due to builders cutting prices. As per usual, interest rates lead sales, represented by housing permits in the YoY graph below:


Permits were already down a year ago, and despite their recent rebound it is likely they will decline further from those levels.

Further, sales lead prices. For existing homes, both the FHFA and Case Shiller reported this morning through July, with both showing monthly increases of 0.8% and 0.6% respectively. The FHFA index is up 4.6% YoY, and the Case Shiller national index is up 1.0%:


Meanwhile, new home sales declined -64,000 annualized to 675,000, the lowest level since March. This is a very noisy and heavily revised series, but I suspect we are seeing the impact of the recent renewed increase in mortgage rates in this data:


The median price declined slightly to $430,300, and is now almost 15% below its peak from last October:


Here is the comparison of sales and median prices YoY for new homes, showing as per usual that sales lead prices there as well. The first graph is quarterly for the past 20 years to cut down on noise:


The second is monthly for the past 5 years:


Finally, because house prices lead Owners Equivalent Rent in the CPI by roughly 1 year or more, here is the YoY update of that comparison, using the median price index for new homes:


We can expect further disinflationary pressure on OER in the coming months, gradually lessening shelter’s upward pull on both headline and core inflation.