Saturday, February 24, 2007

The Market's Last Week

Here's a chart of the SPYs

Photobucket - Video and Image Hosting

The uptrend is still firmly in place. The SPYs pretty much treaded water last week. They did well off on Friday on decent volume. This indicates there is some selling pressure in the market. But until a downtrend breaks through a level of technical support this type of selling is simply short-term profit taking.

Here's a chart of the QQQQs

Photobucket - Video and Image Hosting

We did have increasing volume on the rally, but again we hit the 45.50 area and met selling pressure. While we do have a mini-rally in place, the average is a bit extended from the 20 day SMA. The last time the QQQQs did this they reverted back to the 20 day SMA. Friday's sell-off had some decent volume. This indicates the market still thinks 45.50 is a selling level.

Here's a chart for the IWNs

Photobucket - Video and Image Hosting

While the market rallied starting in late January and consolidated these gains in a triangle formation in mid-February, volume has steadily headed lower. This indicates a lack of buying enthusiasm as the rally has progressed. At the same time, Friday's sell-off was on lower volume, indicating the selling isn't the most enthusiastic.

Friday, February 23, 2007

Oil, Inflation and Interest Rates

From Bernanke's recent Congressional testimony:

I turn now to the inflation situation. As I noted earlier, there are some indications that inflation pressures are beginning to diminish. The monthly data are noisy, however, and it will consequently be some time before we can be confident that underlying inflation is moderating as anticipated. Recent declines in overall inflation have primarily reflected lower prices for crude oil, which have fed through to the prices of gasoline, heating oil, and other energy products used by consumers. After moving higher in the first half of 2006, core consumer price inflation has also edged lower recently, reflecting a relatively broad-based deceleration in the prices of core goods. That deceleration is probably also due to some extent to lower energy prices, which have reduced costs of production and thereby lessened one source of pressure on the prices of final goods and services. The ebbing of core inflation has likely been promoted as well by the stability of inflation expectations.


Translation: Lower oil prices are a big reason for declining inflation.

Here's an oil chart the includes today's close:

Photobucket - Video and Image Hosting

Ben's not happy right now.

Mortgage Writedowns hit HR Block

From the Street:

The Kansas City, Mo., company reported its mortgage results as discontinued operations, as it's seeking to sell that business. The mortgage operation posted a loss of $69.7 million, or 22 cents a share, compared to a year-ago net profit of $42.4 million, or 13 cents a share.

The loss from discontinued operations "reflects an increase of loan loss reserves of approximately $111 million," it says.

H&R Block announced in November that it was considering "strategic alternatives" for its subprime mortgage business, Option One, which includes a possible sale. The company said Thursday that it expects to make an announcement about that next month.


According to Yahoo Finance, HR Block has $2.7 billion in current assets. That means this loan loss reserve increase won't send the company into bankruptcy court. But, a $111 million increase is more than a merely inconsequential amount. Other sub-prime lenders are having to make the same increases in their respective loan loss provisions.

Oil Closes Above $60/bbl

Here's a chart from stockcharts:

Photobucket - Video and Image Hosting

Looking at the raw data, here's what we have. Starting in mid-January, oil rose from it's lows and ran into resistance at the 50 day simple moving average. For about the next month, traders consolidated these gains. Yesterday, oil closed over the psychologically important level of $60/bbl. In addition, it appears the 20 day simple moving average is about to cross the 50 day average. The price is trading above the 20 and 50 SMA. Finally, the uptrend is still firmly in place. In short, there are a lot of strong technical reasons for this chart to continue moving up.

There were a few fundamental reasons for yesterday's move. The first is geopolitical, as the Iran/US clash is still ongoing and internal strife in Niger threatens oil production. In addition, the Department of Energy reported a decrease in oil stocks for the week. We are also approaching the summer driving season when demand should pick-up. And China and India are still growing at a high clip, adding further upward pressure to prices.

In short, the bulls have a lot to be happy about right now.

The next bullish move would be a retesting of the $60 line in a short sell-off.

Thursday, February 22, 2007

10th District Manufacturing Increases

From the KC Fed:

Tenth District manufacturing activity growth rebounded strongly in February, and expectations for future factory hiring and capital spending rose as well. The majority of price indexes in the survey increased moderately for the second straight month, due largely to rising food prices.

The net percentage of firms reporting month-over-month increases in production in February was 18, up from 5 in January and 7 in December (Tables 1 & 2, Chart). Production accelerated at most types of factories, but especially among producers of machinery and high-tech equipment. The overall year-over-year production index also increased from 19 to 31, and the future production index remained steady after a slight decrease last month. Although sample sizes make it difficult to draw firm conclusions about individual states, the data available suggest that production remained well above year-ago levels in all district states.

Like production, the majority of other month-over-month indexes increased significantly. The new order index jumped from 9 to 20, and the shipments index also increased for the second straight month. Growth in the order backlog index expanded for the first time in four months, rising from -4 to 9. In addition, the employment, new orders for exports, and supplier delivery time indexes all recorded solid gains. The raw materials inventory index increased to its highest level in six months, while the finished goods inventory index remained unchanged.


This is solid news. Last months overall industrial production decreased .5%. This is the second manufacturing survey that has shown strong improvement this month. The first was the NY Fed.

Don't Like the Savings Figure? Redefine it!

From the Mess That Greenspan Made:

Everyone just stop it! If, in some twisted sort of way, redefining "wealth" or "net worth" as "savings" makes you feel better about the world and your own lot in life, then go ahead and do it - just do it in private.

Whatever gets you through the day.

But, please, stop sharing your rationalizations with the rest of us who prefer to continue believing that "savings" (as either a verb or a noun) is not something that can come and go as quickly as a subprime lender.

Call it old fashioned if you want, but, just leave the word "savings" alone. Please.


Click the link. And enjoy. It's about time someone started to mention this on a regular basis.

Sup-Prime Problems Continue

From Bloomberg

The perceived risk of owning low- rated subprime mortgage bonds rose to a record for a fifth day after Moody's Investors Service said it may cut the loan servicing ratings of five lenders.

An index of credit-default swaps linked to 20 securities rated BBB-, the lowest investment grade, and sold in the second half of 2006 today fell 5.6 percent to 74.2, according to Markit Group Ltd. It's down 24 percent since being introduced Jan. 18, meaning an investor would pay more than $1.12 million a year to protect $10 million of bonds against default, up from $389,000.

Moody's said late yesterday that it may cut the so-called servicer ratings for affiliates or units of lenders including Irvine, California-based New Century Financial Corp., the second- largest lender to subprime borrowers. Declines in the ABX-HE-BBB- 07-1 and similar indexes accelerated this month as New Century and HSBC Holdings PLC, the biggest lender, said more of their loans were going bad than they expected. London-based HSBC today said the head of its North American unit stepped down.


The news in this area of the market continues to show deterioration. I will admit I am still very surprised this has not spilled over into the larger economy as a whole in the form of lowered consumer spending or decreased consumer confidence.

Stronger Labor Laws Needed to Address U.S. Income Equality

Photo credit: Office of Communications, Princeton University
Paul Krugman


Those on the reactionary side of the political spectrum are big proponents of equal opportunity-the outcome, whether you make a decent living, live high off the hog or suffer in poverty-is up to the individual.

In today’s U.S. economy, such reasoning is flawed, says economist Paul Krugman. Instead, the nation’s increasingly unequal distribution of wealth translates into unequal opportunity-a principle even conservatives should oppose. An array of forces-including growing imports, the falling real value of minimum wage and slower unionization-have contributed to this growing gap.

Krugman, a professor of Economics and International Affairs at Princeton University, delivered the keynote speech today at the second briefing of the Agenda for Shared Prosperity, a network of more than 50 progressive U.S. economists, policy analysts and academics sponsored by the Economic Policy Institute (EPI). Today’s event, held on Capitol Hill in Washington, D.C., featured top-name leaders spearheading the fight for workers and their families. Although they spoke on a variety of topics, their comments shared a common theme: The American dream is slipping away for many hard-working families, and one of the key ways to restore that dream is by enabling workers who want to join unions to do so.

Krugman, also a columnist for The New York Times, said a powerful union movement bolstered the middle-class economy of the post-World War II decades but, in recent years, a political climate that encourages or at best winks at corporate union-busting has meant fewer workers who want to join unions can do so.

In fact, as professor Harley Shaiken writes in one of the four reports the Agenda for Shared Prosperity released today: “The yawning gap between robust demand to join unions and anemic membership numbers reflects the fact that for many Americans joining a union has become a risky proposition. Twenty-three thousand people a year are disciplined or fired for union activity resulting in a big chill on labor’s numbers and a ‘democracy deficit’ for the entire society.” Shaiken, a professor in the Graduate School of Education and Department of Geography at the University of California, Berkeley, writes in “Unions, the Economy and Employee Free Choice”:
An effective way to address the “democracy deficit” is through the Employee Free Choice Act....It allows workers to form a union if a majority of people in a workplace sign up for one. In addition, it provides meaningful penalties for those who would violate workers’ rights and insures that if workers choose a union collective bargaining actually results. The act restores balance to a system that currently is driven by aggressive employers, anti-union consultants, coercion and fear.
Some 233 co-sponsors are backing the Employee Free Choice Act, introduced in the House earlier this month as H.R. 800, and working families and their unions are taking part in a week of action in more than 100 cities thanking lawmakers who support the bill and urging others to sign on.

In a paper analyzing polling and survey data, economist Richard Freeman from Harvard University further made the case for the need to change the nation’s labor laws that currently are tilted in favor of Big Business. In his report, “Do Workers Still Want Unions? More than Ever,” Freeman concludes that:

In 2002 the proportion of workers who said they would vote for a union rose above the proportion that said they would vote against a union for the first time in any national survey: a majority of nonunion workers now desire union representation in their workplace.

America’s workers know that by joining unions, they can significantly improve their livelihoods, job security and future for their families. As Tom Kochan and Beth Shulman note, millions of America’s working families fail to have the necessary means for basic self-sufficiency—and it looks no better for the next generation. In their report, “A New Social Contract: Restoring Dignity and Balance to the Economy,” they write:

In 2000, the average high-school educated workers age 25–29 started out earning about $5,000 less real income and could expect slower growth in earnings than those who entered the labor force in 1970. Workers with some college started about $3,500 behind their 1970 counterparts.
Kochan is co-director of the Institute for Work and Employment Research at the Massachusetts Institute of Technology and Shulman authored The Betrayal of Work: How Low-Wage Jobs Fail 30 Million Americans and Their Families. They find the decline in middle-class living standards, the elimination of institutions that support a growing middle class and the dramatic increase in income equality experienced in recent years is not the result of some invisible hand.
It is the direct result of policy choices that have undermined the bargaining power of every-day Americans. Instead of instituting policies in this global economy to ensure a broadly shared prosperity, we have made choices that benefit the few.

The implicit social contract that governed work for many years—the norm that hard work, loyalty, and good performance will be rewarded with fair and increasing wages, dignity, and security—has broken down and been replaced by a norm in which employers give primacy to stock price and short term gains at the expense of America’s workers.

As a result, the American Dream is slipping away from millions of Americans and their families. A majority of Amer­icans now worry their children will not be able to improve on the standard of living they experienced growing up. If this is not the legacy we want to leave the next generation, then we need to start now to put in place forward-looking policies and labor market institutions to build a new social contract tailored to today’s workforce, families, and economy.
Throughout the year, the Agenda for Shared Prosperity will address the economic issues facing working families and offer solutions through reports on jobs, the economy, health care and more. In January, the Agenda for Shared Prosperity launch highlighted economist Jeff Faux’s “Globalization that Works for Working Americans” and Jacob Hacker’s “Health Care for America: A Proposal for Guaranteed, Affordable Health Care for All Americans Building on Medicare and Employment-Based Insurance.” In setting out a course of action for coming years, the Agenda for Shared Prosperity seeks to steer a stronger course for the nation’s economy—which some opinion-makers in the Democratic Party deny is headed in the wrong direction. As economist Tom Palley writes this week on TomPaine.com:

This denial was recently on display in a report, "The New Rules Economy," issued by Third Way, an influential new Democrat think tank in Washington. The report denies America’s working families have been shortchanged. In doing so, it misrepresents economic reality, undercuts working families and gives comfort to supporters of corporate excess. That makes the Third Way the wrong way.

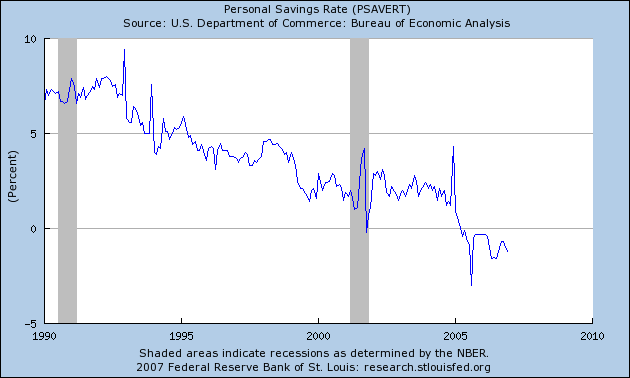
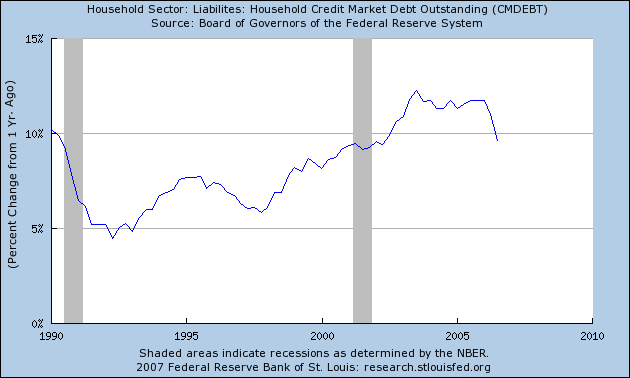
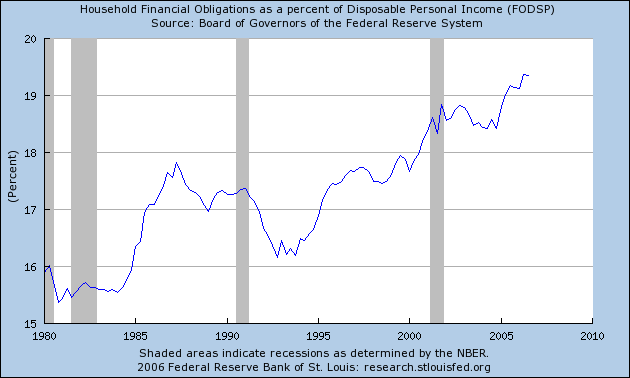
Palley goes on to point out how such groups as the Third Way deny that family income has stagnated and that there is no problem with excessive CEO pay, the massive trade deficit or household debt.

In another TomPaine article, Palley offers a “memo” to presidential contenders in which he suggests a road map for progressive Democrats to reverse the laissez-faire extremism of the past 30 years. Read it here.

Oil Breaks $60/bbl. Will it Close there?

From FxStreet:

Oil broke through the 60 usd level as US stocks of distillates dropped by more than the market had expected

Data from the Energy Information Administration showed that last week distillate stocks, which include heating oil, fell by 5 mln barrels against analysts' expectations of 3.5 mln barrels

Gasoline inventories fell by 3.1 mln barrels against expectations of a 950,000 drop


Closing above $60 will be a significant psychological event.

A Must Read

Go read Fed's Yellen on Housing at Calculated Risk. It's at the top of the page. CR has done a great job with the housing market -- and this article will only solidify his reputation in that regard.

Fed Governor's Comments: We're Not Lowering Rates

From Bloomberg:

Federal Reserve officials, armed with figures showing inflation picking up, made it clear that they aren't close to cutting interest rates.

Hours after the government reported yesterday that consumer prices rose more than forecast in January, San Francisco Fed President Janet Yellen said she supports the Fed's tightening bias. St. Louis Fed President William Poole said in an interview that the central bank must act if inflation fails to subside.

The remarks, together with minutes of January's policy meeting also published yesterday, show the central bank isn't contemplating the rate cuts that some economists still pencil in for later this year. The minutes said the Fed considered, then rejected, changing the paragraph in its statement that describes inflation and the policy stance.

....

Yesterday's comments and minutes reflect Fed Chairman Ben S. Bernanke's congressional testimony last week, in which he gave an upbeat economic assessment and suggested he isn't in a hurry to either restrict or loosen credit. The Federal Open Market Committee has kept the central bank's benchmark rate at 5.25 percent since ending a two-year run of increases in August and voted unanimously to hold it there on Jan. 31.

In the statement released that day, the Fed repeated its stance that ``some inflation risks remain'' along with language in the same paragraph that has become known as the tightening bias: ``The extent and timing of any additional firming that may be needed to address these risks will depend on the evolution of the outlook for both inflation and economic growth.''


Can we please stop talking about a rate cut now? Fed governors have been very clear they are not lowering rates anytime in the near future.

In addition, the main reason for the drop in inflation is oil prices. Right now the oil market is consolidating below $60/bbl and we're approaching the summer driving season. In addition, Iran and the US are having a diplomatic war of words and Niger is still having internal problems.

Miners Looking to Up Investments

From the WSJ:

Prices for some of the world's commodities have slipped in recent months. But big mining companies continue to pump up investment and make plans to carve out more mines -- moves that could bring prices down further in the years ahead.

Anglo-Australian giants BHP Billiton Ltd. and Rio Tinto PLC and other megaminers collectively have projects valued at tens of billions of dollars in the works.

Among them are large expansions in production of iron ore, coal, nickel and other raw materials whose prices have soared in recent years amid demand from China and elsewhere.


The article goes on to note one of the primary reasons for the increase is China's continued growth. While the article did not mention India, I would guess that country's growth also plays into the equation.

Let's take a look at the Copper future's chart:

Photobucket - Video and Image Hosting

Copper dropped in price starting in May of last year. There were a large number of reasons for this drop. Inventories were high. In addition, a ton of money has flowed into the commodities markets over the last few years. In essence, commodities have become the high-tech growth area of this bull market. While there are strong fundamental reasons for this increase (largely related to China and India coming on line as growing economies), there were also a large number of hedge funds etc... moving in. This pumped up commodities prices, perhaps above their actual worth. Be that as it may, China and India are still growing at high rates. That's almost 2 billion people who are seeing an increase in their wages and standard of living who will probably want all sorts of consumer stuff. In other words, these growing economies provide a natural floor to some of these prices.

Here are some industry charts from Prophet.net that show some of the better performing industries. These are 5 year charts, which really show the bull run these stocks have experienced:

Copper companies:

Photobucket - Video and Image Hosting

Steel and Iron

Photobucket - Video and Image Hosting

Metals and Mining:

Photobucket - Video and Image Hosting

Industrial Metals and Mining:

Photobucket - Video and Image Hosting

Obviously there is no guarantee these sectors will continue to move-up. But the fact that industry members are willing to open their wallets and start to increase capacity indicates they are bullish on the future.

Food For Thought.

Toll Brothers Revenue Drops on Cancelations

From the Wall Street Journal:

Luxury-home builder Toll Brothers Inc. said net income fell 67% in its fiscal first quarter, hit by write-downs and an impairment charge. Revenue declined 19%.

The Horsham, Pa., company earned $54.3 million, or 33 cents a share, for the three months ended Jan. 31, down from $163.9 million, or 98 cents a share, a year earlier. The latest results included write-downs of $59 million, or 36 cents a share, and a goodwill-impairment charge of three cents a share, related to the company's 1999 acquisition of the Silverman Companies in Detroit. Excluding the write-downs and charge, first-quarter earnings were 72 cents a share, down 27%.

Revenue fell 19% to $1.09 billion from $1.34 billion.

A survey of analysts by Thomson Financial produced a consensus estimate of 29 cents a share for the first quarter.


This market is nowhere near a bottom yet.

Wednesday, February 21, 2007

FOMC Statement

From the FOMC

All meeting participants expressed some concern about the outlook for inflation. To be sure, incoming data had suggested some improvement in core inflation, and a further gradual decline was seen as the most likely outcome, fostered in part by the continued stability of inflation expectations. However, participants did not yet see a downtrend in core inflation as definitively established. Although lower energy prices, declining core import prices, and a deceleration in owners' equivalent rent were expected to contribute to slower core inflation in coming months, the effects of some of these factors on inflation could well be temporary. The influence of more enduring factors, importantly including pressures in labor and product markets and the behavior of inflation expectations, would primarily determine the extent of more persistent progress. In light of the apparent underlying strength in aggregate demand, risks around the desired path of a further gradual decline in core inflation remained mainly to the upside. Participants emphasized that a failure of inflation to moderate as expected could impair the long-term performance of the economy.


Today's news didn't help. Rates aren't coming down anytime soon. Anyone who thinks differently just isn't reading.

Another One Bites the Dust

From the WSJ:

Late Tuesday, NovaStar reported a net loss available to common shareholders of $14.4 million, or 39 cents a share, in the fourth quarter. A year earlier, the company generated net income available to common shareholders of $26.4 million, or 84 cents a share.

Problems with mortgages originated in 2006 knocked $17.4 million, or 47 cents a share, off fourth-quarter earnings. Provisions for losses on loans NovaStar has been forced to repurchase cut $13.4 million, or 36 cents a share, off results. More provisions for losses on a package of early 2006 mortgages the company securitized cost it another $10.3 million, or 28 cents a share, NovaStar said.


This shake-out is getting really ugly.

Inflation Increases .3%

From the BLS:

The Consumer Price Index for All Urban Consumers (CPI-U) increased 0.3 percent in January, before seasonal adjustment, the Bureau of Labor Statistics of the U.S. Department of Labor reported today. The January level of 202.416 (1982-84=100) was 2.1 percent higher than in January 2006.


From Bloomberg:

U.S. consumer prices rose more than forecast in January as Americans paid more for food, medical care and airfares, suggesting inflationary pressures persist.


From CBS Marketwatch:

U.S. consumer prices increased 0.2% in January, led by large gains in food, medical care and tobacco prices, the Labor Department reported Wednesday.

Core inflation, which ignores movements in food and energy prices, rose 0.3% in January, the biggest increase since June.

The greater-than-expected consumer price index could lessen the odds that the Federal Reserve would cut interest rates. The core CPI is up 2.7% in the past year, a notch higher than the 2.6% year-on-year rate in November and December.


Note that major news outlets are saying this increase is more than forecast.

There were big jumps in food and beverages (up .7) and medical care (up .8). Energy decreased 1.5%, but it's important to remember oil dropped mid-January and rebounded later in the month (see below).

The compound annual 3-month growth rate was 2% -- right at the upper-end of the Fed's comfort zone. The unadjusted 12-month growth rate was 2.7%.

For some reason, there has been a call for the Fed to decrease interest rates. The problem with this prediction is all of the Fed governors have stated inflation is still too high for each governor's personal preference. In other words, rates aren't coming down anytime soon. This report simply solidifies that situation.

Oil Market Update

The chart below indicates two trends. The first is an upward trend started in mid-January. The second is a consolidation trend started in mid-February.

Photobucket - Video and Image Hosting

We have the following currents in the markets right now:

Bullish:

Since then rising political tension involving Middle Eastern and African oil producers and reduced output from the Organization of the Petroleum Exporting Countries has provided some support for prices, but they have struggled to break above $60 a barrel.

OPEC member Iran, the world's fourth biggest oil exporter, which has been in dispute with the West over its nuclear ambitions for well over a year, remains defiant.

On Wednesday, it vowed to press on with its nuclear fuel programme, ignoring a U.N. deadline to freeze uranium enrichment or face broader sanctions, but it offered to guarantee it would not try to develop nuclear weapons. [nL2194927]

Tensions are also rising in Africa's biggest producer Nigeria ahead of April elections. Already militant attacks have shut a fifth of output.


Bearish:

Mild weather in top consumer the United States has cut into demand, however, and is acting as a drag on prices. U.S. heating oil demand is expected to be about two percent below normal this week, the U.S. National Weather Service said.


Finally, we have the upcoming summer driving season which is a net plus for demand.

So -- how will this play out? Only time will tell.

Projections of the Housing Hangover

From Bloomberg:

New and existing home sales dropped almost 10 percent last year, depressing demand for products from copper pipes to kitchen sinks and resulting in the loss of about 100,000 jobs in the U.S. Housing-related unemployment probably will increase in 2007, according to the Joint Center for Housing Studies at Harvard University in Cambridge, Massachusetts.

Even if the housing market improves in the second half of 2007, as the National Association of Realtors predicts, sales of furniture and construction supplies will stagnate, said Amal Bendimerad, a research analyst at the Harvard center. Housing and related industries account for about 23 percent of the economy, according to the center.

``Appliance manufacturers and other suppliers are already feeling the heat, but they may not feel the full impact until the end of 2007,'' Bendimerad said. ``There's typically a lag of as much as a year.''

......

U.S. furniture makers fired 28,000 workers in the past year, according to the Bureau of Labor Statistics. Homebuilders have cut 24,000 jobs in the past three months alone. The U.K.'s Wolseley Plc, the world's biggest distributor of plumbing and heating equipment, has eliminated about 4,500 positions in the U.S., about the same number that Whirlpool plans to shed.

Masco, maker of Behr paint and Delta faucets, is firing 8,000 people, or about 16 percent of its U.S. workforce, after reporting its first loss in five years. Emerson Electric, based in St. Louis, cut 230 jobs at a plant that makes furnace components and Stanley Furniture in Stanleytown, Virginia, fired half the workers at one of its factories.


There is obviously a great deal of debate about housing's overall economic impact. Also -- the numbers above are projections. It's practically impossible to predict with any degree of certainly exactly what an economy as complicated as the US will do. So take them with a grain of salt.

I did a quick read of the overall employment statistics about a year ago. To me, it looked like approximately 30% of job creation was directly or indirectly related to housing. As is my usual method of econometric analysis, I simply wanted to get a feel for what might be happening. The blog Calculated Risk has been predicting a loss of 200,000 - 400,000 construction jobs as a result of the housing slump. I have guestimated an additional 200,000 of professional and financial jobs.

The point of all this is we have yet to see a really bad hit to the employment numbers from the housing market. That is likely to change fairly soon. The large drop-off in housing starts this month will hit construction jobs within the next 3-4 months. I would expect financial and professionally related losses to begin in about 6 months as the number of new houses coming on line drops.

Japan Raises Interest Rates

From the WSJ

The Bank of Japan on Wednesday decided to raise interest rates, breaking free from a policy impasse that had kept Japan's super-low borrowing costs unchanged since July, and indicating its continued effort to pursue its goal of slow but steady monetary tightening.

The central bank's nine-member policy board voted eight to one to boost the target for short-term rates by 0.25 percentage point to 0.5%. The move came after the BOJ decided against a rate increase in December and again in January amid persistent weakness in some economic indicators and calls from politicians to keep monetary policy unchanged.

The closely watched move marked the first change in Japan's monetary policy after the Bank of Japan in July ended its five-year-old policy of keeping its benchmark rate at zero.

Despite Wednesday's increase, economists expect the pace of future rate increase will remain slow, given the current sluggishness in personal consumption and slow increases in the consumer price index.


However, it's not a great booming economy yet:

Ativity in Japan's service sector fell for the second straight month in December as warm weather damped retail trade, adding to speculation that consumer spending in the world's second-largest economy has yet to fully recover.

...

Friday's data showed that the financial-services index climbed 0.8% in December from November, although wholesale and retail trade index fell 0.5%, which reflects the overall trend of consumer spending.


Japanese interest rates have been the root of much speculation among economists for some time. When will they start raising rates and how fast etc.. Well now they have made a first step. However, the recovery of the Japanese economy is still nascent, implying the interest rate policy could change.

Tuesday, February 20, 2007

The Markets That Never Corrected

Several weeks ago, there was a fair amount of ink devoted to the topic of "it's been a really long time since the markets have corrected." Well, it has been. As the charts below show, the SPYs are still in a strong uptrend, the QQQQs are consolidating in a sideways move and the IWNs consolidated sideways then started to rally again.

All markets correct; it's not a matter of if, but when.

Photobucket - Video and Image Hosting

Photobucket - Video and Image Hosting

Photobucket - Video and Image Hosting

Wal-Mart Sales Increase

From Reuters:

Wal-Mart Stores Inc. on Tuesday posted higher quarterly profit after the world's biggest retailer cut prices on hot items like toys and electronics to lure customers during the holiday shopping season.

Net income rose to $3.94 billion, or 95 cents per share, in the fourth quarter that ended on January 31, compared with $3.59 billion or 86 cents per share a year ago.

Fourth quarter earnings included a boost of $98 million, or 2 cents per share, related to a tax benefit.

Excluding the benefit, analysts on average had been expecting profit of 90 cents per share, according to Reuters Estimates.


Wal-Mart's sheer size makes them an industry benchmark. According to the Yahoo Discount Retailer industry page, Wal-Mart is 66% of the industry at $202 billion and is 4 times larger than their nearest competitor target. In other words, this is a really important company.

These numbers indicate the Christmas season wasn't bad. That's good news for the economy.

SEC Investigating Possible Inside-Information Scandal

From Forbes:

In early February, the SEC confirmed that it was investigating whether the major brokerage houses were tipping off hedge funds to the trades the brokers handle for big clients like mutual funds. If that's happening, it would be a scandal.

The SEC is also likely to scour trading records to see if the brokers are using info about clients' moves to invest their own capital. If the SEC finds evidence that they are, the scandal would be enormous - and go to the heart of Wall Street's profit machine.

A big question mark hangs over Wall Street: How is it that the top firms consistently beat the odds, earning spectacular returns on their own investments? Last year the five biggest U.S. investment banks - Morgan Stanley (Charts), Goldman Sachs (Charts), Merrill Lynch (Charts), Lehman Brothers (Charts) and Bear Stearns (Charts) - generated $61 billion from proprietary trading, about half their total revenue and a 54 percent increase over 2005.

Those returns have raised eyebrows for years. "Even the greatest investors lose money at some point, but the Wall Street firms never seem to lose," marvels Tiger Williams, chief of Williams Trading, a firm that attributes its success to keeping its hedge fund clients' trades strictly confidential.


Just what the street needs -- another scandal. It does seem that each bull market brings a fair amount of scandal with it. What makes this interesting is the increased political blow-back against the Sarbannes-Oxley legislation enacted after the Enron scandal.

The firms names are some of the largest on the street. If this scandal blows up, it could get very ugly.

Home Depot's Earnings Drop 28%

From Bloomberg:

Home Depot Inc., which ousted Chief Executive Officer Robert Nardelli last month over compensation, said profit fell 28 percent as the biggest drop in U.S. home sales in 15 years sapped demand for building supplies. Earnings missed analyst estimates.

Net income declined to $925 million, or 46 cents a share, from $1.29 billion, or 60 cents, a year earlier, Atlanta-based Home Depot said today in a statement. Sales for the three months ended Jan. 28 rose 4 percent to $20.3 billion from $19.5 billion.

Sales at Home Depot's retail unit fell 2 percent to $17.4 billion. New CEO Frank Blake plans to offer fewer discounts and more Home Depot workers on the sales floor to compete against Lowe's Cos., according to analysts who have met with him.


From CBS MarketWatch:

Home Depot Inc. delivered a lower fourth-quarter net profit Tuesday, partly as a result of a charge taken to cover executive severance costs. Financial results for the Atlanta-based company and Dow Jones Industrial Average component also reflected the slowdown in the U.S. housing market.

Quarterly sales were similarly sluggish for Home Depot, rising 4% to reach nearly $20.27 billion. Sales at stores open longer than a year, the industry's growth benchmark known as comparable-store sales, fell 6.6%, however.


Home Depot has experienced a large amount of corporate drama over the last few months, largely related to the compensation package of a recently fired CEO.

It's also important to note that overall sales increased 4% for the quarter. That means there was a large one time increase in expenses that hit these numbers as well. In short, there are some pretty big internal negatives outside of the housing slowdown hitting these numbers.

However, that doesn't change the overall picture of the industry. The impact of a slowing housing market is starting to bleed out into the economy as a whole as reflected by the 6.6% drop in same store sales.

Monday, February 19, 2007

Not Cheap, But Not Expensive

This is a table from Barron's that shows how cheap or expensive the markets are. Right now, we're somewhere in between. Here's the S&P 500. The first number is latest week, the second column is the previous week and the third column is same week for the previous year.


S&P 500 Index
P/E Ratio 17.7 18.3 18
Earnings Yield (%)5.65 5.46 5.55
Earns $ 82.23 78.57 71.5
Dividend Yield (%)1.8 1.82 1.85
Dividends ($) 26.2 26.17 23.81
Market to Book 3.21 3.17 3.1
Book Value ($) 453.06 453.06 414.75

The PE ratio decreased slightly from the previous year, although we're still in the same ballpark. Notice the big move in earnings. This is the primary reason for the lack of increase in the PE ratio. Earnings are increasing about the same rate as stock prices.

Dollar Update

Here's a daily chart of the US Dollar index from Stockcharts:

Photobucket - Video and Image Hosting

The dollar broke through support in the 84.50 area. This is where Bernanke's testimony last week hurt. The market's interpreted Bernanke's statements as meaning there would be no interest rate increases in the future. At the same time traders are expecting another rate hike from the EU area. Combined, these events are dollar bearish. Also note the dollar broke the uptrend of the recent rally.

Here's a weekly chart:

Photobucket - Video and Image Hosting

Notice that we have two downtrends, neither of which was broken over the last few months. It looks like the dollar rally is near over.

Sunday, February 18, 2007

How Long Can This Trend Last?

This is a chart of the percent change from the preceding quarter in personal consumption expenditures.

Photobucket - Video and Image Hosting

The last time this figure decreased was in 1992. That is 16 years ago. How long can this trend of positive growth continue? The US savings rate (income - expenditures) has been negative for the past 5 quarters.

Photobucket - Video and Image Hosting


Household debt has increased to over 90% of GDP and 120% of disposable income. US households greatly increased debt acquisition over this expansion, as this chart of the year-over-year percent change in household debt indicates.

Photobucket - Video and Image Hosting

Debt payments now consume the largest amount of disposable income on record.

Photobucket - Video and Image Hosting

How much more can the US consumer purchase before he pulls in his wings?

More Market Technicals

I finally broke down an purchased a few online news subscriptions -- The WSJ and Barrons. Both were reasonably priced.

Barron's has a new feature called "Technically Speaking" which deals with --- technical analysis of the markets (go figure). This week they have two really good charts.

This is a comparison of the S&P 500 and the NY New High/New Low line. Here's the chart:

Photobucket - Video and Image Hosting

The market breadth -- the number of issues making new highs versus the number making new lows -- is still very positive. The chart shows we're still in a solid uptrend, adding further fuel to the bull's fire.

Let's add one more chart for the NYSE from Stockcharts. This is a chart of the cumulative advancing versus declining issues.

Photobucket - Video and Image Hosting

As with the new high/new low figure, this chart is still firmly in an uptrend, bolstering the bulls argument.

Let's move over to the NASDAQ. Here's a chart of the market combined with on balance volume.

Photobucket - Video and Image Hosting

This chart is more bearish, as the OBV is declining. However, the OBV is in a slight decline as opposed to a free-falling drop.

To round it out, here's another chart from Stockcharts showing the NASDAQ's advancing versus declining issues.

Photobucket - Video and Image Hosting

While this chart shows some recent gains for this breadth indicator, the give and take of this chart for the last few months signals the index is not as strong as the NYSE. Traders are obviously concerned about the market to some degree. While we aren't in bear market territory, we are in yellow alert territory (for all you Star Trek fans out there). This indicator bears watching over the next few weeks.