Saturday, September 5, 2020
Weekly Indicators for August 31 - September 4 at Seeking Alpha
- by New Deal democrat
My Weekly Indicators post is up at Seeking Alpha.
Another long leading indicator, corporate profits, are expected to improve substantially in Q3, meaning that yet another forecasting element for the economy one year from now has stopped being a negative.
Lots of conditions are in place for growth - but only when the coronavirus is brought under control.
As usual, clicking over and reading should bring you fully up to date, and it also rewards me with a penny or two for putting in the effort each week.
Friday, September 4, 2020
August jobs report: continued slow incremental progress
- by New Deal democrat
HEADLINES:
- 1,371,000 million jobs gained. The gains since May total about 48% of the 22.1 million job losses in March and April. The alternate, and more volatile measure in the household report was 3,756,000 jobs gained, which factors into the unemployment and underemployment rates below.
- U3 unemployment rate fell -1.8% from 10.2% to 8.4%, compared with the January low of 3.5%.
- U6 underemployment rate fell -2.3% from 16.5% to 14.2%, compared with the January low of 6.9%.
- Those on temporary layoff decreased 3.1 million to 6.2 million.
- Permanent job losers increased by 534,000 to 3.1 million.
- June was revised downward by -10,000. July was also revised downward by -29,000 respectively, for a net loss of -39,000 jobs compared with previous reports.
Leading employment indicators of a slowdown or recession
I am still highlighting these because of their leading nature for the economy overall. These were positive:
- the average manufacturing workweek rose 0.2hours from 40.7 hours to 40.9 hours. This is one of the 10 components of the LEI and will be a positive.
- Manufacturing jobs rose by 29,000. Manufacturing has still lost-720,000 jobs in the past 6 months, or -5.6% of the total. 53% of the total loss of 10.6% has been regained.
- Construction jobs rose by 16,000. Even so, in the past 6 months -225,000 construction jobs have been lost, -5.6% of the total. Almost 2/3’s of the worst loss of 15.2% loss has been regained.
- Residential construction jobs, which are even more leading, rose by 3,200. Even so, in the past 6 months there have still been -21,200 lost jobs, or about 2.5% of the total.
- temporary jobs rose by 106,700. Since February, there have still been -471,900 jobs lost, or 16% of all temporary help jobs.
- the number of people unemployed for 5 weeks or less fell by -921,000 to 2.281 million, compared with April’s total of 14.283 million.
- Professional and business employment rose by 197,000, which is still -1.475 million, or about 7%. below its February peak.
Wages of non-managerial workers
- Average Hourly Earnings for Production and Nonsupervisory Personnel: rose $0.18 from $24.63 to $24.81, which is a gain of 3.5% in the 6 months since the pandemic began. Gains had previously reflected that job losses were primarily among lower wage earners, who have been disproportionately recalled to work. That we have increased employment and increased wages as well is a very positive development.
Aggregate hours and wages:
- the index of aggregate hours worked for non-managerial workers rose by 1.0%. In the past 6 months combined this has nevertheless fallen by about -8.5%.
- the index of aggregate payrolls for non-managerial workers rose by 1.7%. In the past 6 months combined this has nevertheless fallen by about -6.4%.
Other significant data:
- Full time jobs were responsible for 2.837,000 of the gain in the household report.
- Part time jobs were responsible for 991,000 of the gain in the household report.
- The number of job holders who were part time for economic reasons fell by -871,000 to 7.572 million. This is still an increase since February of 3.254 million.
A special note: Included in the total were 238,000 census hires. Without these, the net gain in jobs was 1,133,000.
SUMMARY
This was another positive report, but with some shades of difference. The establishment survey was the smallest gain in the past 4 months, even before census hires are taken in to account. By contrast, the household report, which determines the unemployment rate, was much stronger.
All of the leading indicators in the report were positive. Further, that average hourly wages for nonsupervisory jobs rose along with the number of recalls was very good news on the wage front.
The one significant concern is that the number of permanent job losses increased to a level on par with April and June, the worst months since the pandemic hit. This is a sign that areas of unemployment are becoming permanent and will not automatically rebound with the control of the coronavirus.
All in all, the message is that of continued substantial, but incremental, gains since the April bottom in jobs. At the rate of gains in the past two months, it would take another 8 months to regain all the jobs lost in the first two months of the pandemic.
Politically, this is *relatively* helpful to the Trump campaign, but it is by no means good enough to overcome the huge losses overall this year. There will only be one more jobs report before the election, and unless there is a miracle in the next month - which is needless to say very unlikely - Trump is going to face Election Day with a poor jobs record.
Thursday, September 3, 2020
Initial and continuing claims: very slow “less worse” progress continues
- by New Deal democrat
The continued good news in this morning’s jobless claims report is that the trend of “less worse” news is intact. But the improvement has slowed dramatically, and is still at a level of about 150,000 higher than the worst weekly levels of the Great Recession.
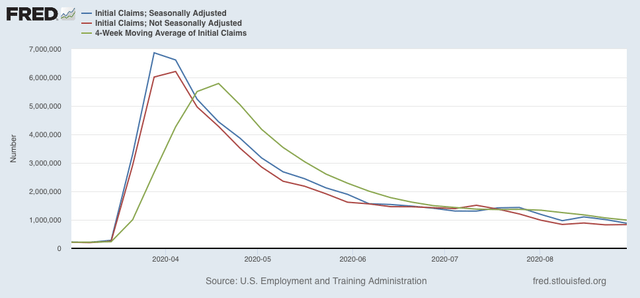
On a non-seasonally adjusted basis, new jobless claims rose (slightly) by 7,591 from their pandemic low last week to 833,352. After seasonal adjustment (which is far less important than usual at this time), claims declined by 130,000 to 881,000, their “best” reading since the pandemic began. The 4 week moving average also declined to a new pandemic low of 991,750, its first reading under 1 million:
Continuing claims, on both an un-adjusted and seasonally adjusted basis also continued to decline to new pandemic lows, by 765,644 to 13,104,366, and by 1,238,000 to 13,254,000 respectively:
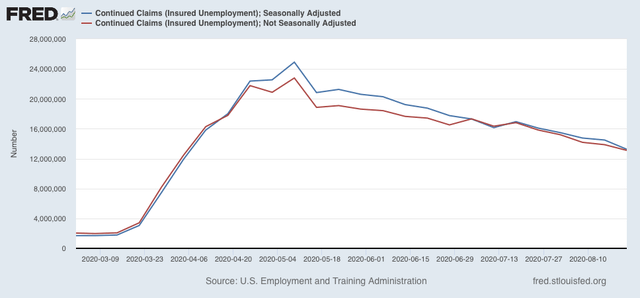
Continuing claims have fallen by almost half from their peaks in early May.
So, “good” (or “continuing less worse”) news on the unemployment claims front, but still progressing at such a slow pace that, if the trend were to continue, it would take another 6 months or more to get back to a “normal” pace. And I doubt very much that the trend is going to continue at the rate it has in the past 4 months.
Tomorrow is the jobs report for August. Whether there has been any meaningful improvement in the unemployment rate, and whether the pace of rebounding job gains has slowed further - or worse, reversed - are going to be the big issues.
Wednesday, September 2, 2020
Coronavirus dashboard for September 2: Trumpism still kills
- by New Deal democrat
Total US cases: 6,073,840
Cases, 7 day average: 42,304
Total US deaths: 184,604
Deaths, 7 day average: 888
Source: COVID Tracking Project
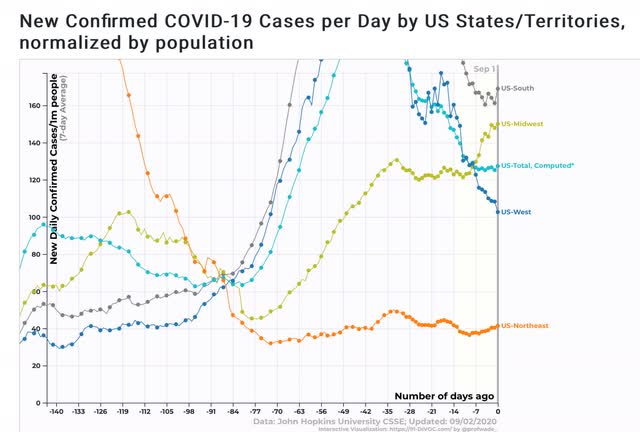
US cases by region:
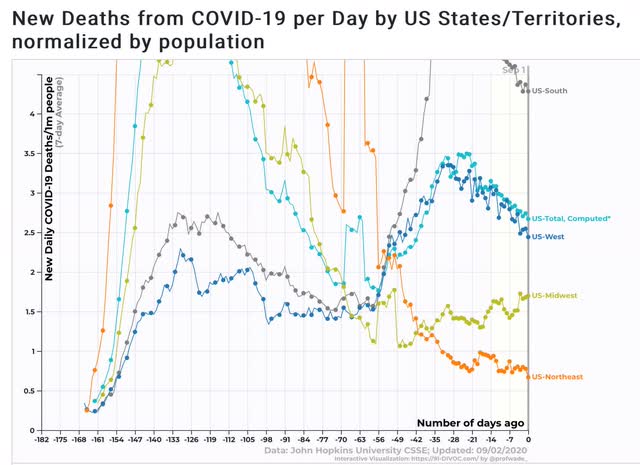
US deaths by region:
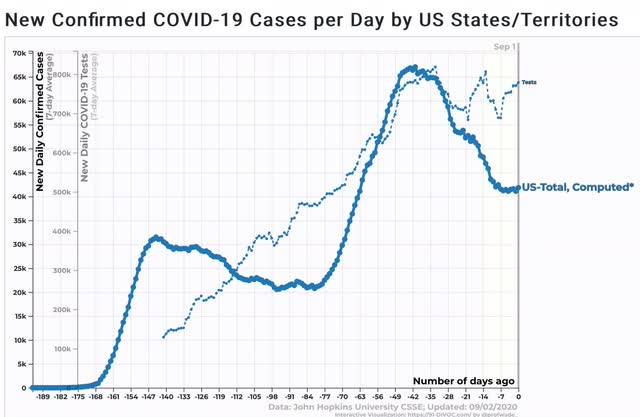
Superficially, this looks somewhat promising, as both cases and deaths have declined. But note that cases have flattened in the past week or so without further declines. This is particularly of concern, because the number of *tests* administered *has* declined somewhat over the past few weeks, as shown in the graph below of tests vs. cases, for the total US
In the Northeast, testing has actually *increased,* without finding any more new cases (not shown). That’s good! But here are the other three regions:
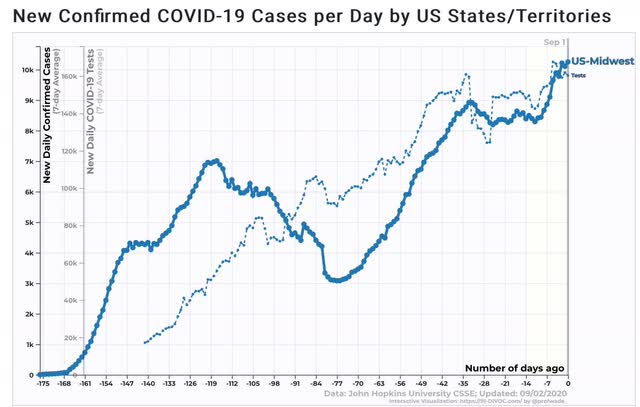
Tests vs. cases, Midwest:
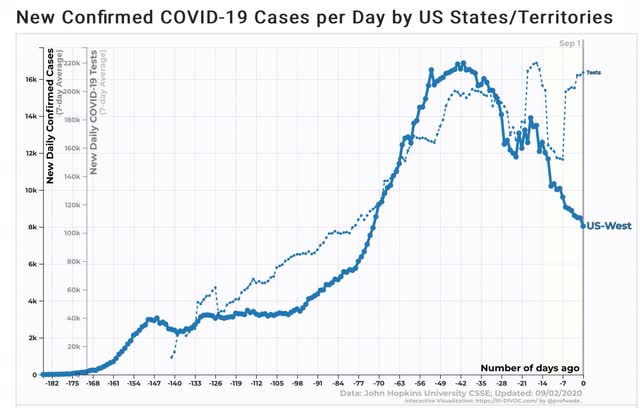
Tests vs. cases, West:
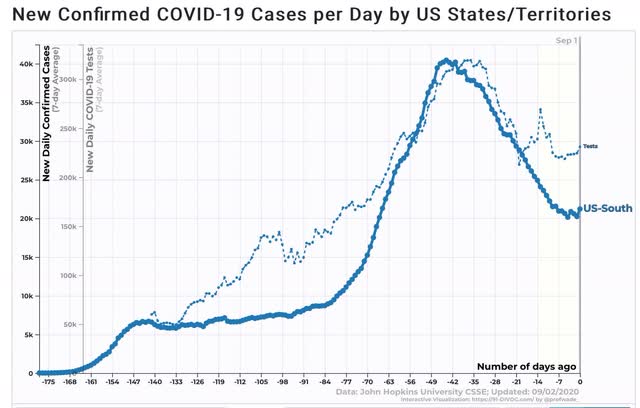
Tests vs. cases, South
In the Midwest, testing and cases have increased essentially in tandem. In the West, testing has plateaued, while new cases have declined, so the decline is probably real.
But in the South, the decline in new cases up until several weeks ago was matched by a similar decline in tests. In other words, had testing not declined, new cases probably would not have declined either. And in the South, the “true” number of cases compared with other regions is probably still substantially higher than shown.
Short version: Trumpism still kills.
Tuesday, September 1, 2020
A good start to the month: August ISM manufacturing and July residential construction
- by New Deal democrat
Another month of data started out this morning with the first report for August, ISM manufacturing. It showed positive acceleration from July.
The overall index came in at 56.0, up 1.8 from July. The more leading new orders subindex improved by 6.1 to 67.6, a very positive result (and reading over 50 indicates growth):
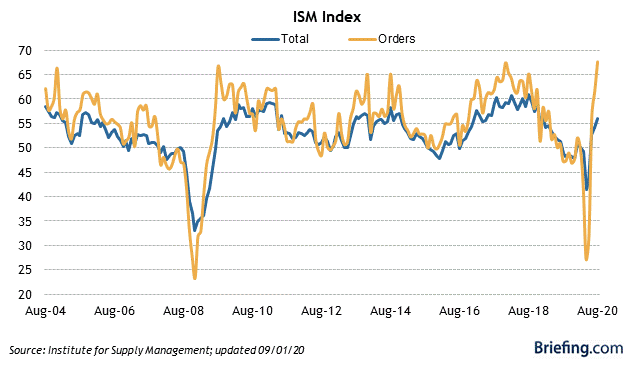
These are both the best readings in two full years.
Meanwhile July residential construction spending also increased a slight +0.1% from June (blue, compared with single family permits, red, right scale):
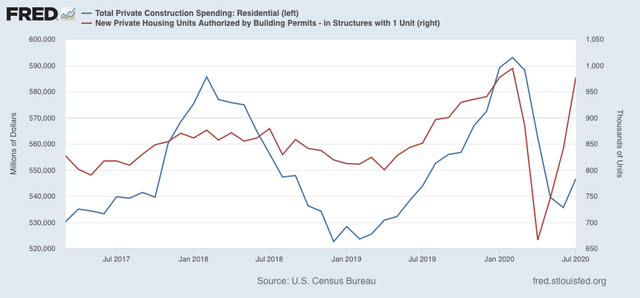
Since residential contruction follows housing permits and starts with a short lag, it is not surprising that it has not improved more yet. But it is the least volatile of all of the leading indicators in housing, so is valuable for confirmation of the trend: in this case, that housing bottomed early in the summer and has improved since.
So, good news to start the month.
Monday, August 31, 2020
The long leading forecast for H1 2021 at Seeking Alpha
- by New Deal democrat
It’s been a long time since I “officially” updated my primary set of long leading indicators, mainly because the until it is brought under control the coronavirus pandemic renders other indicators moot.
But that is likely to change by sometime in spring next year, so it makes sense to see what the economy might look like right after that.
This post was posted at Seeking Alpha.
The outcome of the election, and the likely time by which a decent vaccine might become available factor importantly into this outlook.
As I commented in response to some pushback there, my thought process was generally as follows:
Sunday, August 30, 2020
The 2020 Presidential and Senate polling nowcast: Biden’s popular majority is congealing
- by New Deal democrat
Here is my weekly update on the 2020 elections, based on State rather than national polling in the past 30 days, since that directly reflects what is likely to happen in the Electoral College. Remember that polls are really only nowcasts, not forecasts. They are snapshots of the present; there is no guarantee they will be identical or nearly identical in early November.
As I have frequently noted, Trump’s approval has always reverted to the mean, absent a new outrage that is both unusually cruel and simultaneously unusually inept. Since there has been none in the past few weeks, Trump’s margin reverted by 2% for both approval and disapproval. Perhaps more importantly, there has been virtually no movement in the past week, despite the RNC convention:

Here is the updated map through August 22. To refresh, here is how it works:
- States where the race is closer than 3% are shown as toss-ups.
- States where the range is between 3% to 5% are light colors.
- States where the range is between 5% and 10% are medium colors.
- States where the candidate is leading by 10% plus are dark colors.
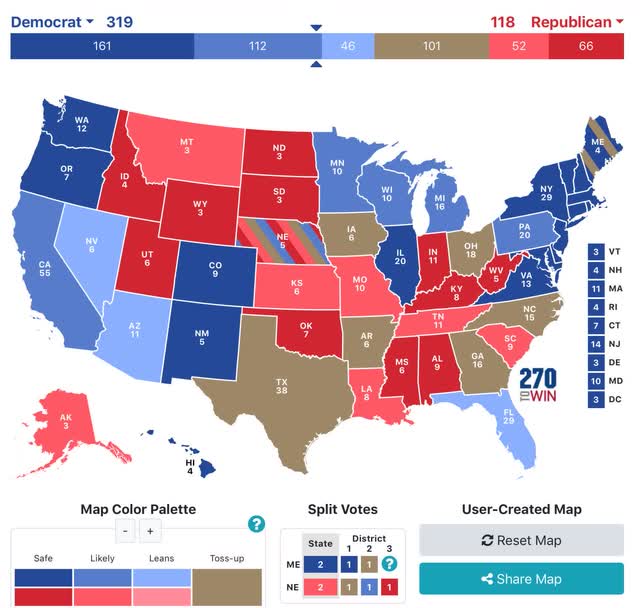
There were a bunch of polls out during the week from pollsters rated “C-“ by Nate Silver. Despite that, only Florida changed, downgraded from “likely” to “lean” Biden.
There has been erosion over the past 4 weeks, as demonstrated by the map from the beginning of August:
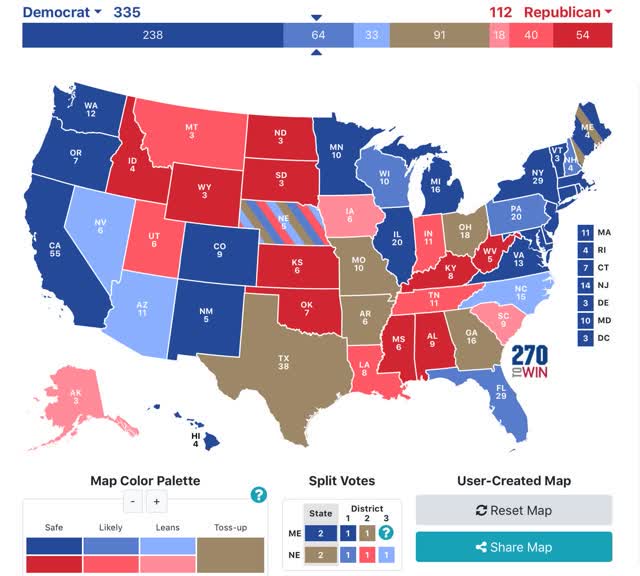
Note the weakening in Minnesota, Michigan, and North Carolina in particular, and the deeper red of Montana and South Carolina.
Even so, despite heavy polling, Georgia, North Carolina, Ohio, and even Texas remain in the toss-up category.
And I am still surprised that there have been no new polls in months in Nevada in particular.
Nevertheless, based on the current map Biden still just has to win the “solid” and “likely” States, and need not win any of the “lean Biden” States, in order to win the election.
After the August jobs report this Friday, I believe the public’s perception of the economy is going to be congealed; and after Labor Day equally so as to the coronavirus pandemic. After that point, only wild cards such as a dramatic further explosion of social unrest might sway the dynamic. I expect some tightening in the polls based on an improved economy, and based on GOP voters “coming home.”
The Senate map has not changed at all during the past week, despite the spate of “C-“ polls of those races:
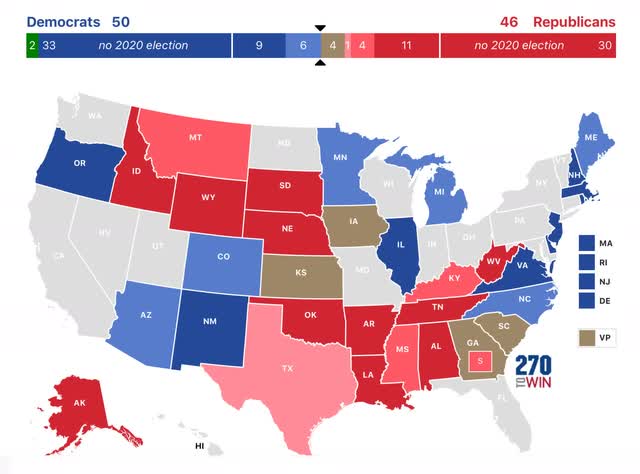
Based on this map, if Democrats simply win all those seats rated “solid” and “likely,” they will have the 50 Senate seats necessary for a technical majority. If they were to win the “toss-ups” and “lean GOP” races as well, they could end up with as many as 55 Senate seats.
Finally, a couple of noteworthy nuggets.
Below are the nightly ratings for both the Democratic and GOP conventions:
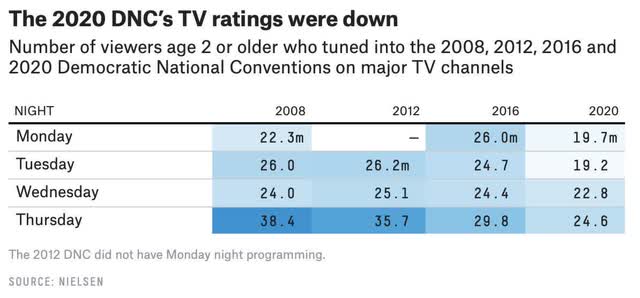
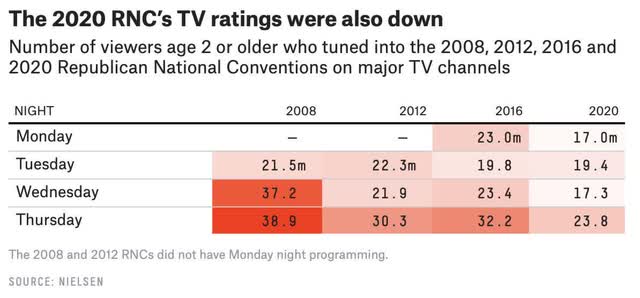
Note that while both viewerships were down, the Democratic convention viewership was only down -17.5% from 2016, while the GOP viewership was down -26.1%. Trump is such a known commodity that I doubt anyone other than diehard believers turned in. The differential favors Biden.
Second, here are the Morning Consult polls pre- and post-conventions for 2016 and 2020:
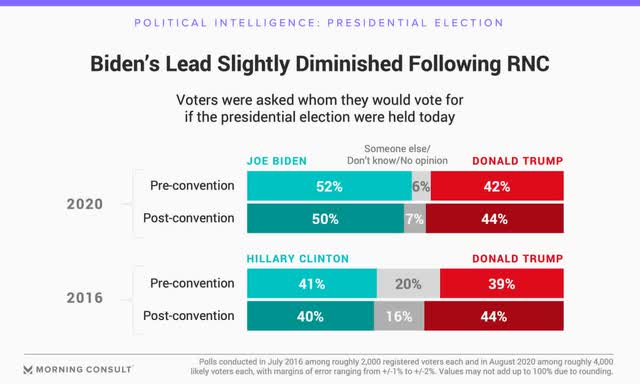
Note that Hillary Clinton, while leading, never crossed 50%. By contrast, Biden has not been *under* 50%. And there are less than half the percentage of undecided voters this year vs. 2016. It is simply going to be a nearly impossible task for Trump to actually win the popular vote. All of his hopes must be on the Electoral College and in voter and vote-counting suppression.
Subscribe to:
Posts (Atom)