Saturday, August 8, 2020
Weekly Indicators for August 3 - 7 at Seeking Alpha
- by New Deal democrat
My Weekly Indicators post is up at Seeking Alpha.
The indicators in the short leading and coincident timeframes have improved. In other words, if it were left to its own devices, the economy “wants” to get better.
But we are still at the mercy of the pandemic, and the federal and State responses to it. And on that score, I don’t see any meaningful progress that is going to be made in the next 5 months.
Friday, August 7, 2020
July jobs report: a very good *relative* gain - perhaps the last
- by New Deal democrat
HEADLINES:
- 1,763,000 million jobs gained. Together with the gains of May and June, this makes up about 42% of the 22.1 million job losses in March and April.
- U3 unemployment rate declined -0.9% from 11.1% to 10.2%, compared with the January low of 3.5%.
- U6 underemployment rate declined -1.5% from 18.0% to 16.5%, compared with the January low of 6.9%.
- Those on temporary layoff decreased -1,300,000 to 9.225 million.
- Permanent job losers decreased by -6,000 to 2.877 million.
- May was revised upward by 26,000. June was revised downward by -9,000 respectively, for a net of 17,000 more jobs gained compared with previous reports.
Leading employment indicators of a slowdown or recession
I am still highlighting these because of their leading nature for the economy overall. These were very positive:
- the average manufacturing workweek rose 0.7 hours from 39.0 hours to 39.7 hours. This is one of the 10 components of the LEI and will be a strong positive.
- Manufacturing jobs rose by 26,000. Manufacturing has still lost 740,000 jobs in the past 5 months, or 5.8% of the total. Since the worst loss was 10.6% of the total, 45% of that loss has been regained.
- Construction jobs rose by 20,000. Even so, in the past 5 months 444,000 construction jobs have been lost, or 5.8% of the total. Since the worst loss was 15.2% of the total, 59% of that loss has been regained.
- Residential construction jobs, which are even more leading, rose by 16,300. Even so, in the past 5 months there have still been 26,700 lost jobs, or about 21% of the total.
- temporary jobs rose by 144,000. Since February, there have still been -557,500 jobs lost, or 21% of all temporary help jobs.
- the number of people unemployed for 5 weeks or less rose by 344,000 to 3.2 million, compared with April’s total of 14.283 million.
- Professional and business employment rose by 170,000, which is still 1.648 million, or about 8% below its February peak.
Wages of non-managerial workers
- Average Hourly Earnings for Production and Nonsupervisory Personnel: fell -$0.11 from $24.74 to $24.63, which is still a gain of over 2.8% in 5 months. This reflects that job losses were primarily among lower wage earners, who have been disproportionately recalled to work.
Aggregate hours and wages:
- the index of aggregate hours worked for non-managerial workers rose by 1.5%. In the past 5 months combined this has nevertheless fallen by about -9.4%.
- the index of aggregate payrolls for non-managerial workers rose by 1.0%. In the past 5 months combined this has nevertheless fallen by about -6.9%.
Other significant data:
- Full time jobs were responsible for 591,000 of the gain.
- Part time jobs were responsible for 803,000 of the gain.
- The number of job holders who were part time for economic reasons declined by 619,000 to 8.443 million. This is still an increase since February of 4.125 million.
A special note: as expected, there were outsized seasonally adjusted gains in education of 245,000, as layoffs that normally happened in July didn’t, because they happened in earlier months. There were also 27,000 census hires.
SUMMARY
Based on some weekly data, it had been feared that there might be a significant decline in jobs this month. Instead, there was another - if smaller - rebound. Even excluding the 301,000 gain in all government jobs, the gain was 1.462 million jobs. Needless to say, this was very positive.
Gains in construction and manufacturing hours were particularly impressive, as were professional and business services. Even with those gains, however, aggregate hours and payrolls are now down from peak about what they were, percentage-wise, at the worst of the Great Recession.
The distortion in average hourly earnings continues to show that the lower class of workers is still suffering the brunt of the economic consequences of the pandemic, and desperately need continued aid.
While this report was certainly very good in *relative* terms, in absolute terms the economic devastation has continued. The increase this month was only 10% of the total percentage loss from peak of total employment. In other words, the “V” shaped jobs recovery some were hoping for has stopped materializing. Because initial jobless claims stalled out in 4 of the past 5 weeks, and nonfarm employment tends to lag this trend by a month or two, the outlook for continued job gains next month is very problematic.
Thursday, August 6, 2020
Initial and continuing jobless claims: back to being “less awful”
- by New Deal democrat
This morning’s initial and continued jobless claims resume the trend of “less awful” numbers.
New jobless claims fell to under 1,000,000 for the first time on an un-adjusted basis - 984,192, to be specific (gold in the graph below). After seasonal adjustment, they declined 249,000 to a new pandemic low of 1,186,000 (blue), also a new pandemic low:
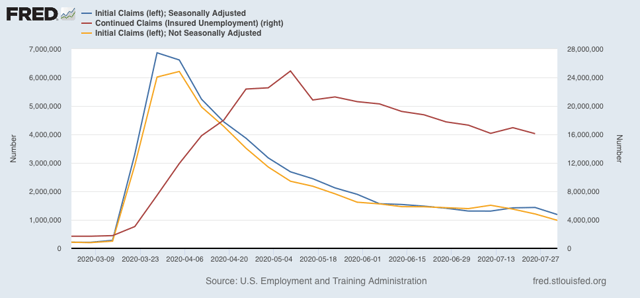
Continuing claims (red, right scale), reported for the prior week, also made a new pandemic low of 16,107,000.
All of these remain at far worse levels than even at their worst during the Great Recession. Further, that there are still 1 million *new* layoffs a week almost 5 months into the pandemic indicates that longer term damage is being done to the economy, I.e., if there were a vaccine tomorrow, there would be no “V-shaped” immediate recovery back to pre-pandemic levels. Almost all of which has been totally unnecessary, and has been caused by incompetent leadership at the very top.
But after about a month of stalling, on a very very very relative basis, I will take this “good” news.
Wednesday, August 5, 2020
Coronavirus dashboard for August 4: US regional breakdown
- by New Deal democrat
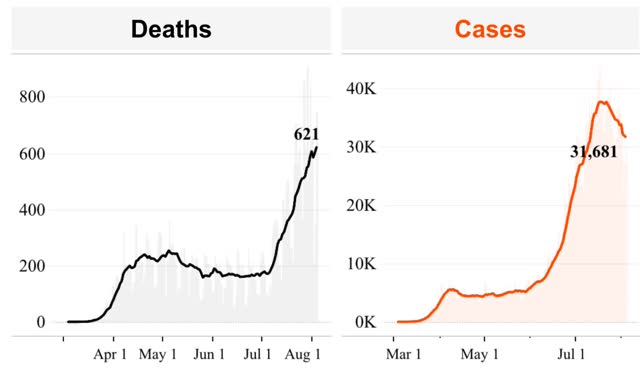
US cases August 4: 51,568
Average last 7 days: 59,182
US deaths August 4: 1,176
Average last 7 days: 1,057
(Source: COVID Tracking Project)
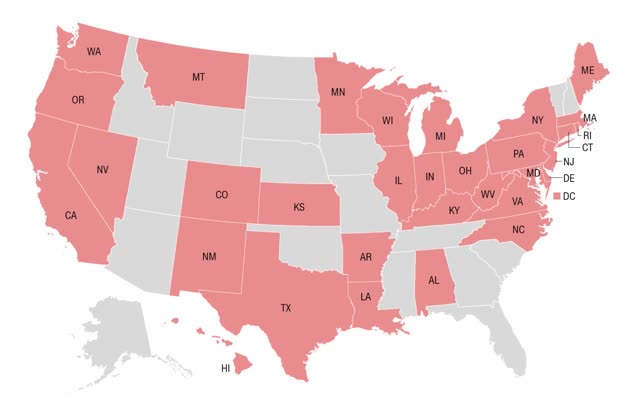
This is CNN’s latest map of States that require the wearing of masks (red):
And here is the NYT’s latest map of counties based on the growth in new cases of COVID-19:
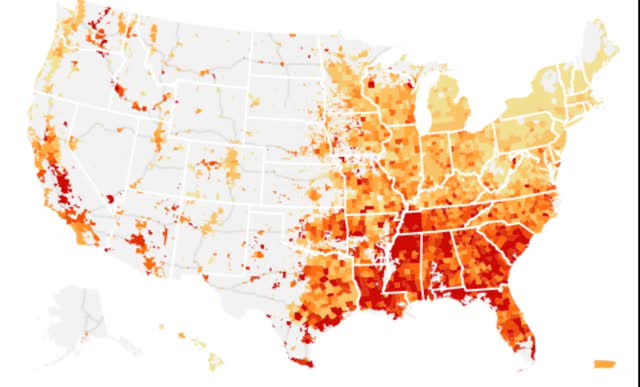
The two maps are very similar, with the notable exception of parts of Texas, which has had a mask-wearing requirement for the past month in most urban counties.
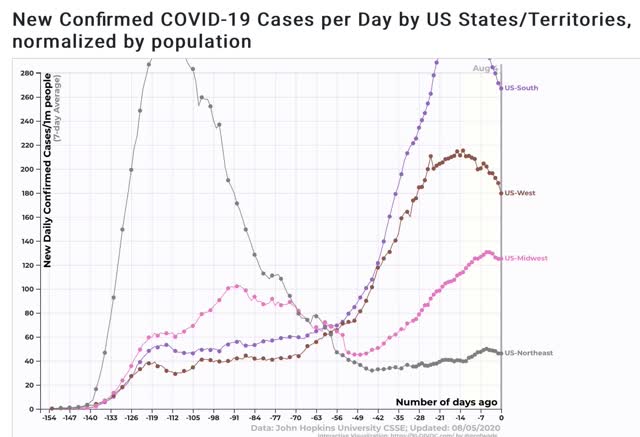
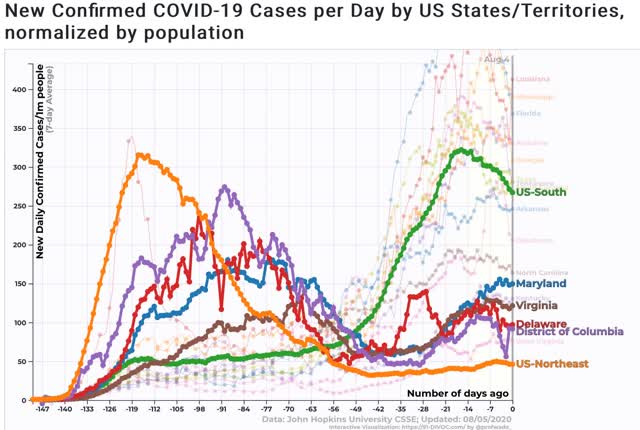
From 91-divoc.com, here is the breakdown in cases by region:
And here is the breakdown in deaths:
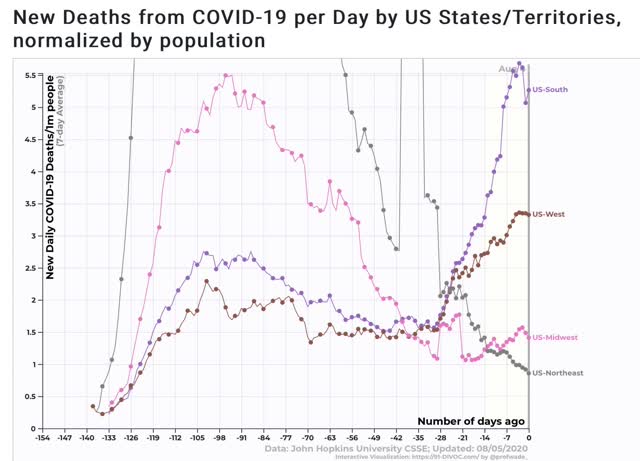
Because the above graphs place the Baltimore and DC metro areas in the South vs. the Northeastern megalopolis, below I have separately broken out DE, MD, DC, and VA and compared them with the two regions, first by cases per million:
And by deaths per million:
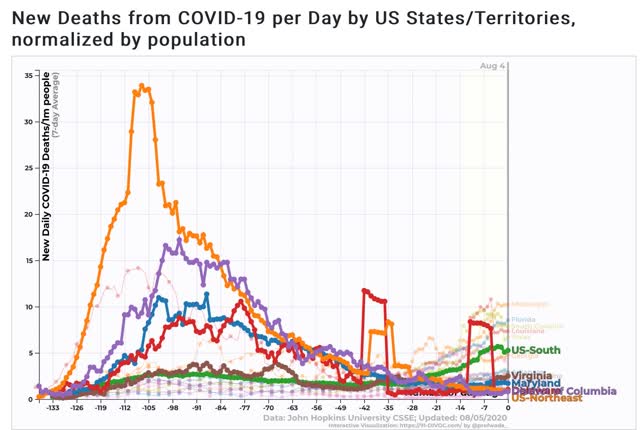
The four jurisdictions are among the lowest in the South (only rural West Virginia does better), but DE and DC are also better than the midwestern region for cases and deaths, and only MD is worse than the Midwest in deaths (not shown).
Here is what the South ex-DE, DC, MD, and VA looks like for cases and deaths, from Conor Kelly’s tableau page:
Because the Federal government cannot force the Trumpist governors in the Deep South and Arizona to take adequate precautionary measures, any Biden Administration is going to have to confront the problem of making sure those States do not continue to seed outbreaks, via returning vacationers, in the States that are willing to act responsibly. That may mean quarantining as NYS is doing; it may mean going further to establish a cordon sanitaire.
Finally, before anyone gets too excited about how well the Northeast is doing, here is the same graph of cases and deaths per million in immediately adjacent Canada:
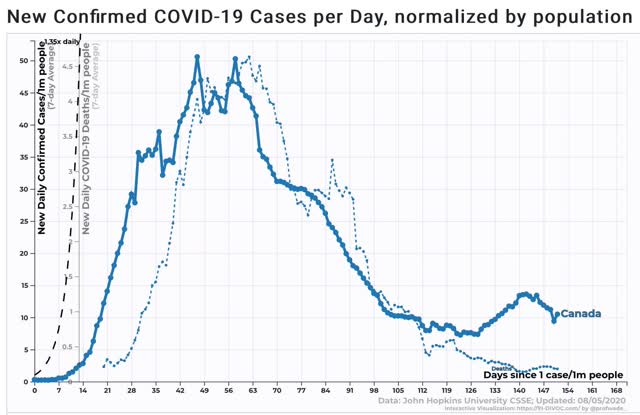
The US Northeast is currently running about 4x as many cases and deaths per million than Canada.
Tuesday, August 4, 2020
Manufacturing, housing, vehicles: the economy “wants to” recover
- by New Deal democrat
Yesterday we got two of the three typical leading data metrics that start the month: the ISM manufacturing index and construction spending. The third, vehicle sales, will be reported later today but is much less important than it used to be because US manufacturers only report actual numbers at the end of the quarter.
The ISM manufacturing new orders index is a good short leading indicator for the producer side of the economy. And it roared back to very positive in July:
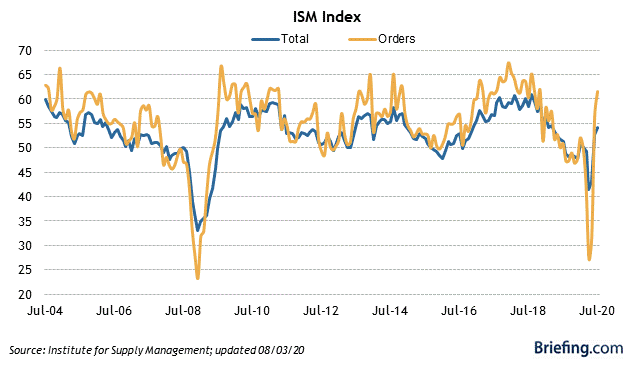
The overall ISM index came in at a solid 54.2 (any number above 50 shows expansion), and the new orders sub-index rose from June’s 56.4 to 61.5, which isn’t just positive, but can be considered a “booming” number.
Meanwhile, residential construction spending (blue in the graph below), which is the least volatile of all the housing metrics, continued to show a decline in June, with construction now off -9.9% from its February peak:
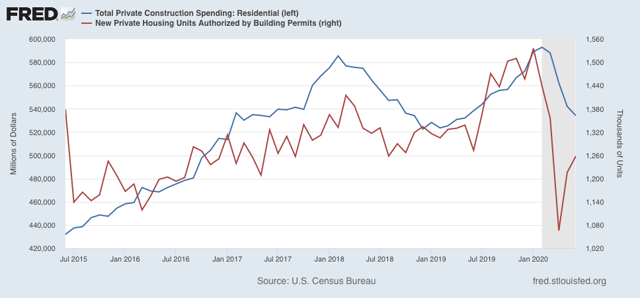
Housing permits (red) lead residential construction spending generally by several months (because the expenses in actually building a house come after the permit is granted), and these have decisively rebounded in the past two months. So I expect construction spending similarly to rebound in a month or two.
Finally, although vehicle sales reported by the manufacturers is much less valuable now, the BEA did report June’s sales several days ago. These also showed a rebound, rather large for passenger cars and light trucks, and a small one for the usually more leading heavy weight truck sales:
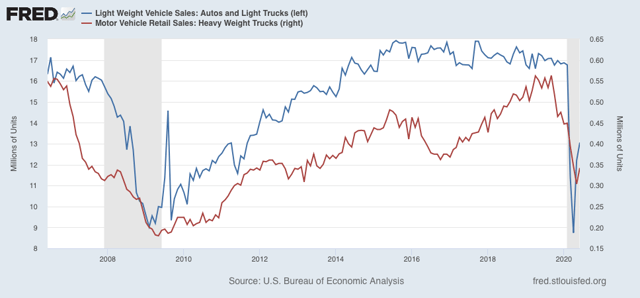
The picture sketched by these three metrics of leading sectors of the economy is a strong rebound in manufacturing, a decent rebound taking shape in housing and cars, and a more slight rebound in trucks. Left to its own devices - I.e., if there were competent leadership executing policy containing the coronavirus - the economy wants to recover.
Sunday, August 2, 2020
The 2020 Presidential and Senate elections nowcast: reverting towards the mean
- by New Deal democrat
Here is my weekly update on the 2020 elections, based on State rather than national polling in the past 30 days, since that directly reflects what is likely to happen in the Electoral College.
The theme this week is that Trump’s approval is reverting to the mean, and so are the Presidential polls.
Here is Nate Silver’s Trump approval vs. disapproval graph:
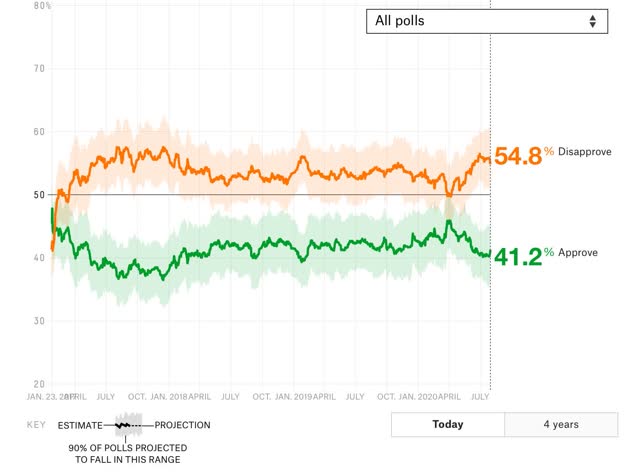
For most of the past month, Trump approval has been languishing at 40%, equivalent to the worst levels of his Presidency. But as always been the case before, his partisans come back to approving him after the immediate moment has passed.
This is reflected in the Presidential polling. To refresh, here is how the below map works:
- States where the race is closer than 3% are shown as toss-ups.
- States where the range is between 3% to 5% are light colors.
- States where the range is between 5% and 10% are medium colors.
- States where the candidate is leading by 10% plus are dark colors.
Here is the updated map through August 1:
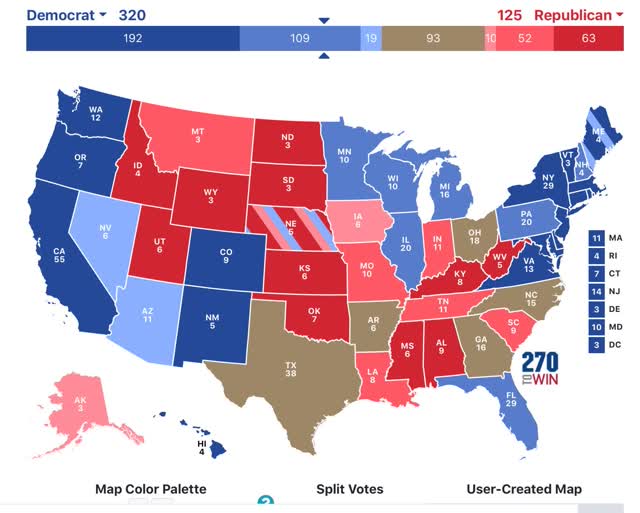
While there have been no outright flips, note that North Carolina has gone back to being a toss-up. Nevada plus several States in the midwest are less strongly pro-Biden. Meanwhile South Carolina and several other States in the Deep South have turned more pro-Trump.
- States where the range is between 3% to 5% are light colors.
- States where the range is between 5% and 10% are medium colors.
- States where the candidate is leading by 10% plus are dark colors.
Here is the updated map through August 1:
While there have been no outright flips, note that North Carolina has gone back to being a toss-up. Nevada plus several States in the midwest are less strongly pro-Biden. Meanwhile South Carolina and several other States in the Deep South have turned more pro-Trump.
Even so, as has been the case for nearly a month, if Biden simply wins the States in which he leads by 5% or more in the polling, he would win the Electoral College, without even winning a single “toss-up” or “lean Biden” State as shown on the map.
Here is what the 2020 Senate map looks like based on the same metrics, with the following changes:
Here is what the 2020 Senate map looks like based on the same metrics, with the following changes:
- where there is no polling in the past month, I have used the most recent poll
- where there has been no polling at all this year, I am using the Presidential polling as the best guess.
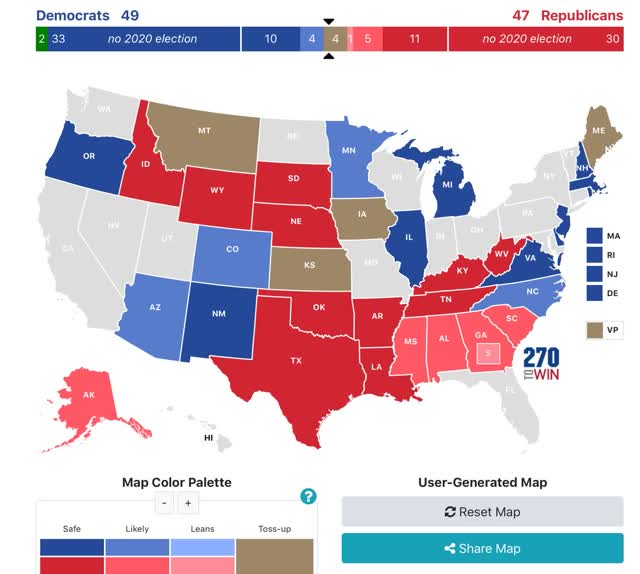
Note that there has been no polling at all this year in the following States: Oregon, Idaho, Wyoming, South Dakota, Nebraska, Louisiana, Arkansas, Rhode Island, and West Virginia.
Most importantly, note that Maine has tightened back to a toss-up. This is likely to be the race that determines whether or not the Democrats achieve a majority in the Senate.
I am quite concerned about what reversion to the mean will do in Senate races. In the Presidential race, I continue to believe that Trump has until Labor Day - about 5 weeks - to pull off a miracle as to the pandemic. More likely we will start to see outbreaks in schools among teachers and students, and then their parents, by about September 20. Hospitalizations based on those outbreaks will start to increase in early October, and deaths in late October, just in time to be the last big story before Election Day.
Subscribe to:
Posts (Atom)