The following are pages on the 1955 US economy
GDP
PCEs
Investment
Industrial Production
Interest rates and inflation
Employment
Balance of Payments
Government Finances
Saturday, May 12, 2012
1955: Government Finances

In 1955, we see the federal government running a slight deficit -- were at $4.2 billion dollars. However, federal expenditures were clearly dropping, from 74.3 billion in 1953 to $64.6 billion in 1955. This was largely due to the end of the Korean war. Also note the decrease in receipts, even though we see increased prosperity. As noted by the ERP

Interestingly enough, the Federal Reserve reported a net increase in cash receipts for the year:


Regardless of the correct figure, what is important in these numbers is the federal government seemed to have a far more responsible attitude about their fiduciary responsibilities.
Weekly Indicators: mixed but weakening signals edition
- by New Deal democrat
Monthly data reported in the last week was sparse. Consumer confidence was up, but the leading portion of the index, expectations, declined. Consumer credit surged as did the trade deficit. More troubling were producer prices which are flirting with tipping into deflation. Commodity prices are only up 0.4% YoY, and finished consumer prices while up 1.9% YoY are only up 0.4% for the last 6 months on a seasonally adjusted basis.
The high frequency weekly indicators this week show mixed but spreading signs of weakness. Ironically, the best performing sector is housing and real estate generally.
So let's start with the Housing reports :
The Mortgage Bankers' Association reported that the seasonally adjusted Purchase Index increased +3.4% from the prior week, and was down slightly, -0.4% YoY. The Refinance Index fell -1.3%.This index continues to be near the upper end of its 2 year generally flat range. The Federal Reserve Bank's weekly H8 report of real estate loans, which had been negative YoY for 4 years, turned positive onver one month ago. This week, real estate loans held at commercial banks rose +0.2% w/w, and bettered their YoY comparison at +1.0%. On a seasonally adjusted basis, these bottomed in September and are now up +1.6%.
YoY weekly median asking house prices from 54 metropolitan areas at Housing Tracker were up +3.1% from a year ago. YoY asking prices have been positive now for more than 5 months. Either this indicator will turn, or the Case-Shiller repeat sales index is likely to turn within the next several months. I do not see how the divergence between the two can continue much longer.
Employment related indicators were strongly contradictory:
The Department of Labor reported that Initial jobless claims rose 3,000 to 368,000 last week. The four week average fell 4500 to 379,000. It seems more likely that in April we saw a quirk of seasonality rather than a more ominous sign.
The American Staffing Association Index remained at 93. It is just two points below the all time records from 2006 and 2007 for this week. It is possible that it could exceed all readings but those of 2006 by June sometime.
The Daily Treasury Statement for the first 8 days of May showed $51.6 vs. $59.3 B for April 2011. For the last 20 reporting days, $128.7 B was collected vs. $132.2 B a year ago, a decrease of $3.5 B, or -2.6%. There has been a marked fall-off in treasury receipts YoY since mid-April. This is the first time in close to half a year that this comparison went negative. If this continues for another few weeks it will be ominous. For now it is a yellow flag.
Sales were also mixed:
The ICSC reported that same store sales for the week ending May 5 fell -0.3% w/w, but were up +3.3% YoY. Johnson Redbook reported a 2.6% YoY gain. Shoppertrak reported a decline of -2.7% YoY and belatedly reported a +17.7% YoY increase last week. The 14 day average of Gallup daily consumer spending turned negative for the first time since early March at $68 vs. $71 in the equivalent period last year. Gallup's result should be taken with a grain of salt because this date was at the apex of a short-lived surge of spending in early May last year.
Bond prices rose and credit spreads increased:
Weekly BAA commercial bond rates remained at 5.15%. Yields on 10 year treasury bonds fell another-.03% to 1.95%. The credit spread between the two widened to 3.20%. Falling bond yields and widening spreads, as has happened for the last month, are a sign of weakness, and over half of the improvements from the October maximum credit spread have been given back.
Rail traffic ex-coal remained slightly positive this week.
The American Association of Railroads reported a +0.2% increase in total traffic YoY, or +1200 cars. Non-intermodal traffic was down by -5,800 cars, or -2.0% YoY. Excluding coal, this traffic was up 6,200 cars. Ethanol-related grain shipments were also off. Intermodal traffic was up 6,800 carloads, or +3.0%. Railfax's graph of YoY traffic continued to show that the YoY improvement in hauling of cyclically sensitive materials remains strong.
Money supply remained generally positive:
M1 fell -0.1% last week, but rose +1.0% month over month. Its YoY level increased to +17.9%, so Real M1 is up 15.3%. YoY. M2 rose 0.6% for the week, and was up +0.2% month over month. Its YoY advance fell slightly to +9.4%, so Real M2 was up 6.8%. Real money supply indicators continue to be strong positives on a YoY basis, although they have had a far more tepid advance since September of last year.
The energy choke collar has loosened:
Gasoline prices fell for the fourth straight week, down another .04 to $3.79. Oil fell again, from $98.49 to $96.13. Oil remains at, and gasoline above, the point where they can be expected to exert a constricting influence on the economy. The 4 week average of Gasoline usage, at 8707 M gallons vs. 8826 M a year ago, was off -3.2%. For the week, 8864 M gallons were used vs. 8826 M a year ago, for a gain of +0.4%. This is the first YoY gain in nearly a year.
Turning now to high frequency indicators for the global economy:
The TED spread remained at 0.390, near the bottom of its recent 3 month range. This index remains slightly below its 2010 peak. The one month LIBOR also remained flat at 0.239. It is well below its 12 month peak set 3 months ago, remains below its 2010 peak, and has returned to its typical background reading of the last 3 years.
The Baltic Dry Index fell from 1157 to 1138. It is about 1/3 of the way back from its February 52 week low of 670 to its October 52 week high of 2173. The Harpex Shipping Index rose another 12 points from 428 to 440 in the last week, and is up 65 from its February low of 375.
Finally, the JoC ECRI industrial commodities index fell sharply from 124.99 to 122.82. This indicator appears to have more value as a measure of the global economy as a whole than the US economy.
This week's high frequency data showed spreading pockets of weakness: Withholding tax receipts, Gallup consumer spending, credit spreads, and commodity prices all were negative. Temporary employment, layoffs, sales, money supply, and real estate data were positive. With weakness came the loosening of the Oil choke collar.
Watch retail sales and industrial production in the coming week to see whether or not this weakness shows up in the important monthly coincident reports.
Friday, May 11, 2012
Weekend Weimar, Beagle and Pitbull
It's that time of the week again. NDD will post the weekly indicators on Saturday. I'll be back on Monday. Until then .....


PPI confirms: the weakness is continuing
- by New Deal democrat
A month ago, based on poor March payrolls, a significant increase in initial claims, and a bunch of other poorer-than-expected data, I wrote that The Weakness Begins.
This morning's PPI data confirms that if the pattern is similar to the past, going back nearly 100 years including the Roaring Twenties and Great Depression, the period of weakness will continue.
Let's begin by showing the YoY difference between finished producer prices (increasing by 1.9% YoY as of April), and commodity input prices (increasing by only 0.6% as of April):

Note that in the past, when, after a period of relative strength,commodity prices plunge significantly below finished producer prices (i.e., the value in the above graph is negative), it has almost always coincided with weakness. For example, even in the booming late 1990's, the one time of relative GDP weakness was during the Asian currency crisis of 1998. Beyond weakness, almost all of the recessions in the last 100 years including the last two shown above show this pattern.
So I am expecting the coincident economic data this month to be soft or possibly even negative.
While inflation data is coincident rather than leading, by examining the last few periods of weakness, we can get a very good idea how long it is likely to persist. As I pointed out last month, typicall the period of weakness bottoms almost exactly when producer and commodity prices are at their YoY weakest. That isn't as difficult to predict as it may seem. In 2011, the last strong inflationary month was April.
Unless there is a severe recession vs. a period of weakness, it is unlikely that YoY commodity prices will continue to decline after July, or September at the latest. Better real wages (note that real wages are already improving compared with producer prices - and will likely be shown to have improved - but still negative for now - compared with consumer inflation next week) and improving business profitability caused by the greater decline in commodity prices should assert themselves beginning at that time. That means this period of weakness should start to abate sometime during the summer
The NAFTA Trade Story Is Actually More Important Than China
While all of our press seems to be concerned with China, this really isn't the big trade story of the US. In reality, Canada and Mexico combined (the NAFTA countries) are out biggest trading partners. Consider these charts from the US Census:


While China is an important export destination, it only accounted for $8.8 billion in February, whereas Canada accounted for $23.5 billion -- nearly three times as much. And Mexico accounted for nearly two times the Canada trade.
China is the top country from whom we import, totaling $28.1 billion in February. However, Canada is a very close second with $26.3 billion and Mexico is also a pretty close third with $22.7 billion. Combined, the NAFTA countries account for 1.75 times the number of imports as China.
And consider these charts about the trade balance. First, let's look at Canada:


Both charts show the same data, but in different ways. The top chart shows exports (blue line) and imports (red line) to and from Canada, while the bottom chart shows the trade balance (exports - imports). The trade balance started to go strongly negative in the late 1990s and continued to deteriorate, but has been far less so as a result of the Great Recession.


The US/Mexico charts show the exact same relationship, although since the end of the recession trade with Mexico deteriorated far less and is also closer to pre-recession levels.
So -- why is no one talking about this in the same way we are with China?
Austerity is a Mental Illness
From Bloomberg:
After all, if we keep putting our hand on the stove, at some point -- according to quantum mechanical theory -- the molecules of our hand will line up in such a way that the fire will pass through, leaving us unharmed. Of course -- that will only occur after we've scorched our hand so badly it's no longer useful as an appendage .....
Britain’s recovery remains at risk as Prime Minister David Cameron pushes on with budget cuts to reduce the deficit and unemployment near a 16-year high damps consumer spending. Nationwide Building Society’s index of consumer confidence fell in April, leaving the gauge more than 30 points below its average over the last decade.That's right. Austerity policies are a prime reason why the British economy is now in a double dip recession. Let's double-down on this policy.
After all, if we keep putting our hand on the stove, at some point -- according to quantum mechanical theory -- the molecules of our hand will line up in such a way that the fire will pass through, leaving us unharmed. Of course -- that will only occur after we've scorched our hand so badly it's no longer useful as an appendage .....
Morning Market Analysis


The good news in the above charts is the SPYs and IWMs are still in a trading range -- although prices are at the low end of each respective range. In addition, both are still above their respective 200 day EMAs. However, the MACD on both charts is declining sharply. That, combined with the terrible shape of other markets around the globe does not bode well for the future. From a market psychology perspective, it's be great to see these levels stick over the weekend.

Unlike the oil market, the copper market has not seen a massive drop. Instead, prices are still trading a bit below the 200 day EMA. However -- again note the terrible MACD position.


Thursday, May 10, 2012
No -- Really -- The US Actually Exports A Lot
One of the greater canards that floats around the internet is that the US is not an exporter, or that we don't make things here, or that, in general, the US is experiencing a general manufacturing and export malaise or decline. That's not the case. First, consider this chart of total US exports:

Total US exports are actually at higher levels now than before the recession and have been in a clear uptrend (with the exception of recessions) for the last 40 years. Let's take a closer look at the data.

The chart above shows the last 5 years of data, and we see clearly that exports have overtaken previous levels and are now near all time highs.
And here are two charts which show what we export:
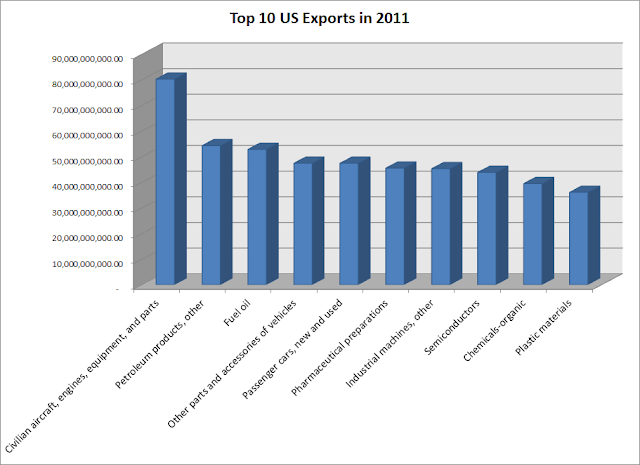

Here is a list of the information in graphic form:
And here's a graph from the Census Bureau that breaks the information down into larger categories for both imports and exports:


Total US exports are actually at higher levels now than before the recession and have been in a clear uptrend (with the exception of recessions) for the last 40 years. Let's take a closer look at the data.

The chart above shows the last 5 years of data, and we see clearly that exports have overtaken previous levels and are now near all time highs.
And here are two charts which show what we export:


Here is a list of the information in graphic form:
| Civilian aircraft, engines, equipment, and parts | 80,172,454,470.00 |
| Petroleum products, other | 54,237,010,317.00 |
| Fuel oil | 52,800,539,232.00 |
| Other parts and accessories of vehicles | 47,365,339,805.00 |
| Passenger cars, new and used | 47,354,593,365.00 |
| Pharmaceutical preparations | 45,468,815,842.00 |
| Industrial machines, other | 45,246,225,629.00 |
| Semiconductors | 43,773,152,276.00 |
| Chemicals-organic | 39,419,030,345.00 |
| Plastic materials | 36,025,994,150.00 |
| Telecommunications equipment | 35,849,294,688.00 |
| Electric apparatus | 35,118,902,366.00 |
| Nonmonetary gold | 33,228,280,326.00 |
| Medicinal equipment | 32,041,186,500.00 |
| Computer accessories | 31,567,258,172.00 |
| Minimum value shipments | 30,028,425,150.00 |
| Chemicals-other | 28,783,602,478.00 |
| Industrial engines | 28,102,493,451.00 |
| Measuring, testing, control instruments | 23,742,788,374.00 |
| Other industrial supplies |
22,985,042,545.00 |

Same Time, Next Year
Or was it same time last year?
It seems as though we're back where we were at the same time last year. While last year's slowdown was partially caused by the Japanese earthquake, we also had high gas prices to deal with. As NDD has pointed out (and I believe coined), the oil choke collar works like a charm. Here is the chart of gas prices from This Week in Petroleum:

Prices this year are higher than last year.
Over the last month (more or less) we've learned that every major EU country is getting hit by recession. Now the voters in several countries have replaced their governments, which is going to make the markets more nervous regardless of who is elected. These political events may replace the overall effect of the Japanese earthquake last year in this years market drama, effectively putting a break on any forward motion.
The market news is also negative. As I pointed out earlier today, the BRICs markets are now is bear market territory. The US markets are clearly in a correction and US bonds are again catching a safety bid. Commodities are selling off, with oil taking a huge hit.
In short, we saw this picture last year. Although the players are now different, the overall effect is probably going to be the same.
Morning Market Analysis; Risk Off

While there has been a lot of press about the dollar catching a safety bid over the last week, it's important to keep that bid in perspective. The dollar's overall average is still trading in a range, and has been for the last three months. Only if we see a break about the 22.4/22/5 area will the recent "rally" matter.

The euro, however, is a different story. It has broken through support at the 130 level and is currently at the 128/129 level. The reason for this is the recent electoral changes in the EU region; traders are concerned that Greece will eventually be forced to leave the EU area.

Yesterday, the Spanish ETF was one of the worst performers in the world, dropping a little over 4%. More importantly, prices moved through another support level, placing them at the lowest level in over 6 months. In addition, consider these charts of Italy and France:


Both are showing the same technical price action at important support levels.

Oil continues to move lower as well, with prices now below the 200 day EMA. Pay particular attention to the individual candles; the long lower shadows tell us that prices dropped farther intra-day, but traders say enough value to add to these positions. Long-term, the 96 handle is actually a pretty good price for oil for people that have a longer-term perspective.
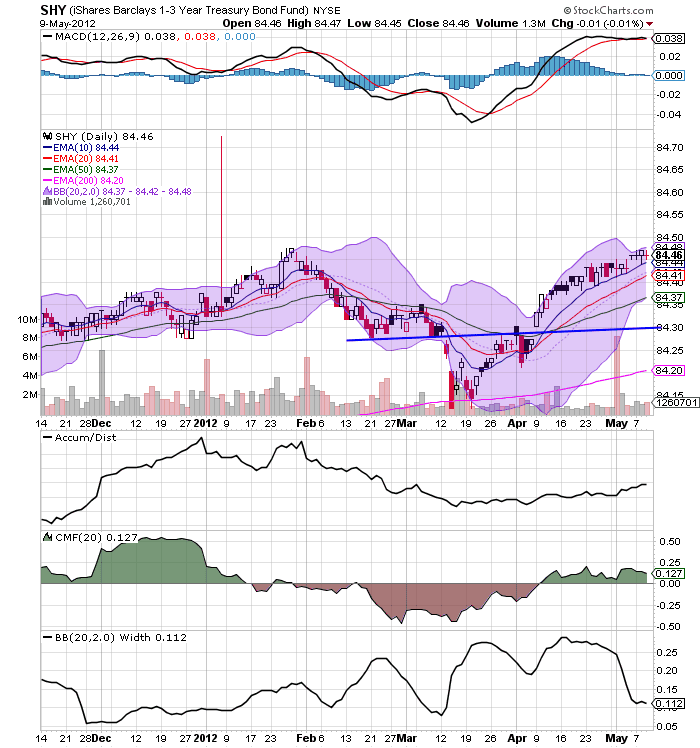


Finally, the entire US treasury curve is rallying, with some prices (IEI, IEF and TLT) moving through important resistance levels. What's important about this trade is that, with inflation running at 2.7%, most of the US yield curve is underwater, indicating that traders are now more concerned with a return of capital rather than a return on capital.
Wednesday, May 9, 2012
Bonddad Linkfest
- Australian trade balance is decreasing (ABS)
- German IP increases (FSO)
- German trade balance is positive and improves (FSO)
- UK retail sales drop (BB)
- Brazil update from Bloomberg (BB)
- Spanish yields at 6%
- India set to become second largest rice exporter, keeping rice prices low (BB)
- Market's tumble is far from over (MSN)
- Major correction unlikely (Marketwatch)
- The French labor code is .. nuts (Business Week)
The JOLTS hiring index as a leading indicator
- by New Deal democrat
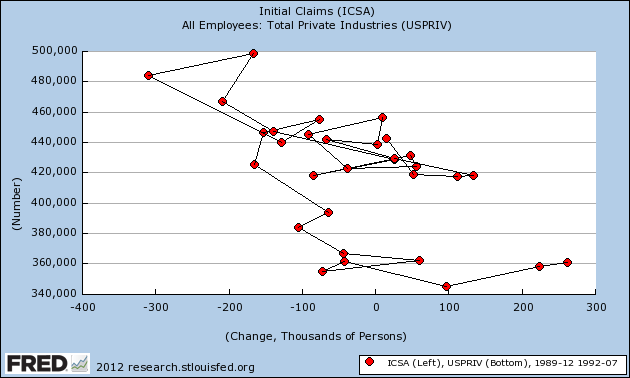
I haven't been paying too much attention to the JOLTS survey because it only dates from 2000. Beyond that, the overall JOLTS index turned up very late after both the 2000 and 2008 recessions, well after most other data series. But a post yesterday by Bill McBride, who's been covering this index for blog-ages, caused a light bulb to go on over my head. In particular, it appears that the JOLTS hiring index captures the same dynamic that is shown in scatter graphs of initial claims vs. payrolls I've been running from time to time. Indeed, I think there's a pretty good argument that the JOLTS hiring index is a leading indicator for payrolls as a whole.
Here's why. Let's start with the scatter index I've been running of the 2008-09 "great recession" and recovery since:
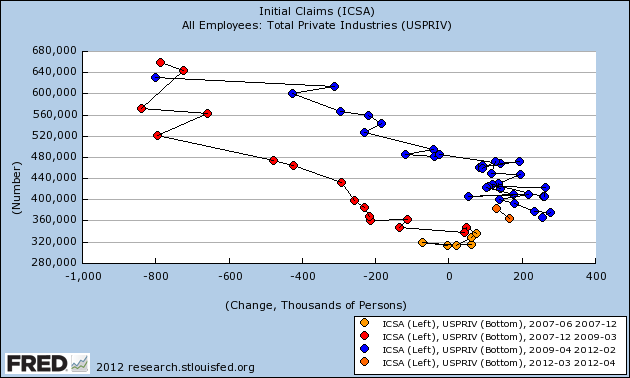
As I said on Monday, typically heading into a recession, first hiring stops (moving the scatterpoints to the left in the graph) before significant firing begins. Similarly, as a recovery starts from the depths of a recession, new hiring begins in selected fields before the overall firing slows (moving the scatterpoints to the right)
The same can be said, more or less noisily, for each recession in the last 50 years, for which we have the data. For example, here's the 1980 recession:
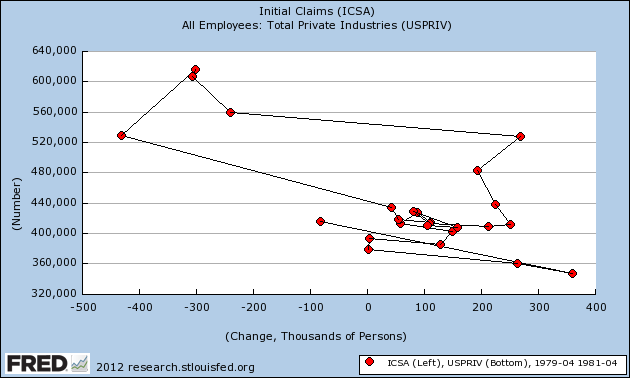
And here's the 1990 recession:
In each case, the "recovery" correlation is upwards and to the right of the "recession" readings.
If, relatively speaking, hiring leads firing at both peaks and troughs, then hiring ought to lead payrolls as a whole (which basically are hirings minus firings) as well. So here's what happens when we compare the JOLTS hiring index with payrolls:
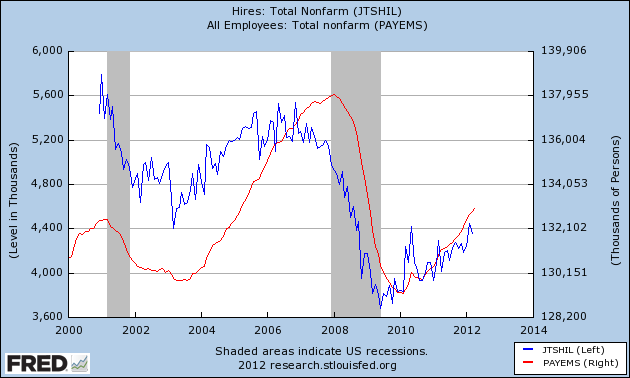
In case that isn't clear, the below graph is the same data except I've averaged JOLTS data by quarter:
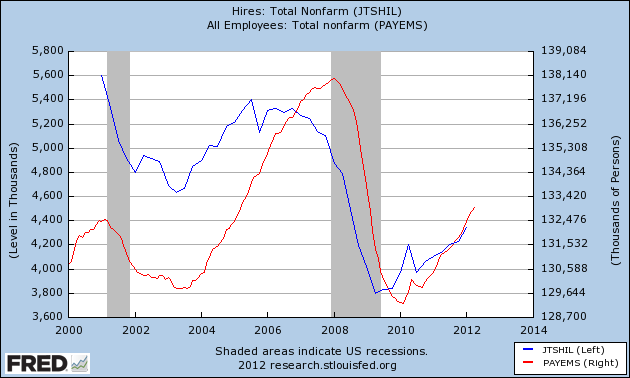
It's crystal clear that, since the index has started, the JOLTS hiring index has been a leading indicator for the direction of payrolls as a whole, and my scatter graphs strongly suggest that the relationship is durable. Needless to say, if this is correct, then the JOLTS hiring index predicts that at very least payroll growth will remain positive for the next few months.
I haven't been paying too much attention to the JOLTS survey because it only dates from 2000. Beyond that, the overall JOLTS index turned up very late after both the 2000 and 2008 recessions, well after most other data series. But a post yesterday by Bill McBride, who's been covering this index for blog-ages, caused a light bulb to go on over my head. In particular, it appears that the JOLTS hiring index captures the same dynamic that is shown in scatter graphs of initial claims vs. payrolls I've been running from time to time. Indeed, I think there's a pretty good argument that the JOLTS hiring index is a leading indicator for payrolls as a whole.
Here's why. Let's start with the scatter index I've been running of the 2008-09 "great recession" and recovery since:
As I said on Monday, typically heading into a recession, first hiring stops (moving the scatterpoints to the left in the graph) before significant firing begins. Similarly, as a recovery starts from the depths of a recession, new hiring begins in selected fields before the overall firing slows (moving the scatterpoints to the right)
The same can be said, more or less noisily, for each recession in the last 50 years, for which we have the data. For example, here's the 1980 recession:
And here's the 1990 recession:
In each case, the "recovery" correlation is upwards and to the right of the "recession" readings.
If, relatively speaking, hiring leads firing at both peaks and troughs, then hiring ought to lead payrolls as a whole (which basically are hirings minus firings) as well. So here's what happens when we compare the JOLTS hiring index with payrolls:
In case that isn't clear, the below graph is the same data except I've averaged JOLTS data by quarter:
It's crystal clear that, since the index has started, the JOLTS hiring index has been a leading indicator for the direction of payrolls as a whole, and my scatter graphs strongly suggest that the relationship is durable. Needless to say, if this is correct, then the JOLTS hiring index predicts that at very least payroll growth will remain positive for the next few months.
Would somebody PLEEEEEASE shut up Joe Kernan?!?!?
- by New Deal democrat
CNBC's Squawk Box is a total disaster, and ALL of the anchors need to go, but especially the totally-out-of-control Joe Kernan.
ECRI's Lakshman Achuthan was on this morning, defending their recession call (BTW, if a recession doesn't start in the next 7 1/2 weeks, they're wrong.)
Much as I have been critical of this recession call, Achuthan has been clear as a bell since forever about ECRI's definition of recession being the NBER's definition -- a pronounced downturn in production, sales, income, and employment, generally measured by real retail sales, industrial production, real income, and payrolls.
Not only did both Joe Kernan and Becky Quick not know what the actual definition of a recession is (they kept insisting it was two quarters of negative GDP) they both kept interrupting Achuthan who was patiently trying to educate them -- for FIVE MINUTES!
Achuthan was able to finally say that he (correctly, imo) is worried about the real hourly income being negative, and being an a very grave area of concern. I happen to think he is overlooking the effect of refinancing. He thinks it is most likely that the recession he sees will be shallow.
It would be nice if there were an intelligent morning financial program where the hosts actually were able to flesh out his thought process more than that (oh yeah, and know what a recession actually is).
Why is the US a Net Importer?
When looking at the US trade situation, there is often a great deal of consternation about the US being a net importer. However, this is really a function of math. Let's start with this chart:

In the 1Q12, the US consumed $3.438 trillion of durable and non-durable goods. These are seasonally adjusted, annual rates. That market -- in and of itself as -- is larger than all total world economies save three -- Japan ($5.4 trillion), China ($5.8 trillion) and the EU region ($12.4 trillion).
In addition, the US has one of the highest standards of living. This has important implications from a production perspective. An economy in this position is not going to produce many low-end products; it simply costs too must to do that here. There are other countries that have lower standards of living which are far better suited for this type of production. This gives them a better absolute advantage, which an economist defines as:
There is also the issue that we are the world's largest oil consumer. In 2009, the US consumed 18.6 million bbl/day. The second largest consumer was China, whose total was 8.2 million bbl/day -- less than half our consumption. Here's a chart from Calculated Risk that shows the trend in imports with oil as a separate category.

The red line shows the effects of being a net oil importer; that's the trade deficit without oil.
So -- there are three fundamental factors that make the US an overall net importer:
1.) The sheer size of out consumer market, which, on a seasonally adjusted annual basis is larger than all but the largest economies in the world.
2.) The fact we have a higher standard of living, making it inefficient to produce a fairly large number of goods here, and
3.) The fact we're a net oil importer, which accounts for a large amount of our overall trade deficit.

In the 1Q12, the US consumed $3.438 trillion of durable and non-durable goods. These are seasonally adjusted, annual rates. That market -- in and of itself as -- is larger than all total world economies save three -- Japan ($5.4 trillion), China ($5.8 trillion) and the EU region ($12.4 trillion).
In addition, the US has one of the highest standards of living. This has important implications from a production perspective. An economy in this position is not going to produce many low-end products; it simply costs too must to do that here. There are other countries that have lower standards of living which are far better suited for this type of production. This gives them a better absolute advantage, which an economist defines as:
This is the simplest yardstick of economic performance. If one person, firm or country can produce more of something with the same amount of effort and resources, they have an absolute advantage over other producers. Being the best at something does not mean that doing that thing is the best way to use your scarce economic resources. The question of what to specialise in--and how to maximise the benefits from international trade--is best decided according to comparative advantage. Both absolute and comparative advantage may change significantly over time.Finally, in using the terms "standard of living," I'm not making a value judgment, but a simple economic explanation of why countries like China and Vietnam are becoming manufacturing net exporters (much the same way that Taiwan and South Korea did before).
There is also the issue that we are the world's largest oil consumer. In 2009, the US consumed 18.6 million bbl/day. The second largest consumer was China, whose total was 8.2 million bbl/day -- less than half our consumption. Here's a chart from Calculated Risk that shows the trend in imports with oil as a separate category.

The red line shows the effects of being a net oil importer; that's the trade deficit without oil.
So -- there are three fundamental factors that make the US an overall net importer:
1.) The sheer size of out consumer market, which, on a seasonally adjusted annual basis is larger than all but the largest economies in the world.
2.) The fact we have a higher standard of living, making it inefficient to produce a fairly large number of goods here, and
3.) The fact we're a net oil importer, which accounts for a large amount of our overall trade deficit.
Morning Market Analysis: BRICs Signaling Bear Markets and Recession

The Brazilian ETF continues to move lower. The ETF topped out just above 70, but is currently trading at 57.57 -- a drop of nearly 20%. The internals are decidedly negative -- all the EMAs are moving lower, and the MACD is dropping.

The real is in the same boat. Prices were in an upward sloping channel, but moved through support last week. The 19 level is very crucial -- a move through those levels would make the 18.5 level the most likely price target.

The Russian market is nearly as bad as the Brazilian market. Prices have dropped below the 38.2% Fibonacci level and all the EMAs are moving lower. The MACD has also given a sell signal. The Russian market has almost dropped 20%.

The Indian market was in downward sloping wedge pattern. Prices have broken below support and are now heading lower. All the EMAs are moving lower and money is flowing out of the market. Prices have dropped nearly 20% -- almost good enough for a bear market.

The Rupee has been in a downward sloping channel for three months, dropping below the 200 day EMA. The shorter EMAs are all moving lower as well.

After falling about 13%, the Chinese market rebounded at the beginning of April to the 50% Fib level. However, prices have again fallen with the current price target being the 35.5 level.
The above charts all signal that the developing markets are in bad shape. This does not bode well for the next few months.
Subscribe to:
Posts (Atom)