Friday, August 21, 2009

Weekend Weimar and Beagle

It's that time of the week. I'll be back on Monday -- until then.....


Philly Fed Increases

From the Philadelphia Federal Reserve:

The survey's broadest measure of manufacturing conditions, the diffusion index of current activity, increased from -7.5 in July to 4.2 this month. This is the highest reading of the index since November 2007 (see Chart). The percentage of firms reporting increases in activity (27 percent) was slightly higher than the percentage reporting decreases (23 percent). Other broad indicators also suggested improvement. The current new orders index edged six points higher, from -2.2 to 4.2, also its highest reading since November 2007. The current shipments index increased 10 points, to a slightly positive reading.

Labor market conditions remain weak. Firms continue to report declines in employment and work hours, but overall job losses were not as large this month. The current employment index increased from a weak reading of -25.3 to -12.9, its highest level in 11 months. Twenty-three percent of firms reported declines in employment this month, down from 30 percent in the previous month. Although the workweek index remained negative, the index increased nine points, to -6.3.


Here's the chart:


Bottom line: this is the second manufacturing report this week that has been positive. Things are looking better.

Jobless Claims Up

From the Department of Labor

In the week ending Aug. 15, the advance figure for seasonally adjusted initial claims was 576,000, an increase of 15,000 from the previous week's revised figure of 561,000. The 4-week moving average was 570,000, an increase of 4,250 from the previous week's revised average of 565,750.


Let's take a look at the chart:


What does the chart show?

1.) Claims have moved higher over the last few weeks. BUT

2.) The overall trend is still lower.

Even if we stall at this level for another month or two, we're still in better shape than we were a few months ago.

Forex Fridays

Click on all images for a larger image


The weekly chart still have a bearish bias. The MACD and the RSI are both heading lower. Prices formed a double top earlier this year and have since moved lower. All the EMAs are moving lower, the shorter EMAs are below the longer EMAs and prices are below all the EMAs.


The daily chart is still meandering. It moved down to the 77 level, only to move back up a bit. The MACD and RSI are very neutral; the MACD is sort-of moving and the RSI is at 50 which is very neutral. The 10 and 20 day EMA and prices are locked together in a very tight range and prices have moved in a very small range over the last few weeks.

Thursday, August 20, 2009

Today's Market


Click for a larger image

For the second time in about a month or so, the market has confounded me. On Monday a a big drop in the Chinese market led me to believe a sell-off was here. Considering the market is pretty overbought right now and the overall position of the technical indicators this made a great deal of sense. In addition, the Treasury market was at important technical levels indicating conservative plays were back in fashion.

Then the market started to rally. And it still is. However, notice that the MACD is still moving lower and has given a sell signal. Also note the RSI is moving lower. Both of those indicate the market is weakening.

Now -- will it make another move lower? Who knows at this point.

More Signs of An Economic Bottom Emerge

Over the last week and a half more data has emerged that the economies of the US and our trading partners are stabilizing. Let's take a look at the data.

From the WSJ:

Norway's second-quarter mainland gross domestic product, which strips out oil and shipping activity, grew 0.3% on the quarter-earlier period, Statistics Norway said Thursday. The latest data mark an end to a two-quarter streak of declining GDP, with output down a revised 1.3% in the first quarter, and is much stronger than consensus from economists who expected a slight contraction in the second quarter.


And this is part of a larger picture in the OECD:

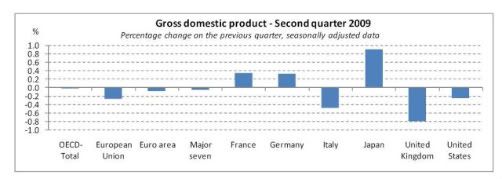
Gross domestic product (GDP) in the OECD area stabilised in the second quarter of 2009 (minus 0.002%), according to preliminary estimates, following a fall of 2.1% in the previous quarter.

For the Major Seven* countries, GDP fell marginally by 0.1% but with considerable variation in national rates, ranging from a 0.9% increase in Japan, following two quarters of significant falls (minus 3.1% and minus 3.5%), to a 0.8% decline in the United Kingdom. Positive growth was also recorded in France and Germany, both up 0.3% compared with falls of 1.3% and 3.5% respectively in the previous quarter. GDP fell by 0.3% in the United States following a 1.6% fall in the previous quarter. etc.


Here is a chart of the growth rates:


Japan grew surprisingly well with Germany and France also printing increases. However, Italy fell as did the UK, indicating there is further work to do.

And other countries are emerging from contraction:

Hong Kong's gross domestic product in the April-June period grew 3.3% on a seasonally adjusted basis from the January-March period, when it contracted 4.3%.

The quarter-to-quarter expansion was the first since last year's second quarter.

On a year-to-year basis, the territory's second-quarter GDP contracted 3.8%, narrower than the previous quarter's 7.8% fall and better than the survey's median forecast of a 5% decline.


And then there is Israel:

Israel's gross domestic product grew in the second quarter following six months of contraction, the latest sign the global economy may be emerging from its severe downturn.

The Central Bureau of Statistics Sunday said GDP grew at an annualized rate of 1% in the three months from April to June, having contracted by 3.2% in the first quarter 2009, and by 1.4% in the fourth quarter 2008.

"The aggregate data from the most recent quarters attest that the situation of the Israeli economy is better than those of the world's leading economies," Prime Minister Netanyahu said in a statement.

The return to growth was aided by a surge in government spending, but a recovery in exports and consumer spending also drove the pickup. However, some of the recovery in exports may relate to the start of full production at Intel Corp.'s (INTC) new factory, and may therefore not be sustained in coming quarters.


The important point to note with the above information is this: we're not talking about one country; we're seeing data emerge from a variety of countries on a variety of continents that growth is returning. It's important to note this is one quarter of data. However -- it's more than one country which is an extremely hopeful sign.

And the US is also showing further signs of good news.

For the first time in considerably more than a year, the Empire State Manufacturing Survey indicates that conditions for New York manufacturers have improved. The general business conditions index increased 13 points, to 12.1, its highest level since November of 2007. Although the inventories index remained well below zero, the new orders and shipments indexes rose to their highest levels in many months. The prices paid index was positive, while the prices received index continued to be negative. Employment indexes were much improved from their recent low levels, although they remained below zero. Future indexes generally rose from last month and conveyed optimism about the six-month outlook; the capital expenditures index rose to its highest level in over a year.


This number bottomed at the beginning of this year, but has been in a clear uptrend since then. Now it has turned positive which is a very hopeful sign. And adding to the good news was last Friday's industrial production number:

Industrial production increased 0.5 percent in July. Aside from a hurricane-related rebound in October 2008, the gain in July marked the first monthly increase since December 2007. Manufacturing output advanced 1.0 percent in July; most of the increase was due to a jump in motor vehicle assemblies from an annual rate of 4.1 million units in June to 5.9 million units in July. Excluding motor vehicles and parts, manufacturing production edged up 0.2 percent. The output of utilities fell 2.4 percent, reflecting unseasonably mild temperatures in July, and the output of mines increased 0.8 percent. At 96.0 percent of its 2002 average, total industrial production was 13.1 percent below its level of a year earlier. In July, the capacity utilization rate for total industry edged up to 68.5 percent, a level 12.4 percentage points below its 1972-2008 average.


This is the first increase in quite some time. As a result, be cautioned that the general trend is still lower. However the rate of decline in this number has been decreasing over the last 6 months and various industry indicators (like the ISM and various regional Federal Reserve surveys) have been showing increases, so there is a good reason to be hopeful we're seeing a bottoming out in this area as well.

And there are further signs the housing market may actually be hitting a bottom as well:

New-home construction and permits fell last month, but single-family-home starts remained strong, another sign of stabilization in the housing market.

Multifamily housing starts, a more volatile measure that includes properties such as condominiums and small apartment buildings, pulled overall housing starts down 1% in July from a month earlier to a seasonally adjusted 581,000 annual rate, the Commerce Department said Tuesday. That compares with a 6.5% increase in June.

Construction of single-family homes, though, rose 1.7%, to 490,000, in July after climbing 17.8% in June. Single-family permits, a sign of future construction, rose 5.8%. The rise in construction marked the fifth consecutive monthly gain, showing once again that the housing market is firming up, albeit at a slow pace.


Let's place all of this data in context. The US economy has gone through its worst recession since the Great Depression. That means we're not going to simply wake up and see strong growth and low unemployment. Instead, it's far more likely to see the types of data we have been seeing for the last few months -- a gradual change from free fall to a moderate drop followed by a bottom. The data over the last few months give strong reasons to think the worst is over.

Thursday Oil Market Round-Up and Today's Market

Click on all images for a larger image


Yesterday was driven by the oil market. The market sold-off at the opening. Then we had the weekly petroleum report which said oil inventories dropped. This led to a big rally in oil. However, one day's action has to be put into a larger context. Note on the weekly chart we may be printing a double top. Also note the RSI has yet to rise above previous levels. Prices are just above the 50 day EMA, but the 10 and 20 day EMA are fast approaching from below; both will probably continue moving higher through the 50 day EMA in a bit.


Despite yesterday's action, notice that the RSI has been remarkably weak over the last few weeks. In addition, prices are still below previous levels. However, the EMAs still have a very bullish bias -- the shorter are above the longer and all are moving higher.


Oil was a big reason for yesterday's price action in the markets. Notice that markets started out lower on the news of China's sell-off. But prices rose to near opening levels. Then we learned there was a drop in crude oil inventories which led to a huge market rally. Near the end of the day prices sold-off a bit, but that is to be expected. However,


In the 5 day picture, notice that we're still within the Fibonacci retracement levels. And on the daily chart:


We're simply bouncing from technical levels.

Wednesday, August 19, 2009

Single Family Home Starts Increase

From the WSJ:

Multifamily housing starts, a more volatile measure that includes properties such as condominiums and small apartment buildings, pulled overall housing starts down 1% in July from a month earlier to a seasonally adjusted 581,000 annual rate, the Commerce Department said Tuesday. That compares with a 6.5% increase in June.

Construction of single-family homes, though, rose 1.7%, to 490,000, in July after climbing 17.8% in June. Single-family permits, a sign of future construction, rose 5.8%. The rise in construction marked the fifth consecutive monthly gain, showing once again that the housing market is firming up, albeit at a slow pace.

While many economists agree the market already has hit bottom, housing-sector growth may not be a contributor to gross domestic product until next year because it is rebounding from such an extreme low. Singe-family starts are still 73% below their December 2005 peak.

"You don't want to lose sight of the fact that these are extremely depressed levels," said Wells Fargo Securities economist Adam G. York. "It's not necessarily time to break out the champagne and celebrate the boom of a returning housing market."


As the last paragraph notes, we're at extremely depressed levels. Here is a chart that shows those levels:


From the bigger picture, this is good news. I'm still reluctant to say the free fall is over, but five months of increases is a good development. In addition, it indicates we have a trend in place -- and a good trend at that.

OECD Sees Stabilization

From the WSJ:

Gross domestic product in the Organization for Economic Cooperation and Development's 30 member countries stabilized between April and June with support from exporters Germany and Japan, but it remained sharply lower than in the second quarter of last year, the Paris-based group said Wednesday.

GDP across the OECD area, which includes many of the world's biggest economies, was steady in the second quarter compared with the first three months of the year, breaking one year of quarterly declines and a sharp reversal from the record 2.1% slump seen in the first quarter.

But GDP for the 30 countries was 4.6% lower than in the second quarter of last year, only marginally improved from the 4.7% year-to-year decline seen in the first quarter, it said.

The OECD report supports the view that the severe global economic downturn caused by the credit crisis is bottoming out, although the group has warned that the recovery is likely to be weak and fragile.


Let's take a look at the charts. Click on all charts for a larger image.


The above chart shows that we've seen fair quarter to quarter increases from Japan, Germany and France.


The above chart shows that the month to month decrease is slowing. However,


The year over year declines are still large. However, we've only seen one quarter of quarter to quarter moderation so we're not going to see improvement in the year over year numbers yet.

This is good news as we'll need out trading partners to be healthier. I think one of the drivers of the US recovery will be exports.

Wednesday Commodities Round-Up


Agricultural prices formed a price island over the last few weeks. However, over the last few days they have fallen from this area. Note that prices were right below the 200 day EMA far a few weeks but could not get over this hurdle. In addition prices are now below all the EMAs. However, the shorter EMAs are bunched together indicating a lack of direction.


Industrial metals are forming a price island after a long rally. Considering the higher level of volume on this gap compared to previous volume levels, this may be an exhaustion gap indicating the top of a rally. Metals have rallied in anticipation of economic recovery, so signs that the economy is not going to recover would add further downward pressure. There may also be the issue of the rally simply being a bit long in the tooth. In addition


The MACD has given a sell signal.

Tuesday, August 18, 2009

Today's Markets


Click for larger image

While the markets rose today, it sure looks like the SPYs are starting to form a bear market pennant pattern. In addition, the MACD has given a sell signal and prices are moving up a Fibonacci fan. And don't forget we saw a gap down which is never good for the bulls

My guess is we'll see a further correction from here.

IMF Says Recession Is Over

From Marketwatch

The global recession is now over and a recovery has begun, Olivier Blanchard, the top economist for the International Monetary Fund, said Tuesday.

The global recession has not been typical, and the recovery won't be either, he said. "One should not expect very high growth rates in the recovery."

"The turnaround will not be simple," Blanchard wrote in an article released by the IMF. "The crisis has left deep scars, which will affect both supply and demand for many years to come." His article will be published by the IMF on Wednesday.

To an economist, the term "recovery" has a specific technical meaning: The economy is growing once again, but has not necessarily returned to its previous levels of output, wealth or employment. The economy is healing, but not yet healed.

Indeed, Blanchard said this recession has been so destructive that "we may not go back to the old growth path ... potential output may be lower than it was before the crisis."

Growth is coming for most countries, for at least the next few quarters, he said, but it won't be strong enough to reduce unemployment for a while.

Fed's Loan Survey Overview

Here is a link to the complete report. Let's take a look at the summation charts.

Click on all images for a larger image.


Notice that while the percentage of respondents tightening standards is still positive, the overall trend is decreasing, meaning the percentage of banks tightening their standards is decreasing. This trend has been in place since the first of the year.


However, commercial real estate loan demand is still dropping -- and has been for some time.


As with the commercial real estate loans, commercial and industrial loan standards are still tightening, but at a slower pace than the beginning of the year.


And C and I loan demand is still weak.


Finally, demand for residential loans is increased strongly during the first half of this year but has dropped a bit since.

What do these charts tell us overall?

1.) Loan demand is extremely weak except for residential real estate loans.

2.) Lending standards are still tightening, but at a slower pace than the beginning of the year.

Treasury Tuesdays


The Treasury market is caught between two strong currents. On the down side is the large amount of issuance the US government will have to make over the next few years. Excess supply means decreasing prices and increasing rates. At the same time, the Treasury market is still the traders safe haven when the market drops.

The safe haven bid was in full display yesterday as the market dropped hard. In addition, the Treasury had some very successful auctions last week which allayed fear that there would be decreasing demand for US Treasuries. As a result the market caught a strong bid which has driven prices through resistance levels.

Notice that prices have run into upside resistance at the lower 90s level two times over the last few months. that means we're in an important area. A move through this level would probably signal further upside moves.

Monday, August 17, 2009

Today's Markets

The big news in all the charts show a gap down.


The SPYs are right at technical support.


The QQQQs have a ways to go and


The IWMs are at support as well.

While I am sure there are people in a panic about this, I'm not. The market needs a sell-off right now; we've come a long way and it's time to drive out some weak positions.

Has Housing Hit A Bottom?

From Marketwatch:

*

Home builders are gradually becoming more hopeful, even though surveys show most builders are still very discouraged. The builders' housing market index has risen in four of the past five months.
*

Housing starts have increased in four of the past five months after tumbling to a postwar record low. Building permits for single-family homes have risen at a 109% annual rate over the past three months.
*

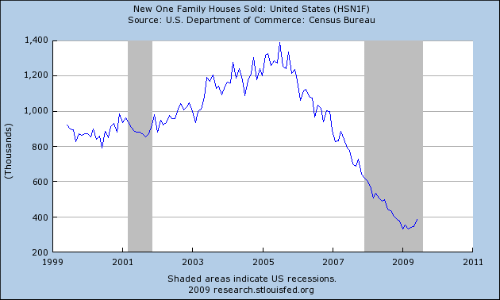
Sales of new single-family homes have risen three months in a row after falling to a record low in March.
*

Sales of existing homes have risen four of the past five months, supporting by a government subsidy for first-time buyers and by sales of foreclosed homes.


Several people including myself have made the same observation. The pace of home sales appears to be stabilizing at low levels. There are three reasons for this.

1.) The $8000 first time home buyer tax credit is attracting buyers.

2.) Interest rates are still low

3.) Homes are affordable by historical standards right now.

Here's a chart of new home sales


And here's a chart of existing home sales.

Now - it's a different story for home prices which are still going to be dropping for the foreseeable future. Consider this chart of the Case Shiller home price index:


Home prices are still dropping. The last time this series of numbers printed we actually saw month to month price increases in a majority of cities:


Click for a larger image

That was the first month to month increase in some time so calling it a trend is not possible. But the increase was a welcome change from the continuing decrease we've seen.

Bottom line, I still think Calculated Risk is right -- we'll see two housing bottoms. The first is in sales which we are already seeing and a second in prices which is still a ways off.

Consumer Confidence Drops

From Bloomberg:

Confidence among U.S. consumers unexpectedly fell in August for a second consecutive month as concern over jobs and wages grew.

The Reuters/University of Michigan preliminary index of consumer sentiment decreased to 63.2, the lowest level since March, from 66 in July. The measure reached a three-decade low of 55.3 in November.

The worst employment slump in seven decades has caused salaries to stagnate, rocking even Americans who still have jobs. The need to rebuild savings following the record drop in wealth from the plunge in stocks and home values will keep limiting spending in coming months.

“The consumer’s not off to a good start in the third quarter,” Jonathan Basile, an economist at Credit Suisse in New York, said before the report. “The concerns they’ve had because of jobs and income are still lingering and showing in their lack of spending.”

Here is the chart:


However, consider these charts from Pollster.com

The number of people who think the economy is getting better is once again increasing. And

The right track/wrong track numbers are again moving in the right direction.

These polls measure different parts of the same idea -- are thing getting better or worse and when do you think things are getting better?


At the heart of these issues is the employment picture which is still terrible and won't be improving for some time. That means we could be seeing these numbers are low levels for some time, adding further evidence that the consumer won't be a big player in the recovery.

Finally, I will note that I have not been expecetinig the consumer to play a role.

Empire State Increases

From the NY Fed:

In August, after more than a year of negative readings, the general business conditions index rose into positive territory and reached its highest level since November 2007—a clear indication that, on balance, business conditions had improved for New York State manufacturers. Thirty percent of respondents said that conditions had improved over the month, while 18 percent said that conditions had deteriorated. The new orders index rose 8 points to 13.4, and the shipments index rose 3 points to 14.1. Both of these indexes were at their highest levels in more than a year. The unfilled orders index rose slightly, to -9.6. The delivery time index, at -10.6, hovered near last month’s level. The inventories index rose 14 points from a very low level in July, but remained well below zero at -22.3.


This is more good news for the manufacturing sector. Industrial production printed a .5 increase on Friday which was the first increase in quite some time. This number from the NY Fed should increase the possibility of that increase continuing.

Market Mondays


On the daily chart, note that prices consolidated last week. This is the best possible situation for the bulls. However, the MACD is moving into a situation where it might give a sell signal. This isn't fatal -- in fact, the bull should welcome a 5%-10% sell-off right now. Prices are still using the EMAs for technical support rather than resistance. However -- notice the 200 day EMA is not moving in a positive direction. That is an extremely important long-term development.


A lot of the commentary for the SPYs applies to the QQQQs. The big difference in the chart is the MACD has already given a sell signal. As the QQQQs have led the rally higher this is an important development.


The IWMs are somewhere between the SPYs and the QQQQs. They have given a MACD sell signal, but the indicator has not progresssed as far as the QQQQs indicator. Still -- and like the other two major averages -- this average has advances strongly over the last few months and could use a sell off.

I have included fibonacci levels in the event of a pull back.