Friday, January 12, 2007
Weekend Weimar
This is the exact same look I get every morning before I walk my two -- an 11-Year old female named Kate and a 2-3 Year Old male named Sarge. They will sit there and just stare at me.
I'm traveling this weekend, so I won't be posting until Sunday night.
Have a good weekend.
Import Prices Up 1.1%
From the BLS:
There is good news for Fed watchers in this report. Note that nonpetroleum import prices are showing a decreasing trend. On an annual basis, they rose 3.7% in 2004, 2.4% in 2005 and 1.7% in 2006. That annual trending decrease may rekindle speculation about a rate cut in the coming year.
In addition, oil prices have dropped in a big way since the beginning of the year. Depending on oil's price action for the remainder of the month, this may make the 1.1% increase in December nothing more than statistical noise.
The December to December percent changes in commodity imports was 2.5% for 2006, which is a decrease from the 8% increase in the December to December 2005 period. A decrease in oil prices is the primary reason for the drop.
Import prices rose for the second consecutive month in December and the 1.1 percent increase was the largest monthly advance since May. The price index for overall imports also increased for the fifth straight year in 2006, advancing 2.5 percent after more substantial increases of 8.0 percent and 6.7 percent in 2005 and 2004, respectively.
A 4.8 percent increase in petroleum prices was the largest contributor to the overall December rise. Petroleum prices resumed their upward trend after declining 21.5 percent for the three-month period ended in November. The index rose 6.2 percent overall in 2006, the fifth consecutive year the index advanced, but the smallest annual increase over that period.
Nonpetroleum prices increased 0.4 percent in December after a 0.9 percent advance the previous month. Prices for nonpetroleum imports rose 1.7 percent over the past 12 months after advancing 2.4 percent and 3.7 percent in 2005 and 2004, respectively. The December increase in nonpetroleum prices was driven by a 1.5 percent rise in nonpetroleum industrial supplies and materials prices. That advance in turn was led by higher prices for natural gas, up for the second consecutive month, metals and chemicals prices. The price index for nonpetroleum industrial supplies and materials increased 4.5 percent over the past year.
There is good news for Fed watchers in this report. Note that nonpetroleum import prices are showing a decreasing trend. On an annual basis, they rose 3.7% in 2004, 2.4% in 2005 and 1.7% in 2006. That annual trending decrease may rekindle speculation about a rate cut in the coming year.
In addition, oil prices have dropped in a big way since the beginning of the year. Depending on oil's price action for the remainder of the month, this may make the 1.1% increase in December nothing more than statistical noise.
The December to December percent changes in commodity imports was 2.5% for 2006, which is a decrease from the 8% increase in the December to December 2005 period. A decrease in oil prices is the primary reason for the drop.
Retail Sales Increase .9* in December
From the Census Bureau:
Yes, there's an asterisk in the title for a reason. I have a serious problem with this number.
First -- allow me to pat myself on the back. From CBSMarketWatch:
Regarding the last report, I noted:
OK -- self-congratulation over.
Regarding the new .9% increased, consider the following from the International Herald Tribune on January 4th:
The economist at the International Counsel of Shopping Centers was less optimistic about the sales numbers than the Census Bureau's numbers indicate. Considering this guy is paid to help spin numbers positively, his statements are very telling. Even removing gas sales from the total we get an increase of .6% which still seems high considering that less than robust pace reported in early January.
In addition, considering the following retail sale headlines from early January courtesy of the Big Picture:
Basically we have the same problem in December that we had in November. Every other data point suggests a fair Christmas season while the Census says sales were really good. Again -- color me skeptical.
The U.S. Census Bureau announced today that advance estimates of U.S. retail and food services sales for December, adjusted for seasonal variation and holiday and trading-day differences, but not for price changes, were $369.9 billion, an increase of 0.9 percent (±0.7%) from the previous month and up 5.4 percent (±0.7%) from December 2005. Total sales for the 12 months of 2006 were up 6.0 percent (±0.5%) from 2005. Total sales for the October through December 2006 period were up 4.9 percent (±0.5%) from the same period a year ago. The October to November 2006 percent change was revised from +1.0 percent (± 0.8%) to +0.6 percent (± 0.2%).
Yes, there's an asterisk in the title for a reason. I have a serious problem with this number.
First -- allow me to pat myself on the back. From CBSMarketWatch:
Retail sales increased a revised 0.6% in October and 0.7% excluding autos. This is down from the initial estimate of a 1% gain in overall sales and a 0.9% ex-auto gain.
Regarding the last report, I noted:
So, while the Census data says retail sales increased at a high rate in November, all other surveys say sales of various retail sales components decreased. There is an important difference in methodology in the other reports because they are seasonally adjusted. However, using the old Sesame Street game "One of these things is not like the other one" we come to the conclusion the Census will probably lower their numbers for November.
OK -- self-congratulation over.
Regarding the new .9% increased, consider the following from the International Herald Tribune on January 4th:
Industry sales at stores open more than a year rose 3.1 percent in December, making the holiday season this year the slowest in two years, the International Council of Shopping Centers said. Federated Department Stores' sales rose less than analysts anticipated, and Gap lowered its profit forecast by 18 percent after sales declined.
Slower growth threatens holiday-season profits, which account for almost a third of the industry's annual earnings. Retailers discounted flat-screen televisions, while cold-weather clothes went unsold during the warmest December in a decade.
The slowdown is also an indication that the global economy might not be able to count on the spendthrift U.S. consumer as much as it has in the past.
"The numbers are going to be less robust than everyone hoped for," said Patricia Edwards, who manages assets at Wentworth, Hauser & Violich in Seattle. "Promotions were high and earnings are going to be difficult across the board."
Sales for the two months of November and December increased 2.8 percent. In 2005, sales for the two months had risen 3.6 percent, while sales for December alone had gained 3.5 percent.
"It's at best a moderate gain," said Michael Niemira, chief economist of the International Council of Shopping Centers. "We have certainly seen a slower pace of spending at the end of the year. That's what we're likely to see in 2007."
The economist at the International Counsel of Shopping Centers was less optimistic about the sales numbers than the Census Bureau's numbers indicate. Considering this guy is paid to help spin numbers positively, his statements are very telling. Even removing gas sales from the total we get an increase of .6% which still seems high considering that less than robust pace reported in early January.
In addition, considering the following retail sale headlines from early January courtesy of the Big Picture:
• Retailers Post Disappointing Sales For December on Heavy Discounts (WSJ)
• Warm weather and gift cards pinch December sales (Marketwatch)
• U.S. Retailers' December Sales Slow on Price Cutting (Bloomberg)
• Time to Take Down the Decorations, Earnings Forecasts (Holiday Sales Tracker)
• Shopping Bags Half Empty
• Retailers Post Disappointing December Sales (AP)
• Wal-Mart Expects Continued Paltry Gains (WSJ)
Basically we have the same problem in December that we had in November. Every other data point suggests a fair Christmas season while the Census says sales were really good. Again -- color me skeptical.
Three Big Tech Companies Issue Earnings Warnings
Chip maker Advanced Micro Devices Inc.fell sharply in electronic trading before the opening bell after it warned that quarterly revenue would fall short of analysts' estimates.
In addition, German software maker SAPposted earnings that fell shy of forecasts and South Korea's Samsung Electronics Co. Ltd. <005930.KS> signaled a tough first quarter on weak demand for flat panel display screens.
We are still very early in the earnings season, so any hard conclusions are not warranted from these announcements. However, the latest rally has been a tech driven rally. So it's important to keep a wary eye on these numbers to see how they play out.
Link
Thursday, January 11, 2007
Manufacturing Survey Show Slower Growth
From Reuters
We've seen similar performance from other manufacturing indicators over the last few months. They have all shown a drop in current activity but higher future expectations. I am a bit skeptical of future expectations, largely because it's difficult to see someone being pessimistic about the six-month outlook unless the economy is in a recession.
In short, it looks like the current expectations for manufacturing are for a slower growth environment.
U.S. economic growth will moderate in the first half of this year and manufacturing will likely play its part in that slowdown, according to a quarterly survey of manufacturing executives released on Thursday.
The Manufacturers Alliance/MAPI Survey on the Business Outlook showed a slowing in the first half. But strong balance sheets and liquidity will help businesses weather a profit slowdown during the year.
The survey index fell to 54 from 64 in the Sept. 2006 survey, the lowest since a reading of 52 was recorded in March 2002 and breaking a streak of 16 consecutive quarters above 60.
We've seen similar performance from other manufacturing indicators over the last few months. They have all shown a drop in current activity but higher future expectations. I am a bit skeptical of future expectations, largely because it's difficult to see someone being pessimistic about the six-month outlook unless the economy is in a recession.
In short, it looks like the current expectations for manufacturing are for a slower growth environment.
Good and Bad News in the Unemployment Report
From the Department of Labor:
Here's the bad news: 8 states had 1,000 or more lay-offs caused in part by construction losses. Pennsylvania and Wisconsin each had more than 17,000 lay-offs. On the good side, Florida had fewer construction related lay-offs.
While the overall decrease is good, this is the third week in the last 6 when construction related lay-offs have caused 1,000 or more lay-offs in more than a few states.
In the week ending Jan. 6, the advance figure for seasonally adjusted initial claims was 299,000, a decrease of 26,000 from the previous week's revised figure of 325,000. The 4-week moving average was 314,750, a decrease of 1,750 from the previous week's revised average of 316,500.
Here's the bad news: 8 states had 1,000 or more lay-offs caused in part by construction losses. Pennsylvania and Wisconsin each had more than 17,000 lay-offs. On the good side, Florida had fewer construction related lay-offs.
While the overall decrease is good, this is the third week in the last 6 when construction related lay-offs have caused 1,000 or more lay-offs in more than a few states.
Fed President Moscow on Inflation
From a speech yesterday:
Translation: We're not lowering rates if I have anything to say about it.
On the inflation front, core inflation—as measured by the 12-month change in the price index for personal consumption expenditures excluding food and energy—increased from 1.3 percent in the summer of 2003 to a recent high of 2.4 percent in October. In part, core inflation has been elevated because businesses have raised their prices in response to earlier increases in energy costs. High levels of resource utilization also have added more generally to inflationary pressures.
By my standards, inflation has been too high. I prefer to see it between 1 and 2 percent. The most recent news on inflation has been good, with the 12-month change in core PCE coming down from 2.4 percent in October to 2.2 percent in November. Looking ahead, core inflation likely will ease somewhat further. The deceleration in economic growth reduces somewhat the risk of sustained pressures from resource constraints. And the recent period of lower oil prices clearly is a positive factor.
Although the recent news has been favorable, risks to the inflation outlook remain. Additional cost shocks at this time would be unwelcome, or we could be wrong about reduced pressures from resource constraints. Long periods of high resource utilization are often associated with rising costs and prices. And today, as I mentioned, the unemployment rate is at the low end of the estimates for the natural rate. Growth in compensation per hour over the past year was not much higher than it was in 2004 and 2005. This measure includes benefits as well as wages and salaries. But unit labor costs have accelerated because of changes in productivity. Although the underlying trend is still solid, productivity growth over the past several quarters has moderated from exceptionally strong rates. And down the road, tight labor markets could generate some larger gains in compensation. However, profit margins are relatively high, so some further increases in labor costs could be absorbed by businesses in the form of lower margins.
Another risk to the inflation outlook would be if the recent positive news on inflation turns out to be transitory. Disappointing numbers on actual inflation rates could cause inflation expectations to run too high. If firms and workers expect inflation to be high, they will want to compensate by raising prices and wages or building in plans for automatic increases. In this way, high inflation expectations can lead to persistently high actual inflation.
So the summary on inflation is that the recent price data have been consistent with some easing in core inflation. The key going forward is whether that trend can be sustained and how quickly inflation will move back to the range that is commensurate with price stability. And we need to continue to be vigilant in monitoring the risks to the inflation outlook.
Translation: We're not lowering rates if I have anything to say about it.
Pros See Same Level or More M&A Activity
New Year's Day may have come and gone, but dealmakers would be wise to restock their champagne cellars right away. The high levels of merger-and-acquisition activity that characterized 2006 will likely continue, even grow, through the first half of this year, according to the Association for Corporate Growth. And the main drivers of the deals — private equity firms — will continue to be big players, the member association predicts.
Nearly half of the 1,230 private equity professionals, investment bankers, corporate development professionals, lawyers, and accountants who responded to an ACG and Thomson Financial survey in December said they expect merger activity will increase in the next six months. Forty-one expect M&A activity to stay level, while only 9 percent say the pace will slow down.
At a combined total value of $1.6 trillion, last year's M&A action in the United States came close to topping the $1.7 trillion record for values of U.S. transactions set in 2000. And globally, 2006's worldwide M&A value — worth $3.8 trillion — beat 2000's numbers and was 38 percent higher than 2005's total, according to Thomson Financial. Overall, it was "a banner year" for mid-market and mega deals, says Elliott Williams, president of Mirus Capital Advisors and the Boston chapter of ACG.
The large amount of M&A activity helped to put a bid in the market last year. We'll have to wait and see if it does the same this year.
Link
Wednesday, January 10, 2007
Trade Deficit Narrows Slightly
From the Bureau of Economic Analysis
A few notes:
1.) With one reporting month left, the 2006 trade deficit is already $15.836 billion shy of the record 2005 level. In other words, 2006 will be another record year.
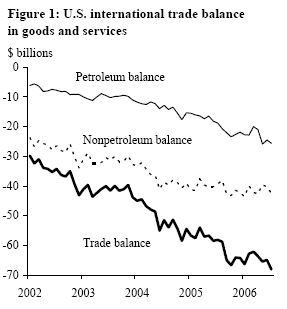
2.) By far the US' biggest import is oil which comprised 10.33% of total imports in November 2006. On September 22 of last year, the San Francisco Federal Reserve released a study on oil prices and the trade deficit. Here is there conclusion:
The study had the following graph which illustrates the point:
As oil prices are continuing to drop the trade deficit will probably continue to narrow over the coming months. This bodes well for a decrease in the trade deficit next year.
The U.S. Census Bureau and the U.S. Bureau of Economic Analysis, through the Department of Commerce, announced today that total November exports of $124.8 billion and imports of $183.0 billion resulted in a goods and services deficit of $58.2 billion, $0.6 billion less than the $58.8 billion in October, revised. November exports were $1.1 billion more than October exports of $123.7 billion. November imports were $0.5 billion more than October imports of $182.5 billion.
In November, the goods deficit decreased $0.3 billion from October to $64.7 billion, and the services surplus increased $0.2 billion to $6.5 billion. Exports of goods increased $0.6 billion to $89.1 billion, and imports of goods increased $0.3 billion to $153.8 billion. Exports of services increased $0.5 billion to $35.7 billion, and imports of services increased $0.3 billion to $29.2 billion.
In November, the goods and services deficit was down $5.8 billion from November 2005. Exports were up $14.8 billion, or 13.4 percent, and imports were up $9.0 billion, or 5.2 percent.
A few notes:
1.) With one reporting month left, the 2006 trade deficit is already $15.836 billion shy of the record 2005 level. In other words, 2006 will be another record year.
2.) By far the US' biggest import is oil which comprised 10.33% of total imports in November 2006. On September 22 of last year, the San Francisco Federal Reserve released a study on oil prices and the trade deficit. Here is there conclusion:
Oil prices have almost quadrupled since the beginning of 2002. For an oil-importing country like the U.S., this has substantially increased the cost of petroleum imports. International trade data suggest that this increase has exacerbated the deterioration of the U.S. trade deficit, especially since the second half of 2004. One factor can explain this evolution: The real volume of U.S. petroleum imports has remained essentially constant. One explanation for why the demand for petroleum imports has not declined in response to higher prices comes from a model in which firms are fairly limited in their ability to adjust their use of energy sources, such as oil, in the short term.
The study had the following graph which illustrates the point:
As oil prices are continuing to drop the trade deficit will probably continue to narrow over the coming months. This bodes well for a decrease in the trade deficit next year.
CEOs More Optimistic
From the Boston Globe:
This could indicate an increase in corporate expenditures in the coming months which has shown some strength over 2006. According to the Bureau of Economic Analysis' NIPA tables, nonresidential fixed investment increased 13.7%, 4.4% and 10% in the first through third quarter of 2006, respectively. This has helped to offset the decline in residential investment of -.3, -11.1% and -18.7% over the same period. Total nonresidential investment -- which includes real estate and equipment/software expenditures -- accounted for 63.53% of total domestic investment in the third quarter of 2006. Finally, corporations have a ton of cash to spend. According to the Federal Reserve's Flow of Funds statement, corporate savings (undistributed corporate profits) have increased from $364 billion in the first quarter of 2005 to $516 billion in the third quarter of 2006. This is one of the reasons why we have seen so much M&A activity over the past few quarters; corporations have a ton of cash to spend.
So -- confident executives could mean that corporate investment picks up the pace to its early 2006 levels. This would help to offset the decline in residential investment, which the economy as a whole needs right now.
The Conference Board's index of chief executive confidence rose to 50 in the fourth quarter from 44 the previous three months, the independent New York research group reported yesterday. The third quarter reading marked the first time the index dropped below 50, which reflects more negative than positive responses, since the final three months of 2001.
Growth picked up last quarter as lower gasoline prices, unseasonably warm weather, and rising incomes drove consumer demand, helping temper concerns that a faltering housing market would spread to other areas of the economy. The index of the outlook for the next six months rose to 50 last quarter from 43, suggesting business leaders foresee continued expansion.
This could indicate an increase in corporate expenditures in the coming months which has shown some strength over 2006. According to the Bureau of Economic Analysis' NIPA tables, nonresidential fixed investment increased 13.7%, 4.4% and 10% in the first through third quarter of 2006, respectively. This has helped to offset the decline in residential investment of -.3, -11.1% and -18.7% over the same period. Total nonresidential investment -- which includes real estate and equipment/software expenditures -- accounted for 63.53% of total domestic investment in the third quarter of 2006. Finally, corporations have a ton of cash to spend. According to the Federal Reserve's Flow of Funds statement, corporate savings (undistributed corporate profits) have increased from $364 billion in the first quarter of 2005 to $516 billion in the third quarter of 2006. This is one of the reasons why we have seen so much M&A activity over the past few quarters; corporations have a ton of cash to spend.
So -- confident executives could mean that corporate investment picks up the pace to its early 2006 levels. This would help to offset the decline in residential investment, which the economy as a whole needs right now.
Tuesday, January 9, 2007
Late Credit Card Payments Increase
From the Houston Chronicle:
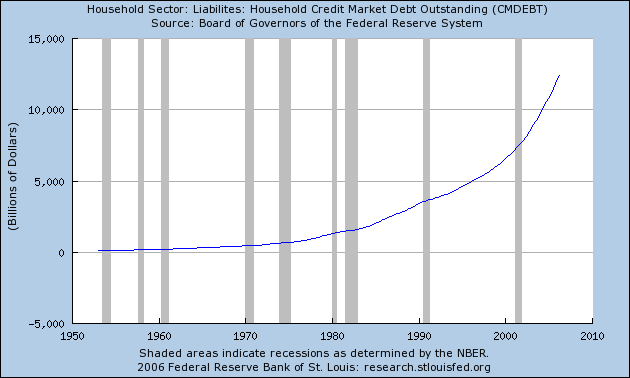
Household debt is a huge issue, especially in this recovery. Here is a chart from the St. Louis Fed of total household debt outstanding. Notice how the curve's steepness has increased during this expansion:
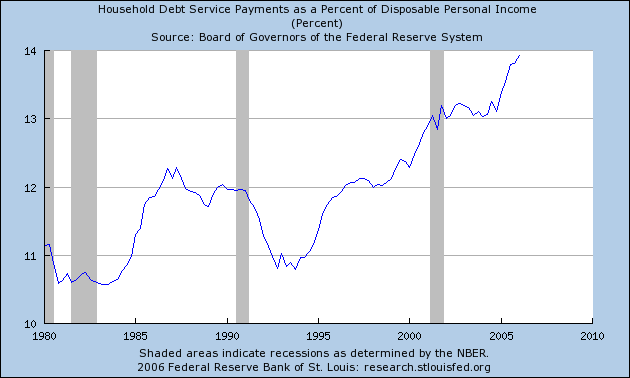
Also note that the household financial obligation ratio is now at record levels:
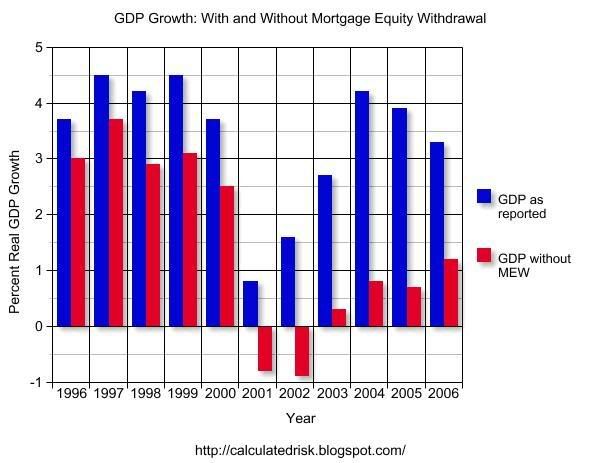
As Tula notes below, wages for this expansion have been stagnant for this expansion. The Big Picture noted that health cost increases are still eating a huge amount of pay raises in the form of higher deductibles and premiums. That leads to the question of, "where is the money for this expansion coming from?" Savings were already at low levels before this expansion began, consumer spending has increased for the duration of this expansion, yet wages for most people are still stagnant.
The answer is debt. Calculated Risk has this chart of GDP growth with and without Mortgage Equity Extraction:
That's a big difference.
As the bill continues to come due, expect this trend to continue.
Many thanks to the wonderful person who sent me the Houston Chronicle article.
Late payments on credit card bills climbed in the summer to their highest point in a year, suggesting that some consumers are feeling financially squeezed.
The American Bankers Association, in its quarterly survey of consumer loans, reported today that the percentage of credit card payments 30 or more days past due increased to 4.57 percent in the July-to-September quarter of last year.
That was up from 4.41 percent in the second quarter and was the highest since the third quarter of 2005, when the delinquency rate stood at 4.74 percent.
Household debt is a huge issue, especially in this recovery. Here is a chart from the St. Louis Fed of total household debt outstanding. Notice how the curve's steepness has increased during this expansion:
Also note that the household financial obligation ratio is now at record levels:
As Tula notes below, wages for this expansion have been stagnant for this expansion. The Big Picture noted that health cost increases are still eating a huge amount of pay raises in the form of higher deductibles and premiums. That leads to the question of, "where is the money for this expansion coming from?" Savings were already at low levels before this expansion began, consumer spending has increased for the duration of this expansion, yet wages for most people are still stagnant.
The answer is debt. Calculated Risk has this chart of GDP growth with and without Mortgage Equity Extraction:
That's a big difference.
As the bill continues to come due, expect this trend to continue.
Many thanks to the wonderful person who sent me the Houston Chronicle article.
Jobs and Wages Are Up. But There's More to the Story
So, the latest jobs report released Friday by the U.S. Bureau of Labor Statistics (BLS) showed more job growth than analysts anticipated, and you practically could hear the champagne corks go off at the White House. The same report that found jobs increased by 167,000 in December also reported that average hourly earnings rose 4.2 percent in December.
Must mean America’s workers are sitting pretty, right?
Unfortunately for the economy and U.S. workers, such short-term trends are misleading.
Looking at long-term wage growth, Jared Bernstein, senior economist for the nonprofit Economic Policy Institute (EPI), puts it this way:
In touting his economic policies in the months before the elections, Bush frequently referred to the 6.3 percent rise in the average net worth of an American family between 2001 and 2004, a statistic from the Federal Reserve Board’s Survey of Consumer Finances. But the law of averages here isn’t in favor of working families. For families at the bottom 40 percent of income, the median net worth actually fell.
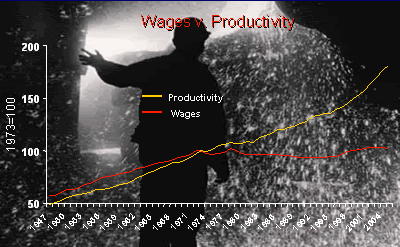
Another long-term trend is the separation of worker productivity from wage growth. Up to the early 1970s, the two grew together, with productivity 10 percent to 15 percent higher than wage growth. But since that time, workers have sped up their rates of productivity—but their employers have not similarly increased what they pay their employees. Wages now lag by more than 50 percent behind productivity.
Bob Herbert in his New York Times column yesterday highlighted the perversity of a system in which employees work harder but see no correlative increase in their paychecks—not the best incentive for long-term productivity and certainly no benefit to workers. Herbert sums it up this way:
Jobs are increasing in sectors such as service and health care that, for the most part, offer low wages and unaffordable or no health care and pension plans. Meanwhile, jobs in industries such as manufacturing are in free fall: Between 2000 and 2003, annual manufacturing employment in the United States declined by nearly 3 million jobs and has been largely flat since then. The level of manufacturing employment in 2003 was 14.3 million, the lowest since 1950. It’s easy to pooh-pooh manufacturing jobs as part of the “old economy,” but the fact is that manufacturing jobs provide solid salaries and health and retirement security rarely offered in the industries where we see rapid job growth.
And as Jacob Hacker has shown in The Great Risk Shift, the unemployment rates we hear about omit what Hacker calls “shadow unemployment,” which includes the length of time workers now are unemployed. Writes Hacker:
Must mean America’s workers are sitting pretty, right?
Unfortunately for the economy and U.S. workers, such short-term trends are misleading.
Looking at long-term wage growth, Jared Bernstein, senior economist for the nonprofit Economic Policy Institute (EPI), puts it this way:
Real wages for most workers, after rising for the first few years of the 2000s, have fallen lately, and despite 14 percent higher productivity, a typical worker’s real weekly earnings are down 3 percent over this expansion. Median family income is down about $1,500 since 2000, and more than 5 million people have been added to the poverty rolls.Wages and salaries today account for the smallest percentage of our gross domestic product on record, while corporate profits are at their highest level since the 1960s.
In touting his economic policies in the months before the elections, Bush frequently referred to the 6.3 percent rise in the average net worth of an American family between 2001 and 2004, a statistic from the Federal Reserve Board’s Survey of Consumer Finances. But the law of averages here isn’t in favor of working families. For families at the bottom 40 percent of income, the median net worth actually fell.
Another long-term trend is the separation of worker productivity from wage growth. Up to the early 1970s, the two grew together, with productivity 10 percent to 15 percent higher than wage growth. But since that time, workers have sped up their rates of productivity—but their employers have not similarly increased what they pay their employees. Wages now lag by more than 50 percent behind productivity.
Bob Herbert in his New York Times column yesterday highlighted the perversity of a system in which employees work harder but see no correlative increase in their paychecks—not the best incentive for long-term productivity and certainly no benefit to workers. Herbert sums it up this way:
The productivity gains in the go-go decades that followed World War II were broadly shared, and the result was a dramatic, sustained increase in the quality of life for most Americans. Nowadays workers have to be more productive just to maintain their economic status quo. Productivity gains are no longer broadly shared. They’re barely shared at all.Now, back to job growth. While the superficial BLS stats show the quantity of jobs created, behind that data a darker picture lurks—the quality of salary and benefit levels. What counts is not just the number of jobs created but how well those jobs provide a middle-class standard of living. (There’s a lot we can do about all this—and future posts will highlight elements of a populist economic agenda spearheaded by EPI that we in the progressive movement can rally behind in coming months.)
Jobs are increasing in sectors such as service and health care that, for the most part, offer low wages and unaffordable or no health care and pension plans. Meanwhile, jobs in industries such as manufacturing are in free fall: Between 2000 and 2003, annual manufacturing employment in the United States declined by nearly 3 million jobs and has been largely flat since then. The level of manufacturing employment in 2003 was 14.3 million, the lowest since 1950. It’s easy to pooh-pooh manufacturing jobs as part of the “old economy,” but the fact is that manufacturing jobs provide solid salaries and health and retirement security rarely offered in the industries where we see rapid job growth.
And as Jacob Hacker has shown in The Great Risk Shift, the unemployment rates we hear about omit what Hacker calls “shadow unemployment,” which includes the length of time workers now are unemployed. Writes Hacker:
Statistics on the long-term unemployed tell an equally worrisome story. Despite the sunny job statistics that most of us are familiar with, the share of the labor force experiencing unemployment for a half year or more—the standard definition of long-term unemployment—has in fact grown dramatically over the last generation. Indeed, compared with the late 1960s, the share of workers who experience long-term unemployment during the peak of the business cycle has more than tripled.Short-term upticks won’t solve these long-term problems, and they won’t go very far to help working families dig out of debt and pay their mortgages on time. As Bonddad reported in December:
The Mortgage Bankers Association, in its quarterly snapshot of the mortgage market released Wednesday, reported that the percentage of mortgage payments that were 30 or more days past due for all loans tracked jumped to 4.67 percent in the July-to-September quarter.A recent Center for American Progress report showed the nation’s middle class is in worse shape than ever. Some of the report’s findings:
That marked a sharp rise from the second quarter’s delinquency rate of 4.39 percent and was the worst showing since the final quarter of last year, when delinquent payments climbed to a 2-1/2-year high in the aftermath of the devastating Gulf Coast hurricanes.
- From 2001 to 2004, the proportion of middle-class families that has saved three months’ worth of income dropped to 18.3 percent from 28.8 percent.
- To maintain day-to-day consumption, families have taken on a record amount of debt, equal to 126.4 percent of disposable income in the first quarter of 2006, according to the study.
Among the total electorate, 39 percent of voters said the economy was an extremely important issue for them in this election. These voters broke solidly for the Democrats—voting for a Democratic candidate in House races by a margin of 59 percent to 39 percent.Or, as economist Paul Krugman says:
The reason most Americans think the economy is fair to poor is simple: For most Americans, it really is fair to poor.It’s been the pattern of the Bush administration to cherry-pick a few good stats to plump up its failed economic policies. But short-term data seldom work to describe long-term trends—and certainly don’t describe working families’ day-to-day reality of trying to pay the bills.
Labels:
consumer debt,
job growth,
labor,
productivity,
unemployment,
unions,
wage growth
Payroll Employment and Recessions
The current employment picture is of the main arguments bolstering the soft-landing pundits. So, let's look at the history of employment to see what the establishment jobs market can tell us about a a possible recession. All of the charts below are from the St. Louis Fed's FRED system.
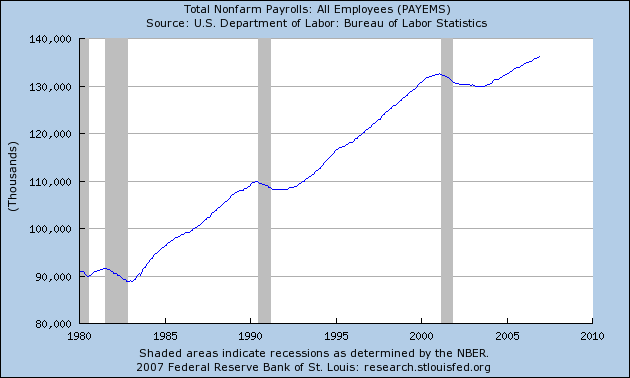
Here is a chart of total establishment jobs.
Notice that establishment jobs continue to increase until right each recession began. This indicates that monthly increases are not necessarily predictive of a continued expansion; job increases can occur right up until the beginning of a recession.
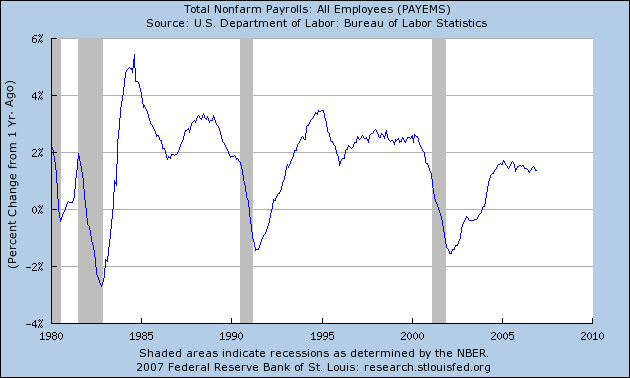
Here is a chart of year-over-year percent change:
This chart gives us something more to work with. Notice how the YOY percent change dropped noticeably before the beginning of the last two recessions. Also note we haven't had a drop of similar magnitude during this expansion. That adds some strength to the soft-landing pundit's arguments.
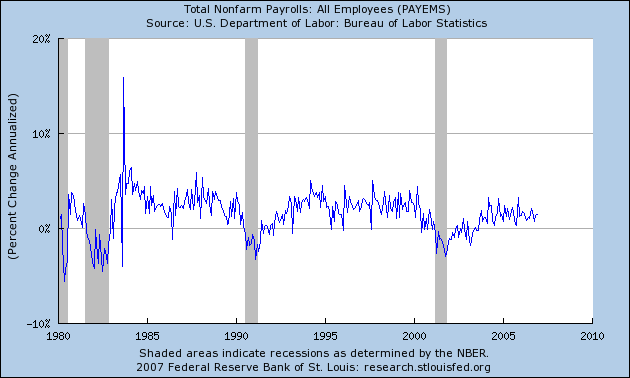
Here is a chart of the percent change annualized rate of change:
This chart has a lot of statistical noise, so it is not as solid as a predictor. However, notice that before the last two recessions, the annualized percent change hit 0%. But also notice that several times the line hit 0% and the economy didn't hit a recession. That makes this particular economic number pretty soft.
So, what do we know now that we didn't know when we started? That year-over-year percent change in establishment payrolls is probably the best employment predictor of recessions; it has dropped sharply before two of the last three recessions. In addition, this chart was last updated on January 5 when the 167,000 payrolls number came out. That means according to this statistic we aren't near a recession yet.
It's important to remember that hiring is an incredibly important business decision -- perhaps one of the most important decisions a business makes. That makes these numbers very important.
It's also important to remember there is no economic holy grail.
Monday, January 8, 2007
Fed Governor Kohn's Remarks on the Economy
Uncertainty about where we stand in the housing cycle remains considerable. In part, that is because this housing downturn has differed from some of those in the past in important ways. It was not triggered by a restrictive monetary policy and high interest rates; indeed, relatively low intermediate and long-term interest rates are helping to support the stabilization of this sector. But the current contraction in housing did follow an unusually large run-up in sales and construction and, even more so, in prices relative to the returns on other financial and real assets. Our uncertainty about what pushed home prices and sales to those elevated levels raises questions about how the market will adjust now that expectations of the rate of house price appreciation are being trimmed. And changes in the organization of the construction industry, with activity more concentrated in the hands of large, publicly traded corporations, may also affect the dynamics of prices and activity in response to the inventory overhang.
In my own judgment, housing starts may be not very far from their trough, but the risks around this outlook still are largely to the downside. Although house prices nationally have decelerated noticeably and appear to have fallen in some markets, they are still high relative to rents and interest rates. Building permits decreased substantially again in November, and inventories of unsold homes have only started to edge lower. We also do not know whether the possible stabilization that seems to be taking hold would be immune to a rise in longer-term interest rates should term premiums increase or the federal funds rate fail to follow the downward path currently built into market expectations. Even if starts stabilize at close to current levels, those levels are sufficiently low that overall construction activity would remain a negative for the growth of economic activity in the first half of this year.
While the downturn in housing was steepening during the third and fourth quarters, domestic producers of cars and light trucks slashed output in an effort to reduce their elevated inventories, particularly of light trucks (minivans, SUVs, and pickups). In October, light motor vehicles were assembled at the slowest pace in more than eight years. However, production rebounded in the final two months of the year, and, with inventories having come down from their highs last summer, available monthly schedules suggest that vehicle manufacturers anticipate maintaining the pace of assemblies during the first quarter at about the average rate in November and December. Thus, with sales reasonably well maintained through December, the drag from this sector's inventory correction should be ending.
1.) Note Kohn's statements about the housing market imply a bubble exists. He stated that interest rate increases were not the primary cause of the correction. Instead, home price increases, ran up higher "in prices relative to the returns on other financial and real assets." He next states there is uncertainly about what sent prices up. This statement is a bit baffling coming from an economist. When the Fed lowers rates to the lowest level seen in a generation, demand will increase. That's simple supply and demand in action.
2.) "but the risks around this outlook still are largely to the downside". That's not a very encouraging statement, but I believe it is very accurate. Inventories are high, sales are low and household debt is at an all-time high. Short version: there's a ton of supply on the market and buyers are dwindling.
3.) He notes that domestic car dealers cut back production in the fall but has since rebounded. This is what happens when car dealers rely on large, gas-guzzlers as their primary source of revenue during a period of increasing has price.
On inflation:
So, despite the recent favorable price data, I believe it is still too early to relax our concerns about whether the run-up in price pressures in the spring and summer of last year is truly unwinding and whether it is unwinding rapidly enough to forestall a pickup in inflation expectations. Even with the opening of some slack in the manufacturing sector and in homebuilding, labor markets generally seem to have stayed fairly tight, with the unemployment rate at only 4-1/2 percent. Although recent data indicate that labor costs were not rising as rapidly in 2006 as first estimated, labor compensation does appear to have increased more quickly over 2006 than over 2005. Last year's increase in compensation also appears to have outpaced overall consumer price inflation. That development in and of itself does not necessarily indicate an increase in inflationary pressures, especially if it represents a process in which real compensation begins to catch up with the rapid increases in labor productivity earlier this decade. What would be problematic would be a pickup in the growth of nominal hourly labor compensation that was passed through to prices over the next several quarters, or one that was not matched, over a sustained period, by a comparable pickup in the growth of productivity. Eventually, the resulting faster growth of unit labor costs would pose a serious threat to price stability.
Core inflation is still higher than it was just a year ago, and, as I noted, some of the very recent decline may result from one-time changes in relative prices rather than an easing in underlying inflation pressures. A very gradual decline in the trend rate of inflation continues to be the most likely outcome, but that path is still by no means assured, and in my judgment such a decline remains critically important to the sustained prosperity of the U.S. economy.
Translation: We're not lowering rates anytime soon if I have anything to say about it.
He concludes:
In sum, conditions appear to be in place for a good year for the U.S. economy, one marked by growth that is moderate and sustainable and by inflation that will be lower than last year's. The economy appears to be weathering the downturn in housing with limited collateral effects, and inflation appears to be easing with the aid of lower energy prices, well-anchored inflation expectations, and competitive labor and product markets. I am a central banker to my core, so I know that somewhere, somehow, something will go wrong, but you will have to rely on the new president of the Federal Reserve Bank of Atlanta to explain to you next January just what happened and what the implications are for 2008.
I found his speech to directly contradict his conclusion. He mentions that housing's most likely direction is downward. He notes that several regional manufacturing surveys have showed weakness. He notes that future manufacturing expectations are bullish, but it's hard to see people answering a future expectations negatively unless the economy is already in a recession. Inflation is down because of one-time events. There were a ton of negatives in his speech that are difficult to ignore.
Here's a link to the speech. Let me know what you think.
New Floor on Oil Prices?
Oil prices rose Monday, supported by reports that OPEC oil ministers have begun talks on another potential cut and worries about energy shortages in parts of Europe as the fallout of a dispute between Russia and Belarus.
The rebound came after last week's plunge amid a warmer-than-normal winter in the U.S. Northeast, a key region for heating oil demand.
Russia's Interfax news agency reported that Belarus had ordered a halt to deliveries of Russian oil that goes via its territory to Germany, Poland and Ukraine.
The head of the Russian state pipeline operator Transneft, Semyon Vainshtok accused Belarus of siphoning off Russian oil destined for Europe since Saturday, the RIA-Novosti news agency reported.
OPEC is notoriously undisciplined, so any news about a production cut has to be taken with a grain of salt. However, this is the third time in the last 6 months we have heard about OPEC looking to cut production in some way.
I should also add that the latest oil price drop coincided with another "rebalancing" of a Goldman Sachs commodities index.
I can't speak to the geo-political situation in Eastern Europe. However, it may provide a short-term bump in prices.
Link
Sunday, January 7, 2007
The Week Ahead
Next week is a light data week. The international trade position comes out on Wednesday. I would expect this to drop a bit, especially as oil has dropped in price. The import/export price index comes out on Friday.
Finally, we get retail sales on Friday as well. This should be interesting. Last month's number raised eyebrows with its 1% gain. I was extremely skeptical of this number, largely because all of the other retail numbers that came out at that time were nowhere near that good. I'm curious to see if the Census Bureau lowers that number.
There have been a ton of large deals over the last few months that have fueled the market higher. If we see some more of this large M&A activity I would expect the market to continue higher. However, we'll be bumping up against the interest rate environment as the market moves higher.
More Thoughts on Last Week's Market Action
From the Street.Com
Let's put the market on the couch to see what it is thinking.
As the chart's below illustrate, the S&P, NASDAQ and Russell 2000 were all either in a trading pattern (SPYs and IWMs) or had actually sold-off a bit (QQQQs) over the last few weeks/months. Trading patterns mean supply and demand are near equal in the market; there is no reason for buy aggressively, but no reason to sell. So the markets have been waiting for something to happen. The question is, "what are they waiting for?"
The general consensus is the markets are waiting for a clear sign regarding interest rates. The economy slowed do 2.2% growth in Q3, indicating the possibility of a Fed rate hike is a bit higher. At the same time, most market prognosticators have been noting that corporate earnings -- which have done very well this expansion -- would have to come down a bit in a slower growth environment. Putting these two strains together, it seems the markets are waiting for the first signs of either slowing corporate growth to sell or a firm indication on the direction of interest rates.
While the Fed won't come right out and say, "we're not going to raise/lower rates until x," the latest FOMC minutes were pretty clear:
That's about as clear as you're going to get from the Fed. Friday's employment number was strong for the current expansion (+167,000). In my opinion, it pretty much knocked the idea of a rate cut back or even off the table for at least awhile.
In short, right now the market's don't have a strong reason to buy based on the idea of interest rates going lower.
At the same time, we have not moved into first quarter earnings season yet. So, we don't have a reason to sell yet based on declining corporate earnings. That means heavy selling action will probably be tempered with some hope for one last quarter of good corporate results.
So -- the market appears to be very nervous about the future, but unwilling to commit in either direction -- at least not yet. That could all change at a moments notice.
Investors' repositioning for the new year collided with interest rate fears to kick off 2007 with trepidation and anxiety running through the financial markets, with the notable exception of tech and biotech stocks.
Friday's stronger-than-expected jobs number forces the markets to wrap their arms around the idea that a recession is unlikely, and that is a relief. But they also need to embrace that the Federal Reserve is not opening the door to rate cuts anytime soon, and that is disappointing to many investors.
The minutes from December's FOMC meeting, released Wednesday were, in sum, hawkish in that the Fed maintained a bias toward tightening amid concern about inflation. That wasn't a big surprise, but an early morning rally reversed when traders realized the central bank was not discussing a move to a more neutral policy stance.
Friday's stronger-than-expected 167,000 non-farm payrolls report was a surprise, given payroll processor ADP's earlier employment forecast of 40,000 jobs lost in the month. To cut rates, the Fed would need to see some softening in the labor market to mark a true slowdown in the economy.
Let's put the market on the couch to see what it is thinking.
As the chart's below illustrate, the S&P, NASDAQ and Russell 2000 were all either in a trading pattern (SPYs and IWMs) or had actually sold-off a bit (QQQQs) over the last few weeks/months. Trading patterns mean supply and demand are near equal in the market; there is no reason for buy aggressively, but no reason to sell. So the markets have been waiting for something to happen. The question is, "what are they waiting for?"
The general consensus is the markets are waiting for a clear sign regarding interest rates. The economy slowed do 2.2% growth in Q3, indicating the possibility of a Fed rate hike is a bit higher. At the same time, most market prognosticators have been noting that corporate earnings -- which have done very well this expansion -- would have to come down a bit in a slower growth environment. Putting these two strains together, it seems the markets are waiting for the first signs of either slowing corporate growth to sell or a firm indication on the direction of interest rates.
While the Fed won't come right out and say, "we're not going to raise/lower rates until x," the latest FOMC minutes were pretty clear:
All meeting participants remained concerned about the outlook for inflation. Although readings on core inflation had improved modestly since the spring, nearly all participants viewed core inflation as uncomfortably high and stressed the importance of further moderation. Participants expected core inflation to edge lower over time, in part as the pass-through of higher prices for energy and other commodities ran its course and as the moderate growth in aggregate demand likely led to a modest easing of pressures on resources. Some participants also highlighted the impact that movements in the prices of individual components of the price index, such as owners' equivalent rent and medical costs, could have on near-term readings on core inflation. More generally, participants stressed there was considerable uncertainty as to the probable pace and extent of the moderation in core inflation and that the risks around this desired downward path remained to the upside. Moreover, participants expressed concern that a failure of inflation to moderate as expected could entail significant costs if an upward drift in inflation expectations ensued.
That's about as clear as you're going to get from the Fed. Friday's employment number was strong for the current expansion (+167,000). In my opinion, it pretty much knocked the idea of a rate cut back or even off the table for at least awhile.
In short, right now the market's don't have a strong reason to buy based on the idea of interest rates going lower.
At the same time, we have not moved into first quarter earnings season yet. So, we don't have a reason to sell yet based on declining corporate earnings. That means heavy selling action will probably be tempered with some hope for one last quarter of good corporate results.
So -- the market appears to be very nervous about the future, but unwilling to commit in either direction -- at least not yet. That could all change at a moments notice.
Subscribe to:
Posts (Atom)