Saturday, February 27, 2021

Weekly Indicators for February 22 - 26 at Seeking Alpha


 - by New Deal democrat

My Weekly Indicators post is up at Seeking Alpha.

After months of virtually no changes in any of the time frames, suddenly there is activity in all of them. Some of it is short term noise due to the disaster in Texas, some is related to the pace and effects of vaccination availability against COVID-19, and some of it is the resulting change in long term interest rates.

As usual, clicking over and reading will bring you up to the virtual moment about the economy, and will bring me a penny or so for my troubles.

Friday, February 26, 2021

January personal income and spending show how important government stimulus has been to keeping the economy afloat


 - by New Deal democrat

This morning’s report on January personal income and spending shows just how important the stimulus packages enacted by the federal government both last spring and last month have been to sustaining the economy.


After adjusting for inflation both personal income and spending rose in January, by +9.7% and +2.0%, respectively:


The huge increase in income is not a mistake. It follows from the renewed Congressional stimulus package providing $600 checks to most households. And it’s pretty obvious that had an impact on spending, which rose to levels equivalent to 2019 and only about 2% off peak.

The importance of the stimulus is shown dramatically when we subtract government transfer receipts from the equation, shown in red in the graph below:


Real personal income excluding government transfer receipts fell for the third month in a row, down -0.5% in January.

Since this last metric is the last of the four coincident metrics to be reported for January, we can now plot the general outline of the economy through last month, including production (blue), jobs (red), real retail sales (green), and real income (purple):


Industrial production has powered through the last 9 months and is now only -1.8% below its level last February. Real sales are actually higher by 6.4%. Job growth has generally stalled in the last 3 months, but only declined outright in the month of December. But without transfer receipts from government, income is down -2.8% since last February.

*IF* we continue to make good progress with vaccinations, and they prove effective against the new variants of covid-19 as well as the original virus, then by mid-year we could see production higher than before the recession, most likely leading the NBER to declare that the recession was a brief but very deep two month affair (last March and April) with a one year+ recovery which is turning into a full-fledged expansion.

Thursday, February 25, 2021

Initial jobless claims: it appears that the worst of the winter 2020-21 increase is behind us


 - by New Deal democrat

Let me start off this week’s review of initial jobless claims by pre-debunking something I am sure is going to be said elsewhere: a lack of reporting in Texas did *not* appreciably skew this week’s numbers. Applying the same workaround I did for Hurricanes Sandy and Harvey, I.e., subtracting the affected State’s data from the unadjusted number, to see how much it is at variance with all the other States, shows that Texas’s underreporting due to its electricity crisis was less than 20,000 at worst in a week with little seasonal adjustment. In other words, being very generous, the “real” seasonally adjusted number of initial claims at worst probably would have been only about 30,000 higher - I.e., 760,000 - but for Texas issues.

Additionally, last week’s nationwide numbers were actually revised *down* by 20,000, unlike the two prior weeks which saw very large upward revisions.

With those two introductory remarks out of the way, let’s look at the data. 

This week, on a unadjusted basis, new jobless claims declined by 131,734 to 710,313. Seasonally adjusted claims decreased by 111,000 to 730,000. The 4 week moving average declined by 20,500 to 807,250. 

Here is the close up since the end of July (these numbers were in the range of 5 to 7 million at their worst in early April): 

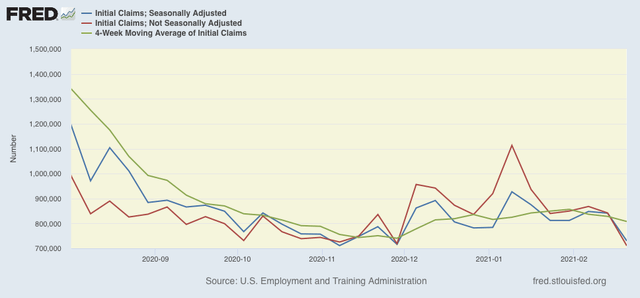
The good news is that recent increases seem to have plateaued. Nevertheless both adjusted and unadjusted claims remain above their worst levels at the depths of the Great Recession.

Because of the huge swings caused by the scale of the pandemic - typically claims only vary by 20,000 or less from week to week, but since the start of the pandemic, swings of 50,000 or 100,000 per week have happened as often as not, recently I began posting the YoY% change in the numbers as well, since they will be much less affected by scale. As a result, there is less noise in the numbers, and the trend can be seen more clearly:

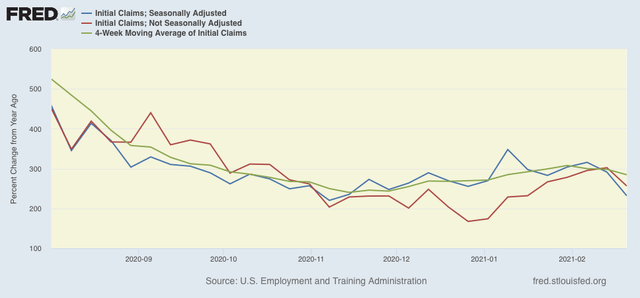
The recent elevation in new claims compared with their November lows is clear. As of this week, it also appears clear, especially in the 4 week average,  that claims have plateaued. As spring begins in the warmer parts of the country, we can expect increased outdoor activity and a relative recovery in employment servicing those activities.


Meanwhile continuing claims, which historically lag initial claims typically by a few weeks to several months, made new pandemic lows yet again this week. Seasonally adjusted continuing claims declined by 101,000 to 4,419,000, while the unadjusted number declined by 143,320 to 4,828,027:


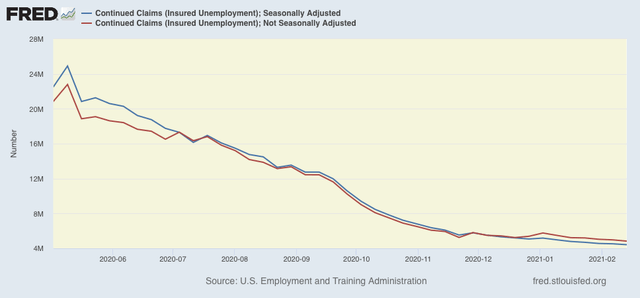
I had suspected that we would see an upward reversal, but obviously that did not happen. Continued claims remain at levels last seen in autumn 2009, only a few months after the Great Recession.

I continue to expect that the onset of better weather in spring (fewer indoor activities) and more vaccinations will mean that we have finally put the worst of the job losses behind us. 

Wednesday, February 24, 2021

New home sales rise m/m, but signal caution for housing market going forward


 - by New Deal democrat

New home sales increased to a three month annualized high of 923,000 in January. This is of a piece with the positive news last week on housing permits. At the same time, the pace remains below the recent high of 979,000 annualized set six months ago in July. The below graph compares housing starts (blue) with the much less volatile single family permits (red) and the even more volatile, and heavily revised, new home sales (gold), normalized to 100 as of January 2020:


The reason to pay attention to new home sales is that, despite their volatility, they tend to peak and bottom before any other housing metric including permits and starts. So the fact that they have not made a new high in 6 months adds a note of caution to the otherwise sizzling housing market.

New home sales also tend to be more responsive to changes in mortgage rates.  Recently these have begun to increase, following longer term US treasury rates (shown inverted YoY% change) higher:


Note that in 2014, when mortgage rates rose by about 1%, permits never declined significantly YoY. But new home sales did.

If interest rates plateau, or continue to rise, this is the first yellow flag that permits and starts may stall as well - and, based on historical trends, will do so while home prices are still rising.

Tuesday, February 23, 2021

Coronavirus dashboard for February 23: vaccinations start to have a dramatic effect


 - by New Deal democrat

Total US coronavirus deaths: 500,310

Total US confirmed infections: 28,190,159

Total US vaccinated (at least 1 dose): 44,138,118
Total US vaccinated (both doses): 19,438,495

The good news is, roughly 9.5% of the US population age 18 or over has received both doses of a vaccine. Over 20% has received at least one dose.

The bad news is that we have reached the milestone of half a million dead. Further, probably at least 40,000,000 people have been infected, since many who have no or mild symptoms don’t ever get tested.

Here’s the graph of the 7 day average of new infections and deaths for the US over the last 12 weeks:


While there has been a decline of over 2/3’s in infections, and 40% in deaths, this only puts us even with the very worst levels of the summer outbreak.

But there is increasingly dramatic evidence that the vaccines are having a real impact. Since the elderly in long term care facilities were the first to be vaccinated, that is where we would first expect to see an impact. And here it is, graphically:


New infections have declined by nearly 90% in these facilities since vaccinations began, and are lower than they have been since at least 8 months ago.

Here is a similar graph from one week ago, showing the percent of all coronavirus cases that arose from long term care facilities:


The share of total cases declined by 50%. But since, over the same time span, *total* cases themselves declined 50%, that means that the total number of cases in long term care facilities declined by roughly 75%!

The situation is similar in bellwether Israel, which has delivered doses equivalent to about 80% of its total population since December. Deaths are down over 60%:


And when those who have been vaccinated are compared with those in similar situations who have not been vaccinated, the outcome is even more dramatic:


The 7 day average of those who were vaccinated declined by about 2/3’s, while the decline among those not vaccinated was only 10%.

There is simply no reasonable doubt that, as matters now stand, the vaccines are going to be very effective, probably by the Fourth of July, in nearly halting deaths due to the virus in the US - and that includes the new variant strains.


Monday, February 22, 2021

You’re reading the right blog: 2021 economy edition


 - by New Deal democrat

“You’re reading the right blog” is an old chestnut (for me anyway) that I used to say from time to time to highlight a correct forecast that your (not so?) humble blogger made well in advance of more widely read sources.


Well, please bear with me for one more self-pat on the back.

For at least 6 months, I have been saying that the economy was poised to pick up strongly in 2021 once the pandemic loosened its grip. Most recently I repeated that in my short term and long term forecasts for 2021 over at Seeking Alpha.

And this morning, January’s index of leading indicators came in at plus 0.3%, the 9th positive reading in a row:


If the next 3 months are simply unchanged, the YoY comparison is going to be the most positive in two decades.

Meanwhile, as Bill McBride has pointed out, both public and Wall Street forecasts for q/q Q1 GDP are, well, through the roof:

Merrill Lynch: 5.5%
Goldman Sachs: 6.0%
NY Fed nowcast: 8.3%
Atlanta Fed GDP now: 9.5%

(Note: all forecasts SAAR)

The only other times in the past 75 years when the q/q change has been this high were in 1950 and 1978, plus the Q3 rebound last year from the Q2 lockdowns:


So, ... ahem ... you’ve been reading the right blog.