See you on Tuesday, not Monday.


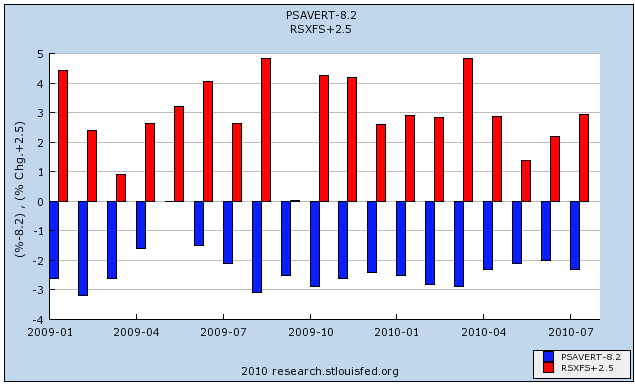
Month in and month out we hear the same nonsense about retail sales. I will believe it when I see state sales tax collections support the claims.Unfortunately for Mish's claim, checking state sales tax collection reports showed that in the second quarter almost all of them were increasing!
....
states have been reporting declining sales tax collections for the entire year.
Sales tax collections increased by 5.9 percent in the second quarter of 2010 compared to the same quarter of 2009, but were still 5.4 percent lower than two years ago. With 42 of 45 sales-tax states reporting so far, only seven states reported declines in sales tax collections compared with the same quarter last year.To which Mish replied (without any reference to supporting data):
Much of the improvement in sales taxes is a result of tax hikes, not increased sales. Those effects will soon wear off in year-over-year comparisonsNote btw that Mish doesn't say tax increases are responsible for all of the improvement, just an undefined "much" of it.
The change in total nonfarm payroll employment for June was revised from -221,000 to -175,000, and the change for July was revised from -131,000 to -54,000.
Nonfarm payroll employment changed little (-54,000) in August, and the unemployment rate was about unchanged at 9.6 percent, the U.S. Bureau of LaborStatistics reported today. Government employment fell, as 114,000 temporaryworkers hired for the decennial census completed their work. Private-sector payroll employment continued to trend up modestly (+67,000)


Insured institutions added $40.3 billion in provisions to their loan-loss allowances in the second quarter. While still high by historic standards, this is the smallest total since the industry set aside $37.2 billion in first quarter 2008 and is $27.1 billion (40.2 percent) less than the industry’s provisions in second quarter 2009. Fewer than half of all institutions (41.3 percent) reported year-over-year reductions in quarterly loss provisions. Only 40 percent of community banks (institutions with less than $1 billion in assets) reported year-over-year declines. Reductions were more prevalent among larger institutions. More than half (56.2 percent) of institutions with assets greater than $1 billion had lower provisions in the second quarter.
Net charge-offs totaled $49 billion in the second quarter, a $214-million (0.4 percent) decline from a year earlier and the first year-over-year decline since fourth quarter 2006. Charge-offs were lower than a year ago in most major loan categories except for credit cards and real estate loans secured by nonfarm nonresidential properties. Charge-offs on loans to commercial and industrial (C&I) borrowers were $3.1 billion (37.0 percent) lower than a year ago, while charge-offs on real estate construction and development (C&D) loans were $2.7 billion (34.6 percent) lower. Charge-offs of one-to-four family residential mortgage loans were down by $1.4 billion (16.0 percent). Credit card charge-offs were $8.6 billion (86 percent) higher than in second quarter 2009. Most, if not all, of this increase was attributable to the inclusion of charge-offs on securitized credit card balances, which were not included in reported charge-offs in previous years. The change in reporting was the result of the application of FASB 166 and 167. In contrast, the $1.8 billion (107.2 percent) year-over-year increase in charge-offs of nonfarm nonresidential real estate loans reflected further deterioration in commercial real estate portfolios. Almost half (49.1 percent) of insured institutions with more than $1 billion in assets reported lower net charge-offs, while only 43.6 percent of community banks reported year-over-year declines.
The amount of loans and leases that were noncurrent (90 days or more past due or in nonaccrual status) declined by $19.6 billion (4.8 percent) during the second quarter. This is the first quarterly decline in noncurrent loans since first quarter 2006. Noncurrent levels declined in most major loan categories during the quarter. The sole exception was nonfarm nonresidential real estate loans, where noncurrents increased by $547 million (1.2 percent), the smallest quarterly increase in three years. The largest reduction in noncurrent loans in the quarter occurred in real estate C&D loans, where noncurrents fell by $5.9 billion (8.3 percent). This is the third consecutive quarter that noncurrent C&D loans have declined. Noncurrent C&I loans also declined for a third straight quarter, falling by $2.7 billion (7.3 percent), while noncurrent residential mortgage loans declined by $4.7 billion (2.5 percent) and noncurrent credit cards fell by $4.2 billion (19 percent). Slightly fewer than half of all institutions (48.9 percent) reported declines in their noncurrent loan balances during the quarter. Noncurrent loan balances fell by 5.3 percent at institutions with more than $1 billion in assets and rose by 0.3 percent at community banks.
Total loan-loss reserves of insured institutions fell for the first time since fourth quarter 2006, declining by $11.8 billion (4.5 percent), as net charge-offs of $49 billion exceeded loss provisions of $40.3 billion. Almost two out of three institutions (61.7 percent) increased their loss reserves in the second quarter, but a number of large banks reduced their loss provisions, producing net declines in their reserve balances. In particular, some institutions that converted equity capital into reserves in the first quarter in accordance with the requirements of FASB 166 and 167 reported lower provisioning in the second quarter. Although the industry’s ratio of reserves to total loans fell from 3.50 percent to 3.40 percent during the quarter, it is still the second-highest level for this ratio in the 63 years for which data are available. The industry’s “coverage ratio” of reserves to noncurrent loans improved for a second consecutive quarter, from 64.9 percent to 65.1 percent, as the reduction in noncurrent loans slightly outpaced the decline in loss reserves.
 Notice the pace of quarterly charge-offs appears to be topping -- we've seen more or less the same level for the last 5 quarters.

 Non-current rates on residential mortgages appear to be topping, although at high rates.
 These levels are sky high.


Reductions in loan-loss provisions underscored improvement in asset quality indicators during second quarter 2010. The industry’s quarterly earnings of $21.6 billion are up dramatically from the year-ago loss of $4.4 billion and represent the highest quarterly earnings since third quarter 2007. Almost two out of three institutions (65.5 percent) reported higher year-over-year quarterly net income. The proportion of institutions reporting quarterly net losses remained high at 20 percent but was down from more than 29 percent a year earlier.
Net interest income was $8.5 billion (8.6 percent) higher than a year ago, as more than 70 percent of all institutions reported year-over-year increases. Net interest margins at almost 60 percent of institutions (58.6 percent) improved from a year earlier, as average funding costs fell more rapidly than average asset yields. The magnitude of the increase in net interest income was largely attributable to the application of Financial Accounting Standards Board (FASB) Statements 166 and 167 in 2010 at a small number of institutions with significant levels of securitized consumer loans; among other things, the new rules require that revenues from securitized loan pools that had previously been included in noninterest income be reflected in net interest income.1


Four years ago, the monthly payment on a $300,000 house with 20 percent down and a mortgage rate of about 6.6 percent was $1,533. Today that $300,000 house would sell for $213,000 and a 30-year fixed-rate mortgage with 20 percent down would carry a rate of about 4.2 percent and a monthly payment of $833. In addition, the down payment would be $42,600 instead of $60,000....
[H]ousing has perhaps never been a better bargain, and sooner or later buyers will regain faith, inventories will shrink to reasonable levels, prices will rise and we’ll even start building again.I suspect that as to sales, housing is bottoming right now (could we get lower sales figures during the winter, sure). As to prices, it probably has a couple more years to go on a nationwide basis, as the price to income ratio is still above its long-term norm.


 Copper had a strong break out, starting in the Asian markets (A). Prices moved through resistance (B), then consolidated their gains before the US open (C). Prices moved higher again, moving through resistance (D) and then consolidated again (E).
Chicago purchasers report solid but slower month-to-month growth in August. The Chicago purchasers' index came in at 56.7, down sizably from 62.3 in July but still well above breakeven 50. New orders rose in the month, at an index of 55.0 but down from July's 64.6 for the slowest reading of the year. In an offset, backlogs, at 56.2, show a very strong gain for the month. Inventories are a negative, down more than four points to 46.5 to signal month-to-month contraction. But given solid shipping activity, some of this draw likely reflects production needs. Other readings indicate solid activity including greater slowing in deliveries and steady a month-to-month increase for employment.
The thing to remember with diffusion indexes is that lower readings are not necessarily a disaster. The readings in this report are holding well above 50 to indicate continued growth underway for the Chicago economy. The data point to favorable though slowing readings for tomorrow's ISM report on the manufacturing sector and Friday's ISM report on the non-manufacturing sector.

My original "Leading Employment Index" relied on an ISM manufacturing reading above 53. We can tweak that in a manner consistent with both above graphs by insisting on the following as a prerequisite to job growth:ISM non manufacturing has been hovering near 54 in the last couple of months, and the ISM non manufacturing employment sub-index has been at or below 50. That report won't be released until after the BLS report. With ISM manufacturing strong, Challenger strong, and ADP weak, we have a picture very much like the end of last year.
both [ISM manufacturing and non manufacturing] indexes be above 52 and average 53 or higher as a final signal, which gives one or two months' lead time to job growth.
“Nearly one in four construction workers is unemployed and nearly one in four bridges in the region are structurally deficient or functionally obsolete,” Mr Frye said.“We have workers. We have work that needs to be done. What we’re missing is a commitment from Washington to invest in building our country, our state and our workforce.”
According to the BLS, the height of establishment jobs for the last expansion occurred in December of 2007 when there were 137,951,000 establishment jobs. According to the last jobs report, there were 130,242,000, bringing the total number of lost jobs to 7,709,000. Here is a chart of the data:

The construction industry has been hard hit by the recession -- which you would expect coming off of a housing bubble. Total construction employment reached its peak in August 2006 with a total of 7,725,000 construction jobs. The latest employment report showed this total to be 5,573,000 for a total loss of 2,152,000 or 27.91% of all job losses. Here is a chart of the data:

Manufacturing has also been hard-hit by this recession. I think you can guess where I'm going here, so I'll just eyeball the following chart of total manufacturing employment:

Let's call that 2.1 million jobs since roughly the end of 2007, or about 27% of all jobs lost.
So, blue collar jobs lost total over 50% of all job losses during the recession. So, why don't we allocate, say, $500 billion to infrastructure investment and get these people back to work? Make the projects long-term so infrastructure employment will last until private demand takes over in 3-5 years.
Was that so hard?
No need to thank me, Washington, just stop acting like jackasses.


 Yesterday, oil prices took a big tumble, consolidating in a triangle pattern at the beginning of trading (A) and then falling for most of the rest of the day, rising to consolidate losses and find resistance at the EMAs several times (B and C). Prices eventually hit bottom at point (D).
 Once again, oil prices are looking for support in the lower 70's area (A).

 First, note that PCE expenditures are broken down into services, non-durable and durable expenditures.
 Services is the largest area of expenditures, accounting for 65% of PCEs. The three largest areas of service expenditures are housing, health care and "other".
 After the "other" category in the non-durable category, we see that food, clothing and energy are the largest expenditures of the non-durable category.
 And in the durable goods category, we see that recreational goods (think really big toys), cars and furnishings are the biggest components.