Today is Good Friday and the markets are closed. As I mentioned last week my schedule is very busy right now. I'm getting married in May, the future Mr$. Bonddad and I are looking for a house and I am in graduate school for international taxation. So I'm taking the weekends off through at least May.
Have a good weekend and I will be back bright and early on Monday.
Friday, March 21, 2008
Thursday, March 20, 2008
Today's Markets
The markets had a decent day. Although they opened lower, they continued to move higher for the rest of the day and ended on a high note.
Looking at the daily/SMA picture we get something a bit different.
The QQQQs are locked in tight with their SMAs with everything about even right now. In other words, traders are looking for a direction for the market to go.
With the SPYs and the IWMS notice:
-- The SMAs are all moving lower
-- The shorter SMAs are below the longer SMAs
-- Prices are right between the 10 and 20 SMAs
Also note that prices -- with the exception of a drop down 4 days ago -- have been in an incredibly tight range for about a week or so.
Why Transports Matter
From the WSJ:
Simply put, the transports are a great way to keep track of how the economy is doing. If it's going well, people will have to ship more and more stuff from point A to point B. If things aren't going well, people will be shipping less stuff from point A to point B.
I've touched on the following story before, but it's still very relevant to the current situation:
Let's take a look at some charts.
The transportation index was one of the charts that originally led to to make a bear market call. The index had dropped pretty hard. Since then it has bounced back, although not enough for me to change my opinion about the market's overall direction.
Above is the 5 year chart in one week increments. Notice the clear trend break that occurred at the end of last year. Also note how the index has bounced back since the first of the year.
The three month SMA chart shows the bounce back. Notice how the index moved from lows of around 74 - 76 in January to the current levels in the low 1980s. Also note the average is moving closer to the 200 day SMA. But the rest of the SMA picture is cloudier. Notice that prices and the shorter SMAs (10, 20 and 50) are tightly packed around 81. That indicates there is a great deal of uncertainty about where this average is going. Also notice the average is inching back to the 200 day SMA. A cross above this like and a sustained presence about it could indicate an overall change in the market's thinking about the economy.
Let's take a look at the sub-industries
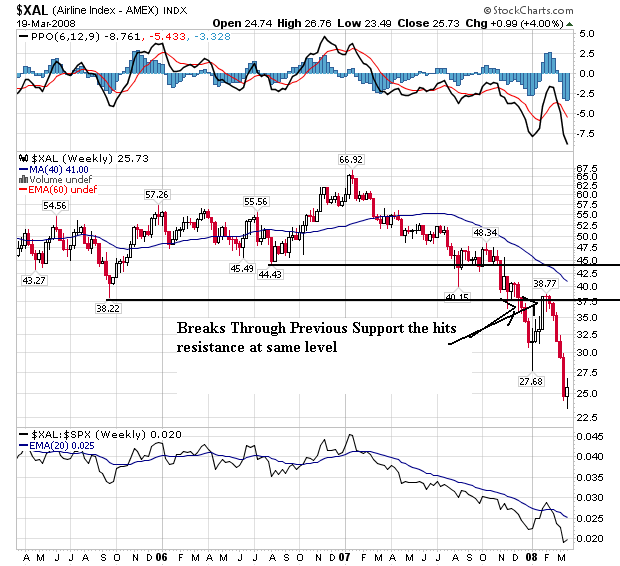
Airlines are clearly in a downtrend. They've been selling off since the beginning of 2007. Notice at the end of last year they fell through a price level established in late 2005 and then rallied into that level and failed in early 2008. That means there is probably further trouble ahead for this sector.
Rail has a stronger chart. Notice that it hasn't dropped nearly as hard as the broader transport index or the airlines. The sector has been in a consolidation pattern for the last year. Rail has a more solid customer base. For example, they help to transport oil and coal which will be used regardless of the overall economic situation.
Shipping was in a two year price channel in 2005 and 2006. It broke out of that channel in 2007, but has been in a downward sloping pennant pattern since last summer.
Trucking has essentially been in a three year long consolidation pattern since the beginning of 2005. Prices have moved between 240 and 300 on the chart with tow spikes about those levels. But the index couldn't keep the the upward momentum.
Overall, the sub-industries indicate traders are concerned but not panicked about the sector. They're taking some profits, but not aggressively selling.
A sharp drop in freight shipped across the Pacific during the past two months suggests the shipping-industry slump is about to get worse.
At the major ports of Los Angeles and Long Beach, Calif., which bring in nearly two-thirds of West Coast containerized goods, import volume fell 8.8% in both January and February compared with a year earlier, as the weakening economy, tough housing market and high gasoline prices eroded U.S. demand.
.....
Transportation companies like FedEx offer a window into the pernicious effects of a slow economy and rising commodities costs.
Slow growth and high energy costs seem to have squeezed FedEx's third-quarter earnings, due to be reported today. Analysts surveyed by Thomson Financial expect it to post net income of $1.22 a share, down 10% from a year ago.
Rival UPS warned last week that it could miss first-quarter earnings targets after six straight weeks of negative volume in its U.S. package business. Kurt Kuehn, UPS's chief financial officer, said "across a very broad segment of our customers there is a slowing in shipping needs."
High energy prices and weakening demand have also thumped truckers. The American Trucking Associations expects truckers to spend $135 billion on fuel this year, up 20% from 2007. Several trucking companies describe the environment today as the worst they've seen, say Morgan Keegan analysts.
Trouble in transports signals a bad outlook more broadly. FedEx shares tumbled in 1999, before the rest of the market. The "FedEx Indicator" seems to be working well again. Its shares started dropping in July and are down 26% since then. The Dow Jones Industrial Average didn't start slipping until October
Simply put, the transports are a great way to keep track of how the economy is doing. If it's going well, people will have to ship more and more stuff from point A to point B. If things aren't going well, people will be shipping less stuff from point A to point B.
I've touched on the following story before, but it's still very relevant to the current situation:
U.S. airlines, which seemed last year to have shaken off a half-decade slump, may face a new round of restructuring amid a stumbling economy and spiraling fuel prices.
The turnabout reflects the headwinds that have buffeted the industry as oil prices have risen 75% in the past year and the housing slump has mushroomed into a broader credit crisis, making it hard for many businesses and households to borrow and prompting consumers to cut back on spending. Most economists now think the U.S. has slipped into a recession, and the debate is shifting to how deep the downturn will be.
Other industries, from the nation's beleaguered banks to retailers and auto makers, are facing similar pressures. But the major airlines, many of which have spent long periods under bankruptcy protection in recent years, worry they are especially vulnerable.
Let's take a look at some charts.
The transportation index was one of the charts that originally led to to make a bear market call. The index had dropped pretty hard. Since then it has bounced back, although not enough for me to change my opinion about the market's overall direction.
Above is the 5 year chart in one week increments. Notice the clear trend break that occurred at the end of last year. Also note how the index has bounced back since the first of the year.
The three month SMA chart shows the bounce back. Notice how the index moved from lows of around 74 - 76 in January to the current levels in the low 1980s. Also note the average is moving closer to the 200 day SMA. But the rest of the SMA picture is cloudier. Notice that prices and the shorter SMAs (10, 20 and 50) are tightly packed around 81. That indicates there is a great deal of uncertainty about where this average is going. Also notice the average is inching back to the 200 day SMA. A cross above this like and a sustained presence about it could indicate an overall change in the market's thinking about the economy.
Let's take a look at the sub-industries
Airlines are clearly in a downtrend. They've been selling off since the beginning of 2007. Notice at the end of last year they fell through a price level established in late 2005 and then rallied into that level and failed in early 2008. That means there is probably further trouble ahead for this sector.
Rail has a stronger chart. Notice that it hasn't dropped nearly as hard as the broader transport index or the airlines. The sector has been in a consolidation pattern for the last year. Rail has a more solid customer base. For example, they help to transport oil and coal which will be used regardless of the overall economic situation.
Shipping was in a two year price channel in 2005 and 2006. It broke out of that channel in 2007, but has been in a downward sloping pennant pattern since last summer.
Trucking has essentially been in a three year long consolidation pattern since the beginning of 2005. Prices have moved between 240 and 300 on the chart with tow spikes about those levels. But the index couldn't keep the the upward momentum.
Overall, the sub-industries indicate traders are concerned but not panicked about the sector. They're taking some profits, but not aggressively selling.
Wednesday, March 19, 2008
What's Happening With Commodities?
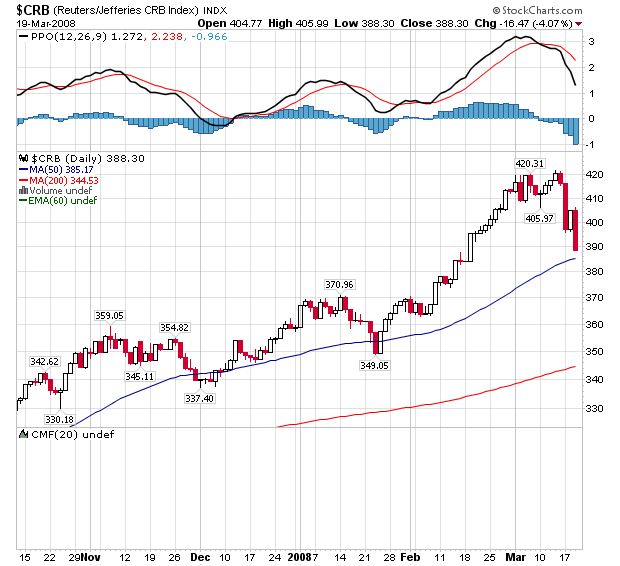
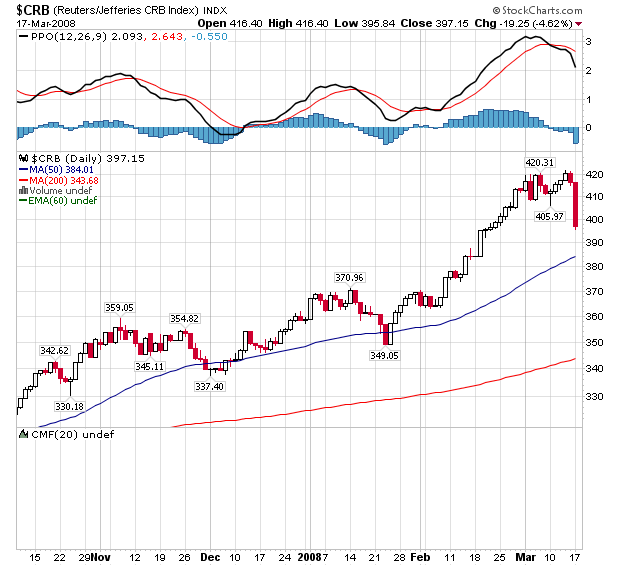
For the last 3-5 months I've been writing about the huge spike in commodity prices. Well commodities have taken a big hit over the last two trading sessions. Here's the CRB index's chart:
So -- what's going on? There are a combination of reasons for the answer.
Let's start with the Fed statement:
1.) Everybody was expecting a 100 basis point cut and we only got a 75 basis point cut. That's why the markets dropped at first after the news came out. So, the Fed didn't cut as much as expected.
2.) Note the inflation language. The Fed is saying, "we're not happy with where inflation is and it could spike higher." In addition,
3.) Two governors voted against the decision. Here's a key phrase from the January 30 meeting:
One Fed governor voted against that rate cut in January. Two voted against the latest cut.
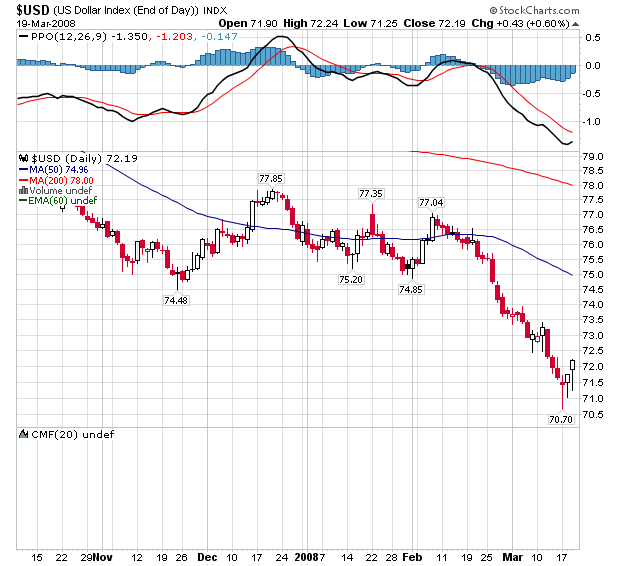
Putting this all together, I think commodities traders are thinking there is growing dissent within the Fed about interest rate policy. The rate cut was smaller than we thought it would be and more Fed governors are voting against cutting rates. Therefore, the rate cuts may be near the end. This would also explain why the dollar is rising the last few days:
Note the action across a variety of fronts:
So -- what's going on? There are a combination of reasons for the answer.
Let's start with the Fed statement:
The Federal Open Market Committee decided today to lower its target for the federal funds rate 75 basis points to 2-1/4 percent.
Inflation has been elevated, and some indicators of inflation expectations have risen. The Committee expects inflation to moderate in coming quarters, reflecting a projected leveling-out of energy and other commodity prices and an easing of pressures on resource utilization. Still, uncertainty about the inflation outlook has increased. It will be necessary to continue to monitor inflation developments carefully.
Voting for the FOMC monetary policy action were: Ben S. Bernanke, Chairman; Timothy F. Geithner, Vice Chairman; Donald L. Kohn; Randall S. Kroszner; Frederic S. Mishkin; Sandra Pianalto; Gary H. Stern; and Kevin M. Warsh. Voting against were Richard W. Fisher and Charles I. Plosser, who preferred less aggressive action at this meeting.
1.) Everybody was expecting a 100 basis point cut and we only got a 75 basis point cut. That's why the markets dropped at first after the news came out. So, the Fed didn't cut as much as expected.
2.) Note the inflation language. The Fed is saying, "we're not happy with where inflation is and it could spike higher." In addition,
3.) Two governors voted against the decision. Here's a key phrase from the January 30 meeting:
Voting for the FOMC monetary policy action were: Ben S. Bernanke, Chairman; Timothy F. Geithner, Vice Chairman; Donald L. Kohn; Randall S. Kroszner; Frederic S. Mishkin; Sandra Pianalto; Charles I. Plosser; Gary H. Stern; and Kevin M. Warsh. Voting against was Richard W. Fisher, who preferred no change in the target for the federal funds rate at this meeting.
One Fed governor voted against that rate cut in January. Two voted against the latest cut.
Putting this all together, I think commodities traders are thinking there is growing dissent within the Fed about interest rate policy. The rate cut was smaller than we thought it would be and more Fed governors are voting against cutting rates. Therefore, the rate cuts may be near the end. This would also explain why the dollar is rising the last few days:
Note the action across a variety of fronts:
Gold futures suffered their biggest one-day dollar decline in 28 years and other precious metals also tumbled sharply on long liquidation Wednesday in the aftermath of a smaller-than-expected rate cut from the Federal Open Market Committee that came after metals closed on Tuesday, traders and analysts said.
The selling was part of overall weakness in commodities that included a loss of more than $5 a barrel in Nymex April crude oil as of gold's close. Technical selling was triggered in the metals.
Most active April gold tumbled $59 to $945.30 an ounce on the Comex division of the New York Mercantile Exchange. Shortly after Comex pit trade closed, the April contract at the Chicago Board of Trade was down $59.60 to $945.10.
Lightly traded but nearby Comex March gold fell $58.50 to $944.70 an ounce. A scan of Nymex records shows nearby gold has seldom ever lost more than $30 a day, and Wednesday was the largest one-day fall since a $143.50 collapse on Jan. 22, 1980, the month when gold was especially volatile when hitting record highs that stood until early this year.
Meanwhile, May silver plunged $1.515 to $18.445. As it was closing, CBOT May silver was down $1.508 to $18.47. Comex April gold settled Tuesday at $1,004.30, less than an hour before the FOMC cut the federal-funds rate by 75 basis points rather than the 100 the financial markets were expecting. Furthermore, there were two dissenting votes.
The contract fell as far as $976.80 in electronic screen trading late Tuesday, then tumbled further Wednesday to a pit-session low of $940. At that level, it was down $93.90, or 9.1% from the contract high of $1,033.90 hit two days ago.
The dollar's rally after the rate cut was the catalyst for much of the selling in gold, said Daniel Pavilonis, senior market strategist with Lind-Waldock.
Today's Markets
How quickly the markets forget. It was only yesterday when they were thrilled by a .75% basis point rate cut. Today they sold off to levels that existed at the start of trading yesterday. In other words -- the Fed bounce is now gone.
A sell-off after a rally is understandable. Traders want to take profits off the table. But traders kept taking profits off the table for most of the day. That indicates there is a great deal of concern out there.
A sell-off after a rally is understandable. Traders want to take profits off the table. But traders kept taking profits off the table for most of the day. That indicates there is a great deal of concern out there.
Semiconductor Glut Starting?
From IBD:
It's been forever since I've written about a technology sector. The latest rally (the one that started in roughly 2003) has been about basic materials and energy as opposed to technology. So talking about a tech sector reminds me of the 1990s bull market in a big way.
On the long-term chart (5 year) notice that semis have been in a clear trading range for about three and a half years. They've been moving between roughly 30 and 38. In addition, there's been a pretty solid predictability to this averages moves. It has risen for about a year and a half and then retreated.
Also note the volume has been dropping for most of this consolidation pattern.
On the year chart notice the following:
-- The average is retreating from a head and shoulders formation that formed in the first half of 2007.
-- There are two triangle consolidations that occurred on the way down.
-- Notice the average is currently right at its long-term support level -- roughly 30/share.
On the simple moving average (SMA) chart, notice the following:
-- Prices are in a very tight range -- roughly 2 points.
-- Prices are clearly consolidating.
-- Prices and moving averages are tightly packed, indicating the market is looking for a place to go.
Chipmakers measure inventory in number of days' worth of inventory on their shelves.
"Time after time this quarter, I've watched companies raise their inventory days," Van Hoy said. "It doesn't take long before you start to say, 'This is not going to be a happy quarter.' "
The Semiconductor Industry Association has forecast 7.7% growth in global chip sales this year, after sales rose just 3.2% in 2007 to $256 billion. But Van Hoy says that prediction is looking shaky.
Gartner analyzed fourth-quarter earnings reports and found world chip inventory had spiked to an unhealthy level. Van Hoy says that when this quarter's results are tallied, it will be a very bad one for the chip sector.
The number of chips in the supply chain fell slightly last quarter, Van Hoy says. But with forecasts of falling sales this quarter, higher chip inventory in the supply chain is all but certain, he says.
Another trend is a factor in rising inventory. For the past five years, Van Hoy says, distributors have been cutting their inventory levels. Less inventory on hand means lower costs for them but forces chipmakers to keep more stock on hand, to be sure customers don't run out of supply.
Using its own Dataquest Semiconductor Inventory Index, Gartner last week said its chip inventory index spiked in the fourth quarter to 1.16 from 1.04 the previous quarter. A reading of 1.0 is ideal. A reading above that number means inventory in the supply chain is too high. Rising from 1.04 to 1.16 is a big jump, Van Hoy says. It's enough to raise red flags.
Investors should be wary of chip stocks, he says.
"It's entirely the right thing to urge caution," he said.
It's been forever since I've written about a technology sector. The latest rally (the one that started in roughly 2003) has been about basic materials and energy as opposed to technology. So talking about a tech sector reminds me of the 1990s bull market in a big way.
On the long-term chart (5 year) notice that semis have been in a clear trading range for about three and a half years. They've been moving between roughly 30 and 38. In addition, there's been a pretty solid predictability to this averages moves. It has risen for about a year and a half and then retreated.
Also note the volume has been dropping for most of this consolidation pattern.
On the year chart notice the following:
-- The average is retreating from a head and shoulders formation that formed in the first half of 2007.
-- There are two triangle consolidations that occurred on the way down.
-- Notice the average is currently right at its long-term support level -- roughly 30/share.
On the simple moving average (SMA) chart, notice the following:
-- Prices are in a very tight range -- roughly 2 points.
-- Prices are clearly consolidating.
-- Prices and moving averages are tightly packed, indicating the market is looking for a place to go.
What Went Wrong In Housing?
There's a great article today in the WSJ about what went wrong in the housing market. Short version -- a lot of people and institutions dropped the ball big time.
Let me chime in with a few observations.
1.) There's a fundamental belief that regulation is bad and deregulation is good. That's a horrible over-simplification. It's important to remember that at the base of capitalism is greed. Some greed is a good thing -- it can inspire people to make better products more efficiently which means the end result costs less. That's good and I think it's safe to say we all like better products cheaper. Too much greed compromises ethics. That's bad. There are plenty of situations in the last 25 years that demonstrate that. For example, the S&P crisis, Enron and Worldcom and now the housing mess. The line between the good and bad effects of greed is very fine and it moves regularly.
2.) There is such a thing as too much regulation. Red tape is a bad thing if it gets in the way of innovation or development. A classic example is the lack of building new refining capacity in the US since the 1970s. Like it or not, the US uses a ton of oil products and our demand for oil products has increased greatly since the late 1970s if only by reason of population growth. Yet we are still using the same refining plant developed when my parents were in their prime. That's a problem. And no -- this is not a call from Bonddad to pollute or cause a ton of environmental damage. But it is a call to deal with the situation in a far better way then we are dealing with it now. Frankly, that probably means developing a national energy policy -- which we should have done 30 years ago.
3.) The government's role is to play referee. Before his resignation, Eliot Spitzer was one of the best things to happen to Wall Street in a very long time. Why? Because he enforced the rules -- which is something that has to be done. Here's s simple question: how many food recalls have there been in the last three years? A ton. Why? Because the government isn't enforcing the rules. I don't know about you guys, but I like the idea of my food being safe to eat. Maybe I'm different. But when the CEO of the latest company to initiate a meat recall said in open testimony on Capital Hill that he was using sick animals I almost become a vegetarian (almost). That's the end result of not enforcing the rules. That does not mean we make it impossible to do business. But we do need to make sure the rules are followed and that means enforcement.
That's my rant on the topic.
Democrats are quick to blame Republicans, who were in power during the housing bubble and subprime lending frenzy. For years, America's leaders failed to restrain the markets, companies, investors and consumers from the missteps that led to the most pervasive financial crisis in decades.
But in hindsight, the failure stretches across government and across party lines. At bottom are two strong currents. From the Republican president to urban Democratic congressmen, homeownership was pushed as an overriding and unquestioned goal. And many significant attempts at regulation were obstructed by the prevailing belief that the economy did best when financial markets operated as freely as possible.
The Bush administration coupled cheerleading for homeownership with pressure on government-sponsored mortgage lenders Fannie Mae and Freddie Mac to provide funding for riskier mortgages. Both Democrats and Republicans stood by as Fannie and Freddie invested heavily in securities backed by subprime loans. Democratic congressmen pushed a federal law to restrain lending practices later discredited, but Republicans with some Democratic allies blocked or countered with weaker versions.
And at the Federal Reserve, Chairman Alan Greenspan, revered by both parties for his economic management, resisted using the Fed's authority to more aggressively regulate lender behavior.
The blame spreads beyond Washington, to state capitals. In California, home to most of the country's subprime lenders, Democratic state lawmakers didn't support laws that would have imposed tougher regulations on a prized local industry. Politicians of all stripes cheered on the lower interest rates that sparked the boom in housing and excesses in credit.
Let me chime in with a few observations.
1.) There's a fundamental belief that regulation is bad and deregulation is good. That's a horrible over-simplification. It's important to remember that at the base of capitalism is greed. Some greed is a good thing -- it can inspire people to make better products more efficiently which means the end result costs less. That's good and I think it's safe to say we all like better products cheaper. Too much greed compromises ethics. That's bad. There are plenty of situations in the last 25 years that demonstrate that. For example, the S&P crisis, Enron and Worldcom and now the housing mess. The line between the good and bad effects of greed is very fine and it moves regularly.
2.) There is such a thing as too much regulation. Red tape is a bad thing if it gets in the way of innovation or development. A classic example is the lack of building new refining capacity in the US since the 1970s. Like it or not, the US uses a ton of oil products and our demand for oil products has increased greatly since the late 1970s if only by reason of population growth. Yet we are still using the same refining plant developed when my parents were in their prime. That's a problem. And no -- this is not a call from Bonddad to pollute or cause a ton of environmental damage. But it is a call to deal with the situation in a far better way then we are dealing with it now. Frankly, that probably means developing a national energy policy -- which we should have done 30 years ago.
3.) The government's role is to play referee. Before his resignation, Eliot Spitzer was one of the best things to happen to Wall Street in a very long time. Why? Because he enforced the rules -- which is something that has to be done. Here's s simple question: how many food recalls have there been in the last three years? A ton. Why? Because the government isn't enforcing the rules. I don't know about you guys, but I like the idea of my food being safe to eat. Maybe I'm different. But when the CEO of the latest company to initiate a meat recall said in open testimony on Capital Hill that he was using sick animals I almost become a vegetarian (almost). That's the end result of not enforcing the rules. That does not mean we make it impossible to do business. But we do need to make sure the rules are followed and that means enforcement.
That's my rant on the topic.
Tuesday, March 18, 2008
Gas Prices Starting to Hit Employment Numbers
From the WSJ:
Those cost increases are pretty hefty. And don't think Delta is alone is this.
And here is more bad news for Detroit:
Everybody in some way is getting hit by fuel prices. Well, not everybody -- only people who have to drive or move stuff from point A to point B. Consider those fuel cost increases and Delta's announcement along with these two charts of employment from Econoday:
Delta Air Lines Inc. unveiled a new plan to cope with soaring fuel prices that includes cutting 2,000 jobs and reducing its number of domestic flights by an additional 5%.
In a memo to employees this morning, Richard Anderson, Delta's chairman and chief executive, and Ed Bastian, president and chief financial officer, said the airline hopes to achieve the headcount reductions by offering voluntary buyouts to about 30,000 employees.
Delta will reduce its number of domestic flights by cutting back on the number of flights on certain routes, by parking up to 45 planes, and other measures. The 5% reduction will now result in a 10% year-over-year cutback in domestic flights by August.
While Delta has already cut some domestic flights, eliminated routes, and made efforts to save on fuel use, fuel prices have climbed nearly 20% in the past three months, the executives said in the memo. The airline's fuel bill for this year is expected to be nearly $900 million higher than Delta's original projections, and more than $2 billion above 2007. Delta's earlier forecast was based on fuel prices of $90 a barrel, and the airline now expects fuel to remain at about $100 a barrel "for the foreseeable future," the executives said.
Those cost increases are pretty hefty. And don't think Delta is alone is this.
And here is more bad news for Detroit:
J.D. Power & Associates cut its forecast for new vehicle sales in the U.S. by 4.8% to 14.95 million, a level last seen in 1994, and said that the sales market will weaken further in the second quarter before beginning a rebound.
The market-research firm, while noting weaker sales in January and February, said much of the outlook reduction was due to slumping consumer confidence and persistent economic turbulence. J.D. Power's prior 2008 sales forecast was 15.7 million; the last time U.S. sales totaled less than 16 million vehicles was 1998.
Sales at the retail level are now seen totaling 12.3 million vehicles this year, down from the old forecast of 12.6 million and 2007 sales of 12.8 million. J.D. Power said, "General economic conditions, coupled with less widespread incentives, are driving the retail decline."
Everybody in some way is getting hit by fuel prices. Well, not everybody -- only people who have to drive or move stuff from point A to point B. Consider those fuel cost increases and Delta's announcement along with these two charts of employment from Econoday:
Today's Markets
I'm going to use a longer view -- three days -- to look at today's market. The markets opened higher on the Goldman and Lehman news. There has been a persistent rumor that Lehman would be the next Bear Stearns. Today's news diminished that fear.
The markets didn't quite know what to do with the Fed's news. First they sold off, probably because the cut was only 75 basis points. But the market then realized they were still getting a sizable cut, so everybody moved higher.
If you look at the three day charts, it looks as though we're in the middle of a turnaround.
On the daily charts notice tow things.
-- on all the charts, the last two days look like a bounce from a very low (as in yearly low) position. Once again, the Fed's rate cut came at a technically good time.
-- We could possibly be forming a double bottom, with the first bottoms occurring in mid-lat January and the second bottom occurring now.
FOMC Statement
From the Fed:
A bit less than expected, but not really surprising.
Short version: the economy is really stinking up the joint right now, inflation will calm down, growth will return.
Shorter version: We don't care about inflation right now.
The Federal Open Market Committee decided today to lower its target for the federal funds rate 75 basis points to 2-1/4 percent.
Recent information indicates that the outlook for economic activity has weakened further. Growth in consumer spending has slowed and labor markets have softened. Financial markets remain under considerable stress, and the tightening of credit conditions and the deepening of the housing contraction are likely to weigh on economic growth over the next few quarters.
Inflation has been elevated, and some indicators of inflation expectations have risen. The Committee expects inflation to moderate in coming quarters, reflecting a projected leveling-out of energy and other commodity prices and an easing of pressures on resource utilization. Still, uncertainty about the inflation outlook has increased. It will be necessary to continue to monitor inflation developments carefully.
Today’s policy action, combined with those taken earlier, including measures to foster market liquidity, should help to promote moderate growth over time and to mitigate the risks to economic activity. However, downside risks to growth remain. The Committee will act in a timely manner as needed to promote sustainable economic growth and price stability.
Voting for the FOMC monetary policy action were: Ben S. Bernanke, Chairman; Timothy F. Geithner, Vice Chairman; Donald L. Kohn; Randall S. Kroszner; Frederic S. Mishkin; Sandra Pianalto; Gary H. Stern; and Kevin M. Warsh. Voting against were Richard W. Fisher and Charles I. Plosser, who preferred less aggressive action at this meeting.
In a related action, the Board of Governors unanimously approved a 75-basis-point decrease in the discount rate to 2-1/2 percent. In taking this action, the Board approved the requests submitted by the Boards of Directors of the Federal Reserve Banks of Boston, New York, and San Francisco.
A bit less than expected, but not really surprising.
Short version: the economy is really stinking up the joint right now, inflation will calm down, growth will return.
Shorter version: We don't care about inflation right now.
What Inflation?
From the BLS:
From Marketwatch:
Next months figures stand a good possibility of being worse because they will include oil's price spike from early March, along with the price spike is several important commodities like Wheat.
Bonds sold-off on the news, but have since moved back. At some point, the inflation news will start to sink-in with bond investors (of course, maybe the bond market is still thinking the economy will eventually hit a deflationary patch)
The Producer Price Index for Finished Goods rose 0.3 percent in February, seasonally adjusted, the Bureau of Labor Statistics of the U.S. Department of Labor reported today. This increase followed a 1.0-percent advance in January and a 0.3-percent decline in December. At the earlier stages of processing, prices received by manufacturers of intermediate goods moved up 0.8 percent in February subsequent to a 1.4-percent advance in January, and the crude goods index rose 3.7 percent after climbing 2.5 percent in the prior month.
Before seasonal adjustment, the Producer Price Index for Finished Goods increased 0.2 percent in February to 172.2 (1982 = 100). From February 2007 to February 2008, finished goods prices advanced 6.4 percent. Over the same period, the index for finished energy goods increased 19.6 percent, prices for finished consumer foods rose 6.0 percent, and the index for finished goods other than foods and energy climbed 2.4 percent. For the 12 months ended February 2008, prices received by intermediate goods producers increased 8.8 percent, and the crude goods index surged 24.6 percent.
From Marketwatch:
"After two consecutive months of such strong gains in the core PPI, it is difficult to downplay inflation risks," wrote Stephen Gallagher of Societe Generale in an email Tuesday.
"Clearly, manufacturers are pressured by higher material and currency-related costs and are trying to pass these cost hikes onto consumers," Gallagher wrote.
"This report shows broad based core inflation pressures and, despite the decline in food prices in February, the trends in the inflation rate over the last three months point to continued acceleration in prices in this area," wrote Bear Stearns economists.
Next months figures stand a good possibility of being worse because they will include oil's price spike from early March, along with the price spike is several important commodities like Wheat.
Bonds sold-off on the news, but have since moved back. At some point, the inflation news will start to sink-in with bond investors (of course, maybe the bond market is still thinking the economy will eventually hit a deflationary patch)
Industrial Production and Empire State Survey Show Increasing Weakness
From the WSJ:
On the chart notice the year-over-year change in production was pretty even from about April 2007 to last month. Yesterday's figure moves the number lower in a big way. As mentioned below, one month does not a trend make.
In Fed's industrial production index is a very broad measure of production. It includes everything made or consumed in the US. Note the broad nature of the decreases:
As for the New York Fed, their report was not encouraging:
And here's the chart:
That's gonna leave a mark.
The Federal Reserve reported that industrial production fell 0.5% in February after rising 0.1% in January. "The industrial sector remains in recession," said Daniel Meckstroth, chief economist of the Manufacturers Alliance/MAPI trade group.
In a separate report, the Fed's New York district bank said its Empire State manufacturing survey stood at minus 22.23 in March, down from minus 11.72 in February. The previous low was minus 19.6, in November 2001. "New York manufacturing is rapidly slowing and the record-low measure of activity makes it clear the economy is in trouble," said Joel Naroff, president of Naroff Economic Advisors.
On the chart notice the year-over-year change in production was pretty even from about April 2007 to last month. Yesterday's figure moves the number lower in a big way. As mentioned below, one month does not a trend make.
In Fed's industrial production index is a very broad measure of production. It includes everything made or consumed in the US. Note the broad nature of the decreases:
The production of consumer goods decreased 0.6 percent in February with declines in the production of both consumer durables and consumer nondurables.
The output of business equipment edged up 0.1 percent in February, as an increase in information processing equipment outweighed decreases both in transit equipment and in industrial and other equipment.
The output of defense and space equipment declined 0.3 percent in February after having increased 1.0 percent in January.
The output of construction supplies fell 0.8 percent in February after having decreased 0.6 percent in January; the level of production in February was nearly 1 percent below its year-earlier level and 5.2 percent below its peak in 2006. The output of business supplies declined 1.1 percent in February.
The production of materials fell 0.5 percent in February after having changed little in January.
As for the New York Fed, their report was not encouraging:
The Empire State Manufacturing Survey indicates that conditions for New York manufacturers deteriorated further in March. The general business conditions index fell another 10½ points to -22.2, a reading that eclipsed the record-low of -19.6 set in November 2001. Although the new orders index rose modestly, the shipments index edged down, and both remained in negative territory. The prices paid index rose for the third consecutive month, reaching its highest level since mid-2006, but the prices received index declined. Employment indexes remained close to zero. Future indexes were generally positive and up slightly for the month, but still well below levels of late last year. However, the future employment indexes rebounded noticeably after falling steeply in February.
And here's the chart:
That's gonna leave a mark.
Commodity Prices Take a Big Hit
Commodities experienced a big sell-off yesterday.
The WSJ noted:
In other words, the reason for the sell-off was technical (the need to raise cash because of margin calls) as opposed to fundamental (a drop in demand). Here's a chart of the CRB index which shows the degree of selling:
One day does not a trend make. In other words, it's the long-term trend that matters. But yesterday's sell-off was very large. Some traders may want to continue taking profits -- especially after a long rally like we've experienced. On the flip side, the dollar is still dropping hard. And with the Fed expected to make a big rate cut today that trend should continue. A dropping dollar adds further upside price pressure to anything priced in dollars which is every commodity out there.
Most commodities fell Monday, as investors sold oil, coffee and grains to cover deepening losses in stocks and bonds. But gold ended slightly higher, as safe-haven buying kept it above the key $1,000 level.
The Reuters-Jefferies CRB Index, which tracks 19 commodity futures, fell about 5%, its sharpest single-day slide in almost 40 years.
The sell-off in energy, base metals and crops coincided with margin calls on global financial markets and a dire need for cash in almost every financial industry as the fall of Wall Street's Bear Stearns shook the global economy.
Crude oil futures took their hardest tumble in almost two weeks, sliding more than 6%. Copper, one the most economically sensitive raw materials, was down 5%.
Coffee and cocoa lost as much 10% during their worst moments in Monday's trading.
Other key crops like wheat, corn and soybeans also slumped, many hitting limit-down for the session.
Most of these markets had rallied for months now due to a weak U.S. dollar. The currency fell again Monday, plumbing new lows against other major currencies. But commodities prices fell anyway.
The WSJ noted:
"People liquidate positions because they need money for other things," said Mark Waggoner, president of Excel Futures. "Sometimes they just bail out of everything."
Silver and copper prices fell, while gold, the traditional safe haven in tough times, shed most of its big early gains in the broader liquidation trend. Still, Comex gold for March delivery gained $3.20 per troy ounce, or 0.3%, to end at $1,001.40.
In grains, soybeans, corn and wheat all tumbled by the maximum amounts allowed by exchange rules. Sugar and coffee both fell more than 10%.
"You're seeing massive risk aversion," said Leonard Kaplan, president of Prospector Asset Management. "Everybody is getting out of everything, in every commodity."
The energy complex was particularly hard-hit, including a 6.9% drop in reformulated-gasoline blendstock, or RBOB, futures. This is the biggest drop for the front-month contract in its Nymex trading history.
"Today was such carnage ... sometimes I thought it was just throwing the baby out with the bath water," said Kevin Mallon at Prebon Energy, who called the decline in RBOB "overdone."
In other words, the reason for the sell-off was technical (the need to raise cash because of margin calls) as opposed to fundamental (a drop in demand). Here's a chart of the CRB index which shows the degree of selling:
One day does not a trend make. In other words, it's the long-term trend that matters. But yesterday's sell-off was very large. Some traders may want to continue taking profits -- especially after a long rally like we've experienced. On the flip side, the dollar is still dropping hard. And with the Fed expected to make a big rate cut today that trend should continue. A dropping dollar adds further upside price pressure to anything priced in dollars which is every commodity out there.
Monday, March 17, 2008
A Closer Look At the Financial Sector
With all of the concern about Bear Stearns yesterday and the ongoing problems in the credit markets, it seems like a good time to look at some parts of the financial sector. The charts are from Prophet.net.
The asset management sector just recently broke a 5-year uptrend. It is currently consolidating in a triangle consolidation pattern.
The credit services sector was a very boring sector for about three years, trading in a solid range. Then the sector made a clear break below support and took a nasty nose dive. It is currently trading at levels from early 2003.
The diversified investment has jest barely broken an uptrend.
Money center banks consolidated from the beginning of 2005 to the last quarter of 2006. After that they rose for about a year and a half and formed a double top. Since then they have been in a nosedive thanks to the mortgage market problems.
National brokers consolidated in a triangle pattern from the beginning of 2004 to mid-2005. Then they went into a two year rally, forming a double top in early 2007. Since then they have been selling off because of problems in the financial markets.
Dollar Still Getting Hammered
With the Fed cutting the discount rate yesterday and the expectation of a large rate cut today, the dollar is getting hit hard.
Let's take a look at the charts.
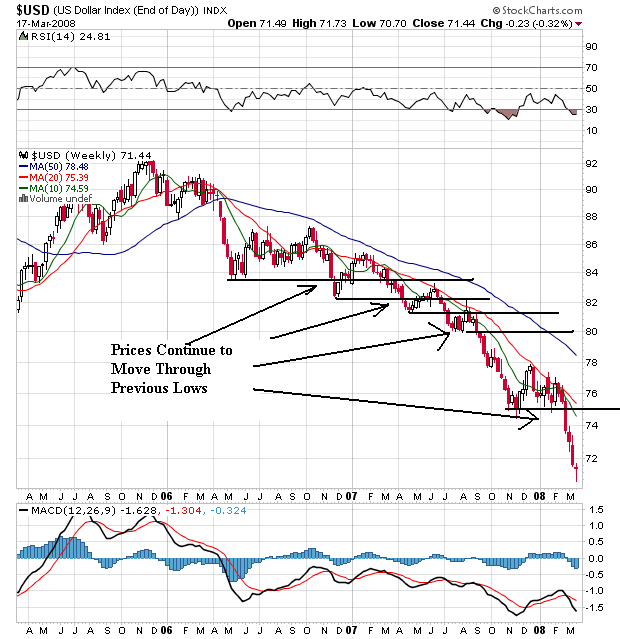
On the weekly chart, note for the last two years the dollar continually moved through price support levels. The dollar has lost about 20% of its value since the beginning of 2006.
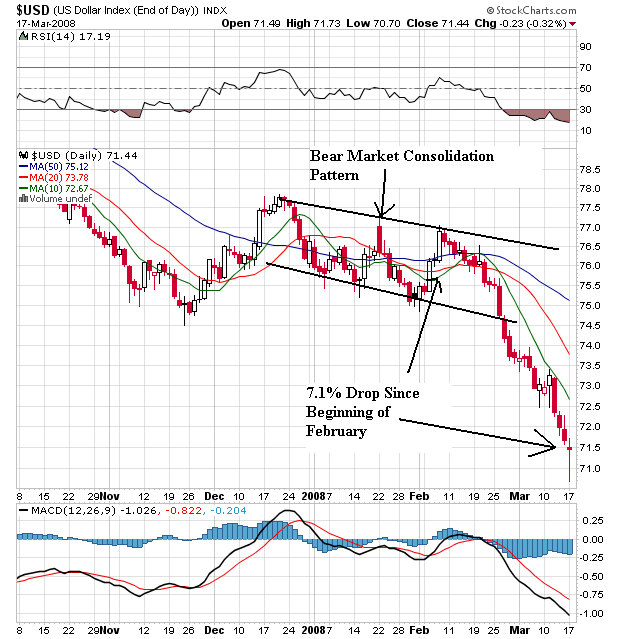
On the daily chart, notice the following:
-- Prices are below all the simple moving averages (SMAs). This will pull the SMAs lower
-- The shorter SMAs are below the longer SMAs
-- All the SMAs are moving lower.
In short, this is a very bearish chart.
The dollar fell for a fifth day against the yen on speculation the Federal Reserve will lower interest rates by at least 1 percentage point today to revive confidence in financial markets.
The U.S. currency also weakened for a fifth day against the euro. Traders increased bets the Fed will slash its the target for the overnight lending rate between banks to 2 percent after the Fed made an emergency cut in its discount interest rate.
``Investors are fixated on the upcoming Fed rate decision,'' said Kosuke Hanao, head of foreign exchange in Tokyo at HSBC Bank, a unit of Europe's biggest lender. ``The Fed will cut rates by 1 percent.''
The U.S. currency fell to 96.94 yen at 9:45 a.m. in Tokyo from 97.33 late yesterday, when it touched 95.76 yen, the weakest since Aug. 15, 1995. The dollar traded at $1.5758 per euro, after reaching $1.5903 yesterday, the lowest level since the euro started trading in 1999. It traded at 0.9826 Swiss franc, approaching a record low of 0.9638 francs.
Let's take a look at the charts.
On the weekly chart, note for the last two years the dollar continually moved through price support levels. The dollar has lost about 20% of its value since the beginning of 2006.
On the daily chart, notice the following:
-- Prices are below all the simple moving averages (SMAs). This will pull the SMAs lower
-- The shorter SMAs are below the longer SMAs
-- All the SMAs are moving lower.
In short, this is a very bearish chart.
Today's Markets
First, a word to the newcomers. I've gotten a great deal of blog traffic today. Usually, I only do one market update at the close. But because of today's unusual circumstances I thought periodic updates were warranted.
All that being said, today actually wasn't as big a deal as I would have thought. While the markets were down, they didn't drop as precipitously as they could have. That's probably the result of the Fed's increased discount window activity and the FOMC announcement tomorrow where the Fed is widely expected to drop rates. But the daily charts aren't very pretty and indicate we're still in technical trouble.
On the SPYs, notice there was an implied bottom probably caused by the Fed's actions. Also note we had two decent rallies and the market closed off its daily high.
With the QQQQs, notice we have a triangle consolidation at the end of the day.
On the IWMs, notice that prices formed a nice channel. This is the worse chart of the day, largely because prices closed a bit farther from the top than traders would like.
However, the markets still stand on the edge of a precipice from the daily chart perspective. On all of the charts that follow, notice how today's candle is uncomfortable close to yearly lows.
Media Appearance
I'll be on the Taylor Marsh show at 2:30 CST.
The markets are doing OK right now -- there have been no massive sell-offs below technically important levels. I'll have the standard market wrap after the close.
The markets are doing OK right now -- there have been no massive sell-offs below technically important levels. I'll have the standard market wrap after the close.
12:20 Update
We're about back where we started. This could be dangerous is we're in the same position near the close because the markets would be looking to sell-off then.
10:35 Update
The markets are still holding up pretty well. While they have all sold-off from session highs they haven't crashed hard. The sell-off is probably simple profit taking. My main guess is we're still looking at gap fade trading.
Subscribe to:
Posts (Atom)