Saturday, April 13, 2024

Weekly Indicators for April 8 - 12 at Seeking Alpha


 - by New Deal democrat


My “Weekly Indicators” post is up at Seeking Alpha.


There has been a lot o churn in both the short leading and coincident indicators in the past few weeks, but the overall tone is towards a more positive economic environment.

As usual, clicking over and reading will bring you up to the virtual moment on the data, and reward me just a little bit for my efforts.

Friday, April 12, 2024

March consumer price inflation was still mainly about the dynamics of shelter and gas prices


 - by New Deal democrat


The one advantage of not reporting on the March CPI results for two days is I’ve had the opportunity to look at more data in depth and mull things over.


And I’ve decided that there really wasn’t much change from the pattern we’ve seen for about the past 9 months. Basically the month to month variation in inflation is a function of the interplay between shelter and gas prices. During late 2022 and early 2023, the latter were still accelerating or steady at a high rate of inflation, while the latter were falling. Beginning in late 2023, the dynamic reversed, as shelter inflation was slowly decelerating, while gas prices had bottomed.

The big takeaway for the last several month has been a renewed increase in gas prices, while the deceleration in shelter inflation has slowed. There have been a couple of other players in the process that I’ll also discuss below.

First, let’s look at the month over month change in inflation for shelter as a whole (dark blue) vs. rent of primary residence (light blue) and owners’ equivalent rent (red) for the past 6 years:


In the years prior to the pandemic, the three averaged +0.3% growth +/-0.1% each month. After the pandemic, they peaked at roughly .75%, and in the past 12 months have slowly declined from an average of +0.5% per month to +0.4% per month. 

On a YoY basis, the various measures of shelter have decelerated from roughly +8% to just over 5.5%:


Because house prices lead shelter inflation with a 12-18 month lag, here’s the update of that metric:


Since house prices are presently increasing at 2.5% YoY, about average for the pre-pandemic period, I expect OER and the other measures of shelter inflation to continue to decelerate YoY, but probably at a slow pace compared with their initial rapid decline, because they will be compared with +0.5% monthly increases 12 months before vs. 0.7% at their peak.

Now let’s take a look at monthly gas prices (dark blue in the graph below) vs. energy prices generally (light blue). On a monthly basis, these had mainly declined beginning in mid-2022, but in the last two months have increased at more than their pre-pandemic average:


On a YoY basis, both are now higher, by 1.3% and 2.1% respectively:


This contrasts with their negative YoY readings for almost the entirety of the previous 16 months. 

So, to summarize: the deceleration in shelter inflation has slowed, while gas prices have reversed higher. This explains most of the increase in monthly inflation in the past several months, as is shown in the graph below comparing energy inflation (grey), headline (blue), core (gold), and inflation ex-shelter (red) YoY:


The reversal in gas prices has caused a similar, albeit smaller, reversal higher in both headline inflation and inflation ex-shelter. But it is noteworthy that, simply by excluding shelter, inflation is still only higher by 2.3%. 

In other words, it remains the case that, except for shelter, US consumer inflation is well-behaved.

As noted above, let me also take a look at several other sectors of note. Although I won’t bother with a graph, the former problem children of new and used vehicle prices have reached a new equilibrium. New car prices have actually *declined* -0.1% YoY, while used vehicles are down -2.2% YoY.

The remaining problem areas of inflation are:


 (1) food away from home, which peaked at 8.8% YoY one year ago, and is now down to 4.2%, close to its pre-pandemic average of 2.5%-3.0%;
 (2) electricity, which has followed gas prices higher, rising from 2.2% YoY last August to 5.0% in March; and 
 (3) transportation services - mainly car repairs and insurance - which has rocketed from its pre-pandemic range of 2.5%-5.0% to as high as 15.2% in October 2022, and is now still up 10.7%.

I’m not sure if there is more to the electricity story than the price of gas-powered turbines. But car repairs are up 8.2% YoY, and motor vehicle insurance is up a whopping 22.2%! Based on the past inflationary period of 1966-82, it is clear that transportation services lags increases in vehicle prices by 1-2 years and even more, sometimes increasing right through recessions:


So while I expect food away from home to continue to revert to its prior average, and perhaps electricity as well, price increases in transportation services may remain a problem for quite some time.

Real average wages and aggregate payrolls signal continued growth


 - by New Deal democrat


On Wednesday I was traveling so I didn’t get around to writing about the important CPI release. Let me start my delayed response by updating real wages and payrolls for non-supervisory employees.


Historically, as I have pointed out a number of times, real aggregate payrolls (red in the graph below) have a flawless record over the past 50+ years of peaking in the months ahead of a recession (Note: I show the last 30 years below. From the late 1960s through early 1990s, real wages declined almost relentlessly as the combination of the huge Baby Boom generation plus women entering the workforce applied potent downward pressure on wages, but increased aggregate payrolls and household income as there were many more two wage-earner households):


and turning negative YoY close to simultaneously with its onset. Real nonsupervisory wages (blue) have a less stellar record, but have almost always sharply decelerated or turned negative before or shortly after the onset of a recession, because inflation typically has accelerated faster than wage growth late in expansions, while the Fed has raised rates to tamp down demand:


Last Friday we found out that wages rose 0.2% for the month and 4.2% YoY, continuing their pattern of slow deceleration. Aggregate payrolls rose a strong 0.7% for the month and 6.1% for the year. With Wednesday’s 0.4% increase in consumer prices, real wages actually declined by -0.1% for the month, while real aggregate payrolls rounded up to 0.4%. On a YoY basis, real wages are up 4.2%, and real aggregate payrolls rose 6.1%:


Here are the real absolute numbers, norming inflation to “1” as of last month:


Real wages have declined in the past several months, but they have not broken trend yet. Meanwhile real aggregate payrolls set yet another all time record high. With this new high, and with real aggregate payrolls up close to 2% in the past year, continued expansion in the immediate future remains almost certain. 

Thursday, April 11, 2024

Initial claims continue to be rangebound, and a positive for the near term forecast


 - by New Deal democrat


[NOTE: After traveling all day yesterday, I decided to put off any comments on the CPI upside surprise until later today. Short version is that shelter continues its slow decent, gasoline picked up, and services are accelerating as one might expect in a strong economy with the supply chain tailwind having dissipated.]


Initial claims continued to be rangebound this week, declining -11,000 to 211,000. The four week moving average declined -250 to 214,250. With the usual one week delay, continuing claims increased 28,000 to 1.817 million:


On the YoY% basis more important for forecasting purposes, weekly claims were down -4.1%, the four week average down -4.4%, and continuing claims up from last week’s 12 month low to 7.1%:


While continuing claims are a negative, they are much less so than they were during the last nine months of 2023. The more leading initial claims remain firmly positive.

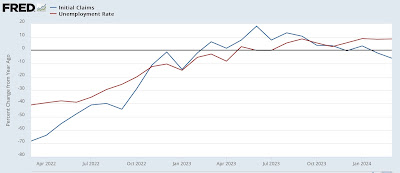
One week of data doesn’t give me enough information to make it worth updating the Sahm rule forecast, but here is the YoY% comparison through the end of March:


For the month, initial claims were down -5.9% YoY, while the unemployment rate was up 5.6% (note this is a ‘percent of a percent’). Because the YoY comparisons in both initial and continuing claims have improved since late last year, I expect the YoY comparison in the unemployment rate to follow suit, meaning a slight decline in that rate is more likely than a return to its recent peak of 3.9%.

Tuesday, April 9, 2024

Travelin’ man: Weekly Indicators for April 1 - 5 at Seeking Alppha


 - by New Deal democrat


I neglected to post this over the weekend, so I will post it now….


My “Weekly Indicators” update is over at Seeking Alpha.

There was lots of churn under the surface last week, but it continues to point towards general improvement.

As usual, clicking over and reading will bring you up to date through last Friday, and reward me with a little lunch money as well.

Also, tomorrow morning the CPI for March will be reported. I’ll be on the road, so I won’t be able to do any in dept post, but I’ll try to give you a quick paragraph or two covering the high (or low) points as I can.

Monday, April 8, 2024

Scenes from the robust March jobs report


 - by New Deal democrat


As I wrote Friday, the news from the employment report was almost all good. Let’s follow up on the most important points today.


First, the thre month average of new jobs added rose to a 12 month high, meaning Q1 of this year was the best quarter since Q1 of last year (dark blue, below, vs. monthly jobs light blue):


And the unemployment rate ticked down 0.1%, meaning that the three month average is 3.8%, or 0.3% higher than the 12 month low of 3.5% set one year ago:


This means that the Sahm rule is not close to being triggered.

And while average hourly wages for nonsupervisory personnel decelerated further to 4.2%, this remains very high by the standards of the past 40 years:


Remember that typically inflation increases faster than wages in the year heading into a recession. So with inflation at 3.1% YoY, this is not in play.

As I wrote last month, real aggregate payroll growth has a flawless record going back over 50 years of distinguishing expansion from recession. At 6.1% growth YoY, this is 3.0% higher than the last CPI reading:


It also made a new all-time high in real terms (not shown). Further, the monthly trend has been increasing in the past few months, so unless there is a big spurt in inflation, we are going to set yet another new record high this month:


All of this is simply potent evidence of an employment economy that is humming along.

Last month I wrote that the Household survey contained some numbers that were simply recessionary. Let’s update that.

In contrast to the Establishment survey, which showed 1.9% growth YoY, which is healthier than almost all times during the past 25 years, the Household survey remained stuck at 0.4% growth YoY. Here’s the longer term graph, normed to the current YoY numbers:


This metric does remain recessionary, but I expect it to resolve in the direction of the Establishment survey.

As indicated, the unemployment rate was 0.3% higher than one year ago. The U6 underemployment rate was higher by 0.6%:


Over the 30 year history of the U6 rate, this has heretofore meant recession. In the case of the U3 rate, there have been a number of instances where it just meant slow growth, although it too more often than not meant a recession was on the way.

Unless we start seeing weekly unemployment claims heading higher, I expect the unemployment rate to remain stable or even decline slightly in the months ahead. This will make the YoY comparisons better, removing that metric from one of any concern.

So while some poor spots remain, as I wrote on Friday, this employment report made the “soft landing” scenario the default setting going forward.