Friday, May 14, 2010

Weekly Indicators: Drowning in Oil edition

- by New Deal democrat

This week featured better than expected retail sales, industrial production, and capacity utilization. Wholeshale inventories increased, but sales increased even more, a very bullish indicator. The trade balance showed a bigger deficit, driven by higher imports. Consumer sentiment was in line with expecations, which weren't much.
The high frequency weekly data continued to show a strengthening recovery:

▪ The International Council of Shopping Centers (ICSC) reported same store sales for the week ended May 8 rose 4.3% from the year-earlier period. On a week-over-week basis, sales inched up 0.1%. Shoppertrak failed to report.

The Department of Energy reported that the price of gasoline remained steady at $2.90 per gallon. Gasoline demand for the week was up by several million barrels vs. a year ago. Inventory still is high and climbing. Gasoline remains only 10 cents under the psychological $3/gallon mark where I suspect there will be a significant bite. On the other hand, Oil plummetted through $75 a barrel this week and as of mid-Friday, was selling at about $71.50 (which appears to break an 8 month trendline to the downside). If that lasts, gasoline prices will come down significantly.

The BLS reported that last week's initial jobless claims totaled 444,000. The 4 week moving average was reduce to 450,500. This series remains in a downtrend, albeit a more muted downtrend than last year.

The American Staffing Association's weekly report showed that
During the week of April 26–May 2, 2010, temporary and contract employment increased 1.17%
This was the 12th straight week of increases in temporary hires. Increases in temporary staffing are a leading indicator, so this bodes well for the jobs report.

Railfax this week showed almost all sectors neither gaining nor declining over last week. Intermodal traffic, which is a proxy of imports/exports, did gain slighly compared with last year.

Finally, Daily treasury receipts continue their gains over last year. As of May 12, 2010, for the last 20 reporting days, $130.2B in withheld taxes had been collected vs. $123.7B last year, a gain of $6.5B or +5.2%. So far, May 2010 is also running ahead of May 2009, $57.8B vs. $54.8B.

April Retail Sales up 0.4%, March revised higher

- by New Deal democrat

Contrary to bearish expectations raised earlier this week, April retail sales came in higher, +0.4% over March and +8.8% (not adjusted for inflation) over last year.

Stripping away autos, sales also came in +0.4%. This was the 7th straight month of retail sales increases.

Further, March's already blazing hot retail sales were revised even higher, up +2.1% overall (vs. +1.9%), and up +1.2% ex autos (vs. +0.9%).

Of course, we don't know what "real" inflation adjusted retail sales will be, but it is almost certain it will remain a positive number. Since April 2009 witnessed a decline from March, this will bring YoY real retail sales closer to +6.0%. As I have pointed out several times, YoY real retail sales growth is a leading indicator for YoY employment growth. So this month's report increases the likelihood that we will have stronger job growth than generally anticipated.

Also, the fact that auto sales held up despite the ending of Toyota's sales incentives is a good sign that gasoline prices haven't yet caused consumers to pull in their horns on other spending.

Thursday, May 13, 2010

Yesterday's Market

Let's start with the dollar, because it is still catching a safety bid


After gapping down on Monday (a), prices have continue to move higher (b) out of concern for the euro. What's interesting is the dollar is catching the bid here.


The EMA picture is very strong as all the EMAs are increasing, prices are above all the EMAs and the shorter EMAs are above the longer EMAs. There is plenty of momentum (b) and money is flowing into the security (c).


There are two uptrends in place -- a and b. B is steeper -- which usually can't last as long as a gentler rise. Also note all the price gaps on the dollar (c).

A rising dollar should be hurting commodities -- and it is in the case of some like oil.


Note the prices moved lower (a), through the 200 day EMA. Prices have since been bunched at low levels (b) on very weak candles. The EMA picture is deteriorating (c) with the shorter EMAs (10 and 20 day EMA) moving through the 200 day EMA and the 50 about to move through the 200 day EMA. Momentum is decreasing (d) and money is flowing out of the security. There are several fundamental reasons for this drop. First, oil supplies are increasing and there is increased concern about Europe's ability to continue growing.

However, gold is bucking the trend.


Prices spent most of the first part of the year consolidating in a triangle consolidation pattern (a). After breaking out, prices fell back to test the upper line of the triangle (c). Prices then rose through previous resistance, gapping higher several times (d). Momentum is positive (e) and money is flowing into the security (f).

In the Treasury market, notice that while prices have fallen from last week's spikes, they are still consolidating above the 200 day EMA, indicating traders don't know whether to send this part of the market into a bear market or not. Also notice the IEFs and TLTs are still in an uptrend.


As for the equity markets, let's take a look at the SPYs


Prices dropped to the 200 day EMA (a), but hit upside resistance at the 20 day EMA (b). Also notice the shorter EMAs are either moving sideways or lower, indicating a downward bias.


In yesterday's trading, prices stayed in a pretty tight range for most of the day (a). But they started to fall near closing (b) in increasing volume (c).

Right now, the markets are still concerned about the European situation and the economy as a whole. The large caps stocks -- which should be doing well -- are having a hard time getting above key technical levels. The Treasury market is still trading above the 200 day EMA. gold is rallying and the dollar is catching a safety bid.

Jobless Claims Drop


From Bloomberg:

Initial jobless claims show improvement but only mild improvement for the labor market. Initial claims in the May 8 week slipped 4,000 to 444,000, a dip offset by a 4,000 upward revision to the prior week. But the four-week average is improving, down 9,000 to 450,500 for the lowest level since late March and the second healthiest level of the recovery.
Here's the chart:


To me, we're still moving sideways, although that has not hurt the job growth situation.

Remittances Increase

From the FT:

Immigrant workers in the US have started sending more money back to their home countries after cutting back sharply last year, yet another sign that the global economy is showing resilience.

Wells Fargo, the US bank, is expected to announce on Thursday that it saw a sharp rise in global remittances, especially from the US to Mexico, in the days leading up to Mother’s day, the busiest time of year for such money transfers.

The dollar volume of ­global remittances jumped 57 per cent compared with a year ago in the week leading up to the holiday, a record figure, said Daniel Ayala, head of Wells Fargo’s global remittance business, which is the largest among banks that provide the service.

About that Foreclosure Tsunami: Not So Much?

- by New Deal democrat

Last month I wrote about having a little debate with another blogger who viewed the March increase in foreclosures over February as the beginning of a new "tsunami." I countered that the data actually was more consistent with the crest of the foreclosure wave than the beginning of a new one, but that it could also be consistent with there being a lull during the "eye of the hurricane," and that,
if there is a new wave, or a "back side of the hurricane", then the percentages and the raw numbers of foreclosures ought to start increasing quickly. If, on the other hand, the 2nd derivative continues to be negative, then we ought to see foreclosures tip over into YoY negative percentages in the next few months, or certainly by the end of the year.
Well, this morning Realty Trac reported that April foreclosures
show[ed] that foreclosure filings — default notices, scheduled auctions and bank repossessions — were reported on 333,837 properties in April, a 9 percent decrease from the previous month and a 2 percent decrease from April 2009....

“There were two important milestones in the April numbers that show foreclosure activity has begun to plateau — but at a very high level that will not drop off in the near future,” said James J. Saccacio, chief executive officer of RealtyTrac.
So, here is the updated chart of year over year changes in foreclsoure activity for the last 13 months:

MonthYoY % changeactual foreclosures
04/2009+32 342,038
05/2009+18 321,480
06/2009+33 336,173
07/2009+32 360,149
08/2009+18 358,471
09/2009+29 343,638
10/2009+19332,292
11/2009+22 306,627
12/2009+15 349,519
01/2010+15 315,716
02/2010+6 308,524
03/2010+8 367,056
04/2010-2 333,837

That certainly looks more like the cresting of a wave than the beginning of a new one.

The genesis of the "second wave" story goes back to stories that started making the rounds in late 2006 noting that mortgage recasts and resets were due to hit in two waves: the first in 2007-08, and the second this year and 2011. I have always been a little chary of that notion, because, while in 2006 lots of people were still deluding themselves that "real estate only goes up!" by 2008 and certainly 2009, they had been disabused of that notion. Thus, a lot of those homeowners, who were probably deeply underwater, already let their houses go into foreclosure, or else worked out a refinancing before now.

With the April data, that scenario is looking more correct. Still, I'm not ready to declare the notion of a second foreclosure tsunami dead yet, because of the lagging nature of YoY data. But another 2 or 3 months like this and it may be "pining for the fjords" ....

Yesterday's Market


Let's start with the IWMs. We have a gap down on last Tuseday's open (a) followed by a general decline (b). Prices gapped higher on Monday after the announcement of the EU rescue package (d). Prices have rallied since, printing a strong upward move (d). From trough to peak there is nearly a 10% increase.

However


We don't see the SPYs rally with nearly the same vigor. First, after a gap higher (c) prices don't rally nearly as strongly, but instead stay within a general box with a slight upward tendency. In addition, the overall gain from Friday's close to yesterday's close is 5.4% 00 far lower than the IWMs.


At the same time we have a stock market rally, the Treasury market has fallen, gapping down (b) after a strong safety bid rally (a). Prices have moved lower, but not at a strong downward angle (c).

The next puzzle piece is the dollar:


After a very strong rally (b) that contained a lot of upward gaps (a), prices dropping on Monday (c). But they have since risen (d) out of concern for the long-term viability of the EU rescue package (d). As a result, we've see commodity prices stall.


Oil is consolidating after a strong price drop. Part of this is a stronger dollar, and part is increased US supplies along with concern about a drop in demand from the US.


Agricultural prices have dropped, but not as far as oil prices. But also notice the consolidation over the last several days.


Industrial metals have also consolidated, partly because of the dollar, but also because of concern regarding a drop in Chinese demand.

The verdict on the EU plan is clear:

Still, three days after the eurozone bail-out was launched, the verdict is becoming clearer: equities and bond markets like it but single currency traders and gold investors are less sure.

Wednesday, May 12, 2010

What Really Happened on Thursday?

From the Washington Post:

One way to look at what happened Thursday -- as described by a source deeply familiar with the exchange system -- is to think about U.S. stock exchanges as a series of pools connected by canals.

Each pool has buy and sell orders coming into it. If a pool cannot offer the best price in the market, it reroutes the order to the pool with the best price. This process happens all day long, and keeps the pools at a healthy balance with one another.

On Thursday, investors were selling shares aggressively because of concerns about a potential default by Greece and a financial contagion in Europe. As several stocks declined sharply under heavy selling pressure, the New York Stock Exchange, one of the largest pools, stopped or slowed trading in particular stocks.

As part of that process, the NYSE held on to "buy" orders, in the hopes that it could gather enough of them to meet the selling demand. "Sell" orders that came to the NYSE were rerouted to other exchanges, which were not required to slow trading. Those other exchanges were soon overflowing with sell orders and didn't have enough buy orders to meet them, leading to the rapid decline in prices.

The declines were exacerbated by Wall Street's heavy reliance on computer-trading programs that make lightning-fast decisions, based on complex mathematical rules, about what to buy and sell without human input.

Wholesale Inventories Increase

From the FT:

US wholesalers saw their sales and inventories rise in March, as businesses ramped up orders to meet growing demand, official figures showed on Tuesday.

Inventories rose by 0.4 per cent to $394.8bn, according to the commerce department. That was slightly lower than Wall Street estimated but marked the third straight month that inventories increased, bringing them to the highest level in eight months.

Rising sales outpaced inventories, climbing by 2.4 per cent to $348bn. Sales increased 15.8 per cent year on year and recorded the sharpest monthly rise since last November. In February, inventories were up by 0.6 per cent.

There are a few stand-out points from the report. As the article notes, sales outpaced inventories. That means we will probably see continued improvement in this area as inventories are still at low levels.

Secondly, lumber sales increase 16.3%. While lumber has sold-off over the last few weeks in sympathy with the general commodities sell-off, this is still a good sign going forward, especially for the housing market.

Here's a link to the census report.


Tuesday, May 11, 2010

Yesterday's Market


Prices had a nice rally yesterday (a), but then lost most of their gains in the afternoon(b). Prices did find support at the 200 minute EMA (c). But pay particular attention to the volume -- especially the blue line that denotes the 25 minute average of volume. The average was lower for the rally (d) than the sell-off (e).


The last two days, prices have printed very weak bars (a) right below the 10 minute EMA. In other words, prices are still in a bearish position. In addition, the shorter EMAs -- the 10, 2o, and 50 minute EMAs -- are moving lower indicating the short-term trend is down. Also note the volume situation (c). The heavy down days printed huge volume. But those numbers have backed-off for now.


Also note that riskier assets like the Russell 2000 are also below the EMAs (a). That tells us that traders are still hesitant about the markets right now.


Gold hit a record high yesterday, and the GLD chart looks very bullish. Prices are in a clear uptrend (a) and have moved through important resistance levels (b, c and d). There are also several gaps (e) in the rally. The EMA picture is very bullish with the shorter EMAs about the longer EMAs, all EMAs moving higher and prices above all the EMAs (f). Also note the heavy volume over the last 4 days (g). The only drawback to this chart is it is parabolic -- th erate of ascent is incredibly steep which no price chart usually maintains for long. In addition, the heavy volume could be a buying climax with the addition of an exhaustion gap. However, that's one possible technical interpretation. The fundamental picture is gold bullish as traders express their concern with the EU situation by purchasing safe assets -- here, gold.


Industrial metals have also dropped and are currently at a bottom. Prices started to drop with the bar (a), then moved into a sideways consolidation pattern at (b). Price then took a big move lower at (c) where prices gapped down twice in two days. Prices are currently consolidating at (d) on high volume (e) near the 200 day EMA. Also note the EMA picture (f): all the EMAs are moving lower, the shorter EMAs are below the longer EMAs and prices are below all the EMAs.

Fundamentally, this is the result of China tightening its money supply through and increase in reserve requirements. China is the largest consumer of raw materials for production.

Notice on the daily chart how prices are clustering around a 40 cent range from 19.80 to 20.20.

On Greece

From the NY Times:

Like the giant financial bailout announced by the United States in 2008, the sweeping rescue package announced by Europe eased fears of a market collapse but left a big question: will it work long term?

Stung by criticism that it was slow and weak, the European Union surpassed expectations in arranging a nearly $1 trillion financial commitment for its ailing members over the weekend and paved the way for the European Central Bank to begin purchases of European debt on Monday.

Markets rallied around the world in response to the concerted defense of the euro, a package that exceeded in size the United States bank bailout two years ago.

Major stock indexes in the United States rose about 4 percent on Monday, while a leading index of blue-chip stocks in the euro zone rose more than 10 percent. The premium that investors had been demanding to buy Greek bonds plunged. But by Tuesday, that rally appeared to have sputtered out, with many Asian markets down slightly.

And as details crystallized of the package’s main component — a promise by the European Union’s member states to back 440 billion euros, or $560 billion, in new loans to bail out European economies — the wisdom of solving a debt crisis by taking on more debt was challenged by some analysts.

“Lending more money to already overborrowed governments does not solve their problems,” Carl Weinberg, chief economist of High Frequency Economics in Valhalla, N.Y., said in a note. “Had we any Greek bonds in our portfolio, we would not feel rescued this morning.”


First, a bail-out was inevitable. Regardless of the philosophical debate regarding whether or not this creates a moral hazard, the reality is this: letting Greece or any of the others states involved fail leads to social unrest in a variety of countries across the European continent. This is a bad idea in good times; in shaky times it's fatal.

There are several issues at the heart of this problem.

1.) Politicians. The older I get, the more I hate all of them. Greece has been mismanaged in a variety of ways for a long time. And the reaction from the euro region has been just as problematic. It was obvious from day one that a bail-out was going to happen, yet the EU dallied, which, in the long run, led to a higher cost.

2.) I think the basic question for the EU was this: after being around for 10 years, do we really want to commit to going forward, or end the arrangement here?" Fundamentally, this is the biggest challenge the EU has faced. Part of their decision process was probably, "do we really, really want to defend the euro?" The answer was an obvious yes.

3.) Implementation: this will be tricky as the EU has to coordinate efforts of many countries. I think the phrase "herding cats" is appropriate.

4.) Holding the coalition together. At some point, I would expect at least on country to say, "no more." How the EU reacts when this happens will be very interesting to watch.

I do have to give the EU credit for the plan once they decided to get going. The size was impressive. Will it be enough? We'll see.

Happy Days Are Not Here Again

- by New Deal democrat

There is a fundamental point that I have made in nearly all of my economic writings over the last year. Because that point is frequently missed, as it has not been the focal point of my commentary, I wanted to place it front and center in this diary.

Both Bonddad and I called for the recession before it began. And both of us said it looked like the economy was bottoming a couple of months before it did. I went beyond that and spent a great deal of effort trying to determine when the jobs situation would turn around. Last September I said the bottom would be in November or December +/- one month -- an effort that turned out to be exactly correct. While others were -- wrongly -- mired in bearishness that was contradicted by almost all of the objective data around them, Bonddad and I chronicled the turnaround that has continued to the present.

What neither of us has said is that wage, income, employment or the unemployment rate, are anywhere near "good." Neither on of us is saying that "Happy Days are Here Again." In fact, Happy Days Aren't Here Again.

One of the frequent types of criticisms that Bonddad and I received last year after we said the economy was bottoming, was on the order of "It's not a recovery until jobs start to be added," or "It's not a recovery until unemployment starts to go down."

Well, we now know that the economy has been adding jobs since the beginning of this year -- 600,000 if you use the more common "establishment survey" which asks employers if they have been hiring or firing, and 1.6 million if you go by the less commonly reported "household survey" which asks consumers if they have been working during the last month. As of now, it still looks like last October was the peak for both the U3 and U6 calculations of the unemployment rate.

Yet we still receive complaints like "But you said the Recession was over, didn't you? The Recession is nowhere near over. Not with 10% unemployment." Criticisms like these highlight a fundamental disconnect between economic terms and common discourse.

While we both called for the reversal of the direction of the economy as a whole, and jobs in particular -- in other words the downward trend towards the abyss last spring reversed and became the continually improving upward trend that has continued until now -- neither one of us has said that the absolute level of economic activity, be it of household income, or jobs, or unemployment, or wages, are "good."

Thus while in economic terms the "Great Recession" ended late last year, I would agree with an amendment to the above criticism, that "The Hard Times are nowhere near over."

The problem arises from differing terms of frames of reference. For example, here is one good description of the business cycle:
In outline, the economic cycle is divided into 4 phases: (1) slowdown or a slowing economy, (2) recession, (3) [ ] improvement of the economic recovery and (4) expansion of the economic boom.


In the most straightforward economic sense, a recession is a period of declining economic activity. A recovery is a period of rising economic activity, that has not yet regained the peak GDP level before the recession. An economic expansion begins once the economy is expanding at a level that exceeds its highest GDP from before the recession.

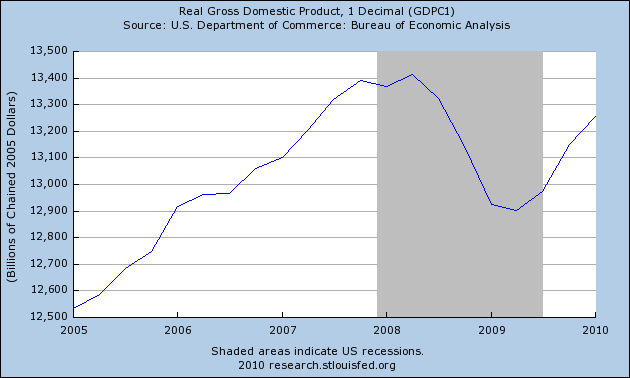
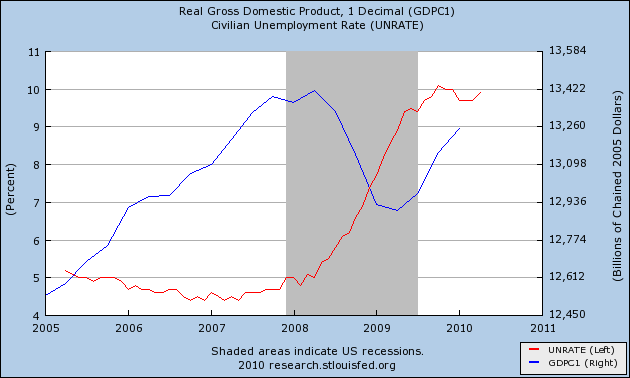
Thus in simple terms, we had a recession until sometime last summer. We are currently in a recovery because economic activity is expanding. We are not yet in an expansion because that positive economic activity as not yet exceeded its 2007 peak. Here's the relevant graph of real GDP that plainly makes that point:


But there is a disconnect between the language of economic cycles and the language of Main Street distress in a time like this. 
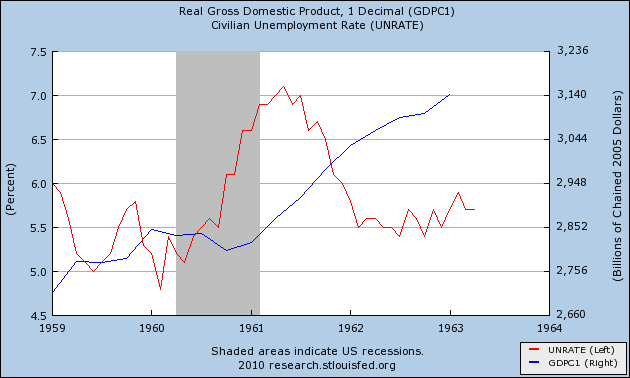
In most weak recessions, unemployment and wages might both pick up again shortly after the bottom of economic activity, and we might return to a level of at least nearly full employment within a year or two, as for example, in the a classic post-WW2 recession like 1960:


But after a severe recession, like the one that ended last summer, it can take literally years before economic conditions return to levels that are not full of distress. Thus, take for example this graph of GDP during the 1930s:


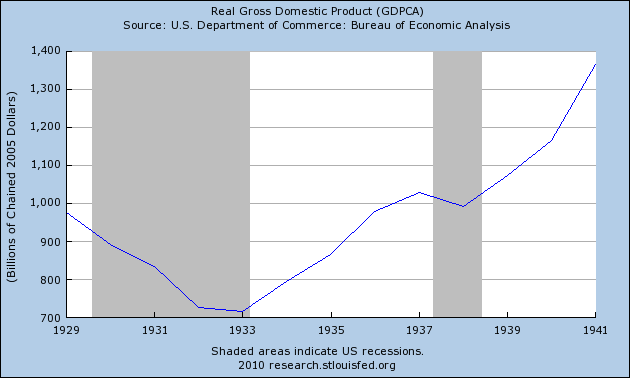
A business cycle economist might say that the Great Depression bottomed in 1933 and that thereafter until 1938, the economy was in recovery. But we call the entire 1930s "the Great Depression" because unemployment never dipped below 10%.

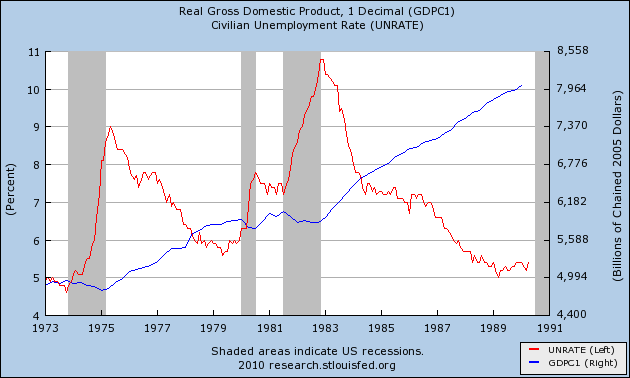
Similarly, in between 1974 and 1986 -- a period of over 10 years -- there was almost no period of time during which employment was anywhere near full (typically figured to be under 6% unemployment), even though there were recoveries and expansions after each of those recessions:


Further, since the year 2000 economic performance as a whole has been so poor that at no point has median household income of Americans ever exceeded the level attained in 1999:


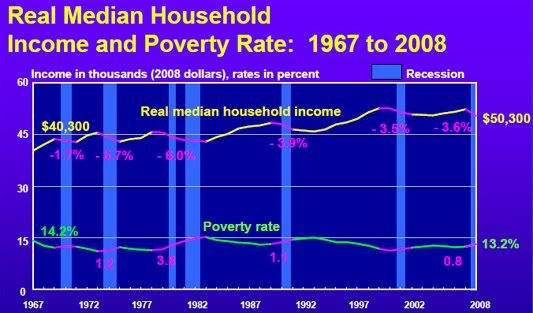
One decade has already been lost, and it appears that another lost decade may be beginning, with no end to the structural problems of wage stagnation in sight. Now, like the 1930s and 1970s, the economy is growing again -- it is in recovery -- and thankfully since the beginning of this year jobs are being added, but unemployment remains intolerably high at nearly 10% in U3 terms:


Thus a year ago, when there was derision for the concept of "green shoots", and people spoke scornfully of the "second derivative", i.e., the downtrend was just slowing down, it was correct to highlight the fact that the Leading Indicators pointed to a change in the direction of the trend itself (i.e., the "the first derivative"). What has not happened, and most likely will not happen anytime soon, is that the upward trend will reach the absolute level where income, wages, or employment are sufficient for the long-term economic well-being for average Americans.

Last year when it seemed nearly everyone thought we were falling into the bottomless abyss of Great Depression 2, it was not just valuable or correct, but vital to point out that conditions were bottoming and a change in direction was upon us. That being said, "Happy Days are not here again," and nothing I have written should be taken to mean that I say they are. Hard Times are still here, and probably will be for a substantial time to come. Until there is sustained real wage growth for average Americans, it will be difficult for America to have sustained economic growth.

-------

From Bonddad:

NDD makes a good point here. Let me add my two cents.

1.) The recession is over -- meaning growth has returned. In fact, it has returned for the last three quarters. As an aside, I've seen the economic blogsphere expend a tremendous amount of energy trying to deny this argument. At first it was "it's only one quarter of growth." Then there wasn't enough information to say there was a trend." Then the numbers were cooked because the government lies. It's been incredibly funny watching people try to move the facts around their preconceptions.

2.) Expecting a quick resolution to any economic issue after an incredibly severe recession is at best unrealistic and at worst an indication that the commenter lacks an understanding of basic economics. Case is point: 10% unemployment is not going to drop to 5% in the period of a year -- it's just not going to happen. Curing that problem will take years.

Personally, I think what has happened over the Great Recession is jobs that would have disappeared by natural attrition over a period of say 5-10 years were accelerated out of existence by the recession. For example, a manufacturer was thinking, "I'll continue to move in the area of automation at a slow rate." But then the recession hit and he said, "no time like the present to at least start getting rid of people."

3.) The primary reason people argue we're not in a recovery is a high unemployment rate. However, as I documented here the issue of long-term unemployment -- the issue which many people argue prevents this from being a recovery -- is a multi-faceted problem that revolves around two issues: educational achievement and economic area. Simply put, a large percentage of the jobs lost fall in construction and manufacturing. These are areas that typically attract employees with less than a college education. Hence, we currently have a high rate of unemployment for people without a high school degree and for people who are a high school degree but no secondary education. Neither construction or manufacturing is going to start hiring in a big way anytime soon. As such, long-term unemployment is an issue going forward.

4.) Additionally, jobs that don't need higher level educational skills are nowhere near as plentiful as before -- and will continue to decrease in this country. As a result, something has to be done in this area. Any by something, I mean something more than lip-service. As an example, NDD and I have both called for a new WPA program. The reason is simple. First, there is a high rate of unemployment among manual/blue collar laborers. This would get them back to work. Secondly, the nation's infrastructure needs serious rebuilding. Thirdly, this would be a fantastic investment that would promote future growth. For example, assume there are two cities that don't have a highway between them but alone they both grow. However, create and enhance the transportation facilities between the cities and you get a long-term (as in 30+ years) growth enhancer. It's really not that complicated.

5.) A large amount of the "this is a recovery, this isn't a recovery" is an issue of schematics and motivation. From an economic perspective, two quarters of growth indicates a recession is over -- that is a standard, text book definition. To argue it's not means either a.) you don't know basic economics, or b.) you have other motivations which are usually political. There is nothing wrong with political motivations -- just state them upfront and don't argue you're making an economic argument, because you're not. I don't mind people trying to drive the debate or narrative because that is part of the process. BUT -- I can't stand when these same people try to argue they are making a purely economic statement.

Yesterday's Market

Before we look at the charts, let's review last week. As the markets became more and more concerned about Greece's problem, we saw the safety trade go on. This means stocks fell and commodities fell while the dollar and bonds rose. The stock market was already in an overvalued position, so the sell-off wasn't surprising. However, we did see tremendous price movement in the equity markets over a short period of time on very high volume. The bond markets rallied through the 200 day EMAs, but did so in the face of a strong supply situation. And commodities sold-off in the face of strong Chinese demand. In other words, the bond and commodity markets acted counter to strong fundamentals.


Let's start with the IWMs, which gapped higher at the opening (a), but then traded within two bands (b and c) for the rest of the day. Prices did gap higher at the end of trading (d) on a volume spike (e) indicating traders wanted to position themselves for a possible up move in the AM.


The Treasury market moved lower with a big gap at the open (a), but then traded between two bands (b and c) for the rest of the day.

Notice that after the open on both of these charts, prices are pretty much range bound.

Here's the chart I think is most interesting:


The dollar gapped lower at the open (a) but then rose to just above the EMAs (b). Prices then fell to the 50% Fibonacci level reversed course and the rallied to just above the EMAs. From there, prices were caught in the EMAs for the rest of the day.

What's interesting here is the dollar caught a safety bid last week, largely at the euro's expense. However, the dollar rallied throughout the day, indicating there is concern about the European aid package. This tell could be very important in the upcoming trading day.

Monday, May 10, 2010

Bonddad Readers -- Smarter Than the Average Blog Reader

A few weeks ago, I asked for your opinions about whether or not I should continue my WSJ subscription. Several people suggested the Financial Times, which is a much better paper. Many thanks.

How Long Until Alan Grayson Starts Asking Stupid Questions?

From the NY Times:

On top of the unprecedented sum, the European Central Bank reversed its position of just a few days ago and said it would buy government and corporate debt. And the world’s leading central banks, including the U.S. Federal Reserve, announced a joint intervention to make more dollars available for interbank lending.


Several months ago, Alan Grayson was asking questions of Ben Bernanke, wanking wanting to know about "foreign loans." What Grayson was really asking questions about were swap programs between central banks -- fairly standard, run-of-the-mill central bank transactions. But according to Grayson, there was something sinister afoot that he had to get a handle on!

Grayson -- like most people in Washington -- believes his own press clippings. In reality, the man is an idiot. But expect a "serious line of questions" from the Representative from stupidity over this one.

April 2010 Leading Economic Indicators

- by New Deal democrat

The Leading Economic Indicators will probably print positive again for April

Most of the components of the Leading Economic Indicators are now known for April, and several revisions for March are also known, and it looks like it will be another decent month:

The yield curve is still positive but a little less so +0.30
Aggregate hours in manufacturing up again +0.11
ISM deliveries up +0.08
Stocks' 3 month performance up thru April +0.07
Building permits revised up for March, +0.08
Durable goods' nondefense orders March revision +.0.05
Consumer nondurables for March revised up+0.05

Jobless claims turned slightly negative, -0.05
Real M2 looks like it is still slightly negative again, -0.05
Consumer sentiment deteriorated yet again -0.03

Bottom line: it looks like April Leading Economic Indicators plus March revisions will net about +0.6, the thirteenth positive reading in a row. Because this increase is less than April 2009's, the YoY figure will decline slightly, but still up about 11%.

This means that economic growth will almost certainly extend into the third quarter.

Given the swoon in the stock market in the last two weeks and the expiration of the housing credit, however, May could be very interesting.

How Strong was April's Job Growth?

- by New Deal democrat

Dean Baker has a post up complaining about unnamed members of the mass media and others referring to the 290,000 nonfarm payrolls report Friday as "strong" growth. He points out that, ex census workers, the number is 224,000, which is certainly fair. But he also says that the proper way to evaluate the jobs number is by adjusting for population growth, and so doing, he says, it is not "strong."

Courtesy of the St. Louis Fred's new toy, we can divide the monthly growth/loss in jobs reported by the BLS by population, to give us jobs gain/lost per capita. Here it is from 1969 to the present (note, I omitted two outliers, one month in 1978 and also September 1982 which showed over.004 growth, the better to show contrast)::


Note that this graph includes the census jobs, since that is how the BLS reported the number. If we were to subtract those jobs, April's ratio would be reduced from about 0.0010 to 0.0008.

Either way, it seems to me, we can conclude the following:

1. April's job growth was much stronger than that coming out of either the 1991 or 2001 recessions.

2. April's job growth was strong compared with the last decade -- only some months in 2004 and 2005 were stronger.

3. April's job growth was NOT strong compared with job growth coming out of either of the two severe recessions of 1974 or 1982. In fact it was perhaps only half as strong as during those recoveries.

I should point out that, had I extended this graph all the way back to 1946, job growth during those recoveries up through the 1960s was even stronger per capita, often approaching 0.0030. This seems consistent with the idea that over the very long term, the US economy has gotten weaker as the US has made up less and less of the world's GDP since 1945.

From Bonddad:

Last week I wrote this regarding "think tanks:"

The phrase "think tank" is now an oxymoron, much like jumbo shrimp. Anyone who works at a "think tank" has an agenda, around which he/she attempts to bend the facts. This occurs on both sides of the political aisle in equal proportion. People who work at "think tanks" are either whores (they sell their intellectual abilities to the highest bidder), hacks (they are paid to say certain things at all times in order to promote a particular ideology) or politicians (meaning they have an agenda to obtain a political result). Some people fall into all three, meaning they earn the coveted "hat trick of intellectual whoredom." Either way, remember that when a "think tank" spokesman is moving their lips they are lying and if you offered them a higher salary they would tell you the sky is purple, the Astros are contenders and Bob Dylan can carry a tune with perfection.


I've seen enough of this type of garbage from both sides of the political aisle to say I don't read anything from a "think tank" anymore.

Yesterday's Market

Last week was a text-book case of standard flight to quality trading. Simply put, equities and commodities dropped while bonds, the dollar and gold rose. Let's go to the charts.

Let's start with a 5-day, 5-minute chart of the IWMs. This is the worst performing index of the DIAs, SPYs and QQQQs over the last week and 10 days, indicating traders are moving away from risk.


Prices gapped down lower on Tuesday, but spent the majority of the day in a tighter range (b). On Wednesday, prices formed a slight arc, opening lower, moving to a high in mid-trade, but then moving lower at the close. Thursday was the infamous "fat-finger" day, a day in reality the SEC and various exchanges are still trying to figure out. But the price decline continued into Friday.

Notice the continued escalation of selling volume toward the end of the week.

A standard bear market correction is considered to be 10% (give or take). Both the QQQQs and IWMs are already there. The QQQQ have fallen from a high of ~50.60 to a close on Friday of 45.63 -- a fall of 9.88%. The IWMs have fallen from a high of ~74.50 to a close of Friday of 65.44, or a fall of 12.16%.

Also note all indexes experienced a massive volume spike at the end of last week. Some might call thie a "selling climax," where a ton of sell orders hit the market as everybody simply says, "get me the hell out of here." Frankly, I don't think this is the end of the selling as Europe is still working out its issues.

Let's turn now to the Treasury market which caught a bid last week -- especially the long-term end of the curve.


The uptrend that started at the beginning of April (a) is still intact. However, last week we saw two gaps higher (b) -- indicating there was a tremendous bid in the market. Also note that prices are now above the 200 day EMA, indicating the TLTs are now in a bull market. The short-term EMAs are bullish -- all are moving higher and the shorter are above the longer. additionally, the 10 day EMA is about the 200 day EMA. Finally, like the equity markets, the bond market saw a massive spike in volume last week (d), indicating there was a tremendous flight to quality.


However, while there is tremendous momentum right now (a), the A/D line is dropping.


Note we see the same drop with the on balance volume indicator.

Let's turn to gold, which, like the Treasury market and the dollar, has caught the safety bid.


The EMA picture is very bullish: the shorter EMAs are above the longer EMAs, all the EMAs are moving higher and prices are above all the EMAs.


Prices broke out of a triangle consolidation pattern (a), returned to the top line of the pattern as a test (b) and then broke through previous highs to move higher. Also note the higher volume over the last few days as money has moved into the market.

Finally, we have increasing momentum (a) and a big influx of money into the market (b).

Let's move to the dollar.


First, the dollar is in a clear uptrend (a). The EMAs are bullish -- shorter above longer, all moving higher and prices above all the EMAs. Prices have moved through upside resistance (c) and have printed some large gaps over the last week on high volume. BUT


The A/D line is decreasing and the Chaiken money flow indicates that money is moving out of the security. What does this mean?

Technical divergences -- situations when prices and indicators are moving in different directions -- can indicate a possible change in trend. Here, we have two declining volume indicators, which tells us the breadth of the dollar rally might not be as wide as we would like. Also note the last gap could be an exhaustion gap -- the final big upside move before a trend changes. If so, we'll know soon enough.