- by New Deal democrat
There’s no significant new economic data today, so let’s take an updated look at the downstream effects on the supply chain and retail sales so far from T—-p’s tariffs.
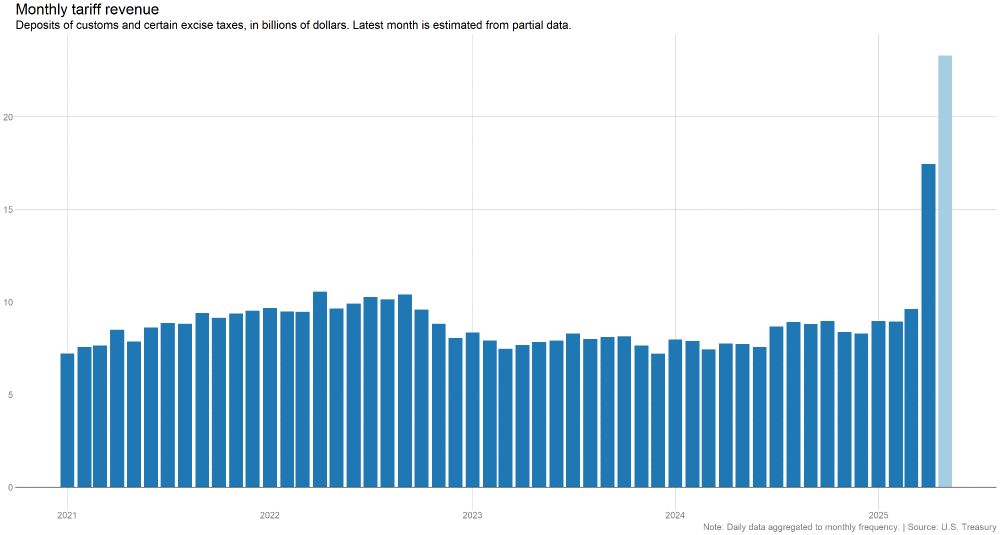
To begin with, at least some of the tariffs are indeed in effect. Here is a graph from Ben Casselman of The NY Times:
Not only was there a sharp increase in April, but in May so far he reports that the government is on track to collect $23 Billion in tariffs, which he says is about 3x the revenues compared with May last year.
That revenue is coming out of corporate profits and/or consumers’ pockets, depending on how much companies are able to pass on vs. eat.
Let’s start looking at the supply chain with this graph from Torsten Slok of Apollo Investments via Carl Quintanilla showing trans-Pacific ships sailing from China to the US:
For the last three weeks, this shipping has been at or very close to 12 month lows, despite the “pause” in the trade war. As one wag said, “it’s almost as if companies cannot make any near-term plans” because the situation might change at any moment.
Downstream of that are arrivals at US ports. The port of LA updates its inbound container count every week, including scheduled arrivals over the next three weeks. Here is its latest, through June 14:
Since the week of April 26, with one exception - that corresponds with the brief revival of trans-Pacific shipping in early May - every week has shown a decrease from the corresponding week in 2024. Cumulatively so far in the seven weeks since, scheduled arrivals have totaled 611,000 TEU’s, vs. 679,000 in 2024, an exact -10.0% decline.
Once containers arrive at US ports, the next step is shipping via rail (usually) or truck (typically for shorter hauls). While I am not aware of any weekly or similar data for truck volumes, the AAR does update intermodal traffic every week. Here is its YoY data for intermodal rail traffic through the week of May 3:
Note that rail traffic typically bottoms at about the end of March, and begins rising all the way towards the Holiday Season beginning in April. By contrast, this year intermodal traffic continued to trend downwards in April.
And although it isn’t shown in the graph above, in the two weeks since that trend has continued. For the week of May 10 there were 273,000 intermodal containers, a YoY increase of 5.7%. For the week of May 17 it was 262,000, a mere 0.3% increase YoY.
In May and June of last year, weekly rail intermodal loads averaged about 285,000. If we extrapolate from the -10% YoY decline in port traffic, that brings us down to about 255,000 loads. The AAR will report traffic for the week of May 24 tomorrow, and it could very well show the first outright YoY decline.
What about producers of goods and services in the US? For that we can turn to the regional Fed manufacturing and non-manufacturing indexes. So far in May All 5 regional manufacturing surveys have been reported, and all but the Texas services survey. Both types of surveys showed improvements from April, by an average of +2 (for new manufacturing orders) and +4 (for services conditions) respectively, but the actual conditions of both showed continued contraction, by -6 and -9 respectively. In other words, both sectors were contracting, but at a slower pace.
I am also unaware of any high frequency data on store inventories. But Redbook does publish weekly retail sales updates, and updated for the week of May 24, showing a 6.1% YoY increase:
This continues the trend of comparatively strong YoY increases that began in April. Undoubtedly some of this was front-running by customers who decided to make anticipated purchases in advance of tariffs. But by now some of this increase is probably consumers’ paying the increased costs due to price hikes.
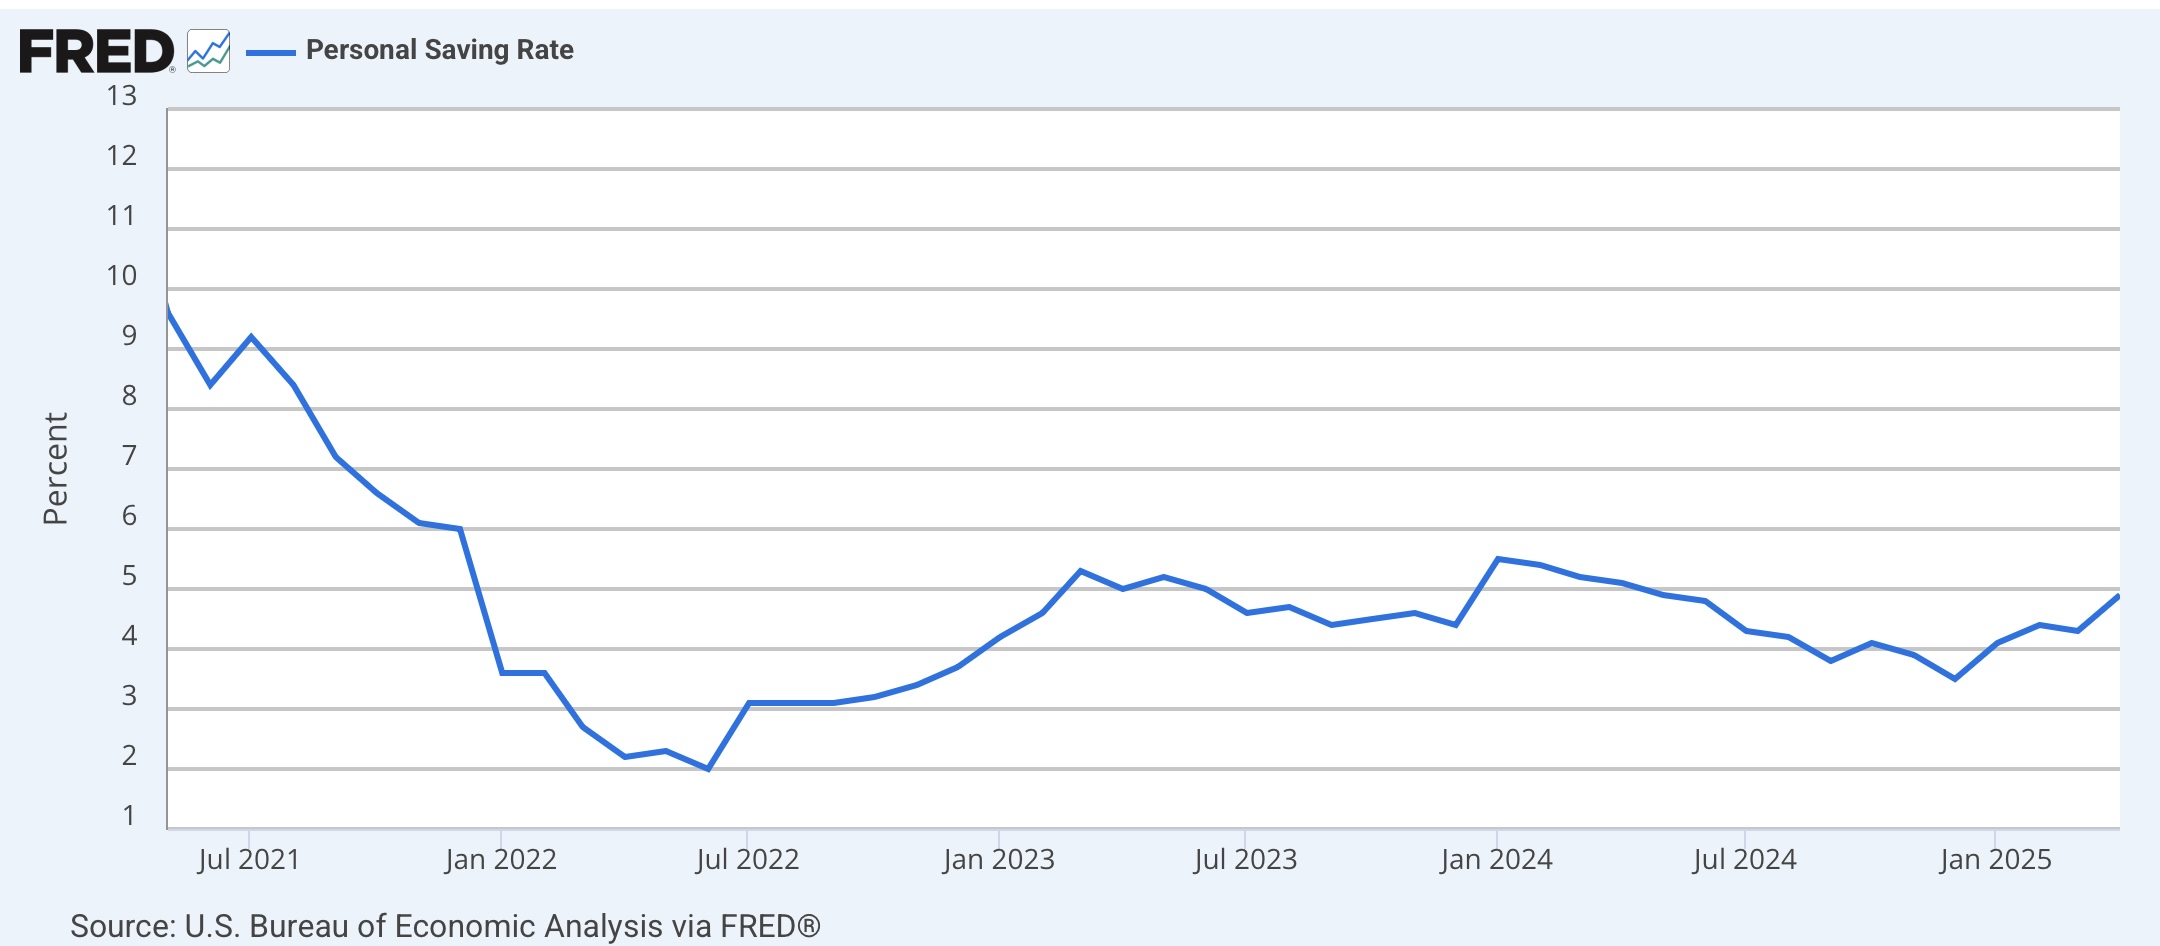
It’s possible that Redbook’s universe is mainly non-durable purchases. I mention this because I had a conversation over the weekend with a neighbor who is in charge of the service department at a local Honda dealership. He reported that after a strong early April, bookings for repairs fell sharply in the past few weeks, which he attributed to customers being unwilling to incur major expenses in view of impending general tariff-related price hikes. If that is true, it *may* show up in Friday’s personal spending report, but since that will be for April more likely it will not show up yet.
Finally, let me close with an update of my “quick and dirty” economic forecasting indicator. This consists of (1) whether the stock market is down YoY; AND (2) whether the four week average of initial jobless claims is higher by 10% or more YoY. If both of those obtain for more than a couple of weeks, it is very likely that a recession is about to start. Here it is:
No sign of a tariff-palooza! recession is indicated. At least, not yet.