Saturday, October 13, 2018
Weekly Indicators for October 8 - 12 at Seeking Alpha
- by New Deal democrat
My Weekly Indicators post is up at Seeking Alpha.
Last week the bond market fell out of bed. This week the stock market followed. But some other short leading indicators have softened as well.
As always, not only is this a great way to measure the economy on an up-to-the-moment basis, clicking over and reading also rewards me just a little bit for the work I put in to tell you where the economy is headed.
Friday, October 12, 2018
Housing's most difficult comparisons in years begin next Wednesday
- by New Deal democrat
After a real quiet week for news, next week we get retail sales, industrial production, the JOLTS report, existing home sales ... and housing permits and starts. The week after, real residential fixed investment will be reported as part of Q3 GDP. Permits and residential fixed investments will have some of the most challenging comparisons in a long time.
Here's why. First, here's a graph of 30 year mortgage rates:

These have broken out to highs not seen since early 2011.
Here's what that means for a graph that I have run many times: the inverted YoY change in mortgage rates (blue) vs. the YoY% change in single family permits (red, divided by 10 for scale). I've also added 0.75% to the inverted YoY number for mortgage rates to account for the positive effect demographics have had on the comparison over the last six years. Remember that permits tend to follow mortgage rates by about 6 months:

In short, even giving the housing market credit for a demographic boost, we are probably going to see the YoY change in building permits for single family houses go to roughly zero. Since (not shown) permits surged between last October and this March, the comparisons will be quite difficult.
Another housing comparison that is going to get much more challenging starting next week is purchase mortgage applications. Here's a close-up on those over the last five years from Ed Yardeni's blog:

For most of the last two months, purchase mortgage applications have been compared with some of the weakest numbers in all of 2017. Beginning with the report next Wednesday morning, for the remainder of the year, almost all of the comparisons except for a couple of weeks will be against index values of 240 or higher (this past week they were reported at 239). And the latest surge in mortgage rates hasn't really shown up in these yet.
The bottom line is that housing is facing probably the most difficult set of circumstances in that market since prices bottomed in 2012. And the acid test begins next Wednesday.
Thursday, October 11, 2018
Subdued September inflation means real hourly and aggregate wages grow
- by New Deal democrat
Courtesy of subdued gas price increases this year vs. one year ago, overall consumer prices rose only 0.1% in September vs. 0.5% one year ago (and 0.3% over the last two months vs. 0.9% one year ago). As a result, YoY CPI growth is down to 2.3% vs. 2.9% several months ago, and that means that "real" wages increased, despite no movement in growth nominally YoY.
With that background, let's update real average and aggregate wages.
With that background, let's update real average and aggregate wages.
Since nominal wages for non-managerial workers are up 2.7% through September, this means that real wages, which had been flat, have grown in the last few months by +0.4% YoY:

In the last 2 1/2 years, real wages had been essentially flat. The last couple of months moves the needle a little bit:

Further, because employment and hours have increased, real *aggregate* wage have continued to grow:

Real aggregate wages -- the total earned by the American working and middle class -- are now up 26.2% from their October 2009 bottom.
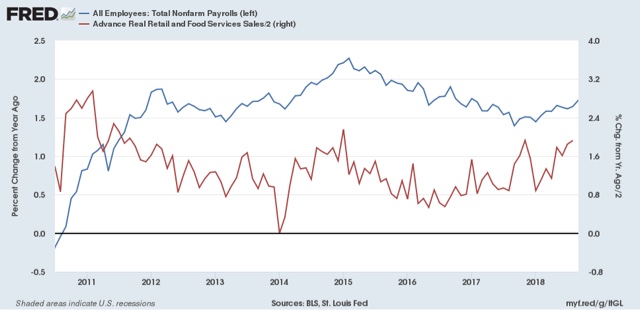
Finally, because consumer spending tends to slightly lead employment, let's compare YoY growth in real retail sales, first measured quarterly (red), with that in real aggregate payrolls (blue):

Here's the monthly close-up on the last 9 years
:

Retail sales won't be reported until next week. They grew +1.9% nominally last September, igniting some very good YoY comparisons that have been reflected in an acceleration of YoY employment growth as well. I am expecting a substantial downshift in retail sales next week, which in turn is likely to lead to a substantial downshift in employment reports beginning in a few months.
Wednesday, October 10, 2018
Tracking Trump's trade wars: inventories and intermodal traffic
- by New Deal democrat
Here's something I thought I would start to track: looking for evidence of the effects of Trump's trade wars on manufacturing and distribution.
Producers and distributors aren't simply going to sit back and wait to absorb new tariff expenses: we should expect them to engage in as much "front-running" as possible, importing the goods and commodities likely to be affected by the tariffs early, and building up inventories that can be sold at the lower, pre-tariff prices. Once the tariffs kick in, the front-running would end, leading to a reversal of the pattern.
Two places we would expect that front-running to show up are in manufacturers and wholesalers inventories, and in the intermodal units that are typically used for cross-ocean shipping. Let's take them in order.
First, as a general rule sales lead inventories. Sales peak first going into recessions, and bottom first coming out. It is likely the very fact that sales turn that is the signal for producers to add or subtract from inventories. Here's that relationship for wholesalers over the past 25+ years:

Front-running would differ from that, because we would continue to see increased sales, but we would see an even bigger increase in inventories. Here are the monthly percentage changes in sales (red) and inventories (blue) for manufacturers over the past several years:

And here, with the red and blue reversed (sorry!) for wholesalers:

For manufacturers, only the very last month fits the patterns, and could easily represent catching up from the big inventory drawdown the month before. But for wholesalers, the last three months fit the pattern. as sales increase, but inventories increase more.
Secondly, a good way to track intermodal traffic is via the weekly railroad report, which breaks traffic down into intermodal units and non-intermodal carloads. Here's what intermodal traffic over the last several years looks like:

We have seen big YoY gains in intermodal traffic in the last 6 months, but not particularly more than the YoY gains from 2016 to 2017 - except possibly in the last 2 weeks of September.
And here is the data for the latest week, just out today. We have suddenly gone from 10% YoY gains in both intermodal and carloads to gains of less than 2%:

I'll continue to keep track of this, to see how Trump's trade wars impact the economy in as close to real time as realistically possible.
Tuesday, October 9, 2018
Is the taboo against raising wages beginning to break?
- by New Deal democrat
It's a *really* slow news week for economic data -- just producer and consumer prices tomorrow and Thursday. Even JOLTS doesn't come out until next week.
But there was one little nugget of good news this morning: the NFIB, which represents small businesses, came out with their September report, and there was some good news about wages: more small businesses -- 37% -- said they *actually* raised wages in the last 3 months, than during any other 3 month period over the last 30 years:

If the taboo against raising wages is finally breaking, that is good news. Now we have to see if it is confirmed by actual data on wages.
One small gray cloud on the horizon is that actual hiring has decelerated in the last couple of months:

Too soon to know if this is a trend or not, but as I have indicated frequently in the last couple of months, I am expecting a slowdown by next summer. The two big harbingers of that would be a decrease in real retail sales, which will be reported next wee, and a deceleration in employment growth
Monday, October 8, 2018
Scenes from the September jobs report
- by New Deal democrat


Leaving aside wages, there was lots of sunshine in September's jobs report, although there were a few gray if not dark clouds on the horizon. Here's a look at each:
1. Weekly jobless claims did lead the unemployment rate
1. Weekly jobless claims did lead the unemployment rate
Two weeks ago, I wrote that the new 40+ year lows in weekly initial jobless claims forecast new lows in the unemployment rate. Here's what I said:
[I]nitial jobless claims tend to lead the unemployment rate by a few months. Here's the 50 year+ graph:
If jobless claims decline, then over the next 2-3 months it's a good bet that the monthly unemployment rate will decline too.
And that it did. Here's the updated graph of the last few years:
You have to go back half a century, to 1969, to find an unemployment rate lower than September's.
2. Involuntary part time employment remains on trend
While the number of persons working part-time because they could not find full time work rose slightly from August, the declining trend remains intact:
A hair under 3% of the civilian labor force is involuntarily employed part time, only 0.7% above its modern low. It shows no signs of bottoming out yet, which is particularly positive since typically this series moves sideways before increasing in advance of a recession.
3. Consumption leads employment: YoY employment is still accelerating
As I have written many times over the years, real retail sales leads jobs growth by about 3-6 months. YoY real retail sales have accelerated over the past year, and jobs growth has accelerated in response:
That big spike from a year ago is last September's +1.3% real retail sales growth in a single month, in response to the hurricanes. Next week's report on this September's number will be particularly important to see if the accelerating trend in consumption comes to an end.
4. Fraying at the edges #1: an increase in people not in the labor force who want a job now
But if the lion's share of the data in the jobs report was positive, there were several measures which indicate some fraying at the edges, which is typically where weakness starts.
In that vein, the number of discouraged workers who haven't been looking for a job at all, but who say they want a job now, made a low half a year ago at just under 5.1 million people:
While it declined in September compared with August, the fact that it has turned up is a caution flag going forward.
5. Fraying at the edges #2: growth in goods producing jobs may be stalling
The YoY growth in goods-producing employment is an excellent leading indicator. It is very un-noisy, and has turned down well in advance of all but two of the recessions (1973 and 1981) in the last 80 years:
In fact, this series is so un-noisy that even a decline for just 2 months in a row has almost always signaled a change in trend.
Well, two months ago this made a 28 year high at 3.3% as revised, in line with the many red hot manufacturing data points this year. It backed off in August, but then rose again slightly to 3.2% in September. While there has been no definitive change in trend, the rate of acceleration in the growth of goods-producing jobs has slowed down:
As I have written a number of times in the last few months, the bulk of the long leading indicators forecast a significant slowdown in the economy by roughly next summer. If growth in goods-producing jobs were to top out and start to decline, that would be an important confirmation of the forecast.
Sunday, October 7, 2018
Here is something to make you smile this weekend
- by New Deal democrat
Rodney Dangerfield's gravestone:

Subscribe to:
Posts (Atom)