Saturday, August 17, 2019
Weekly Indicators for August 12 - 16 at Seeking Alpha
- by New Deal democrat
My Weekly Indicators post is up at Seeking Alpha.
The data continues to be dominated by a steep decline in long term interest rates. These have both inverted further portions of the yield curve and reinvigorated the housing market.
As usual, clicking through and reading should not only be educational for you, but put a penny or two in my pocket to reward me for my efforts.
Friday, August 16, 2019
Positive July housing permits and starts
- by New Deal democrat
The housing starts and permits report this morning for July adds to the positive data looking forward to H2 2020 (or, possibly, less bad - but that’s another discussion).
First, here are overall permits (red) and starts (blue):
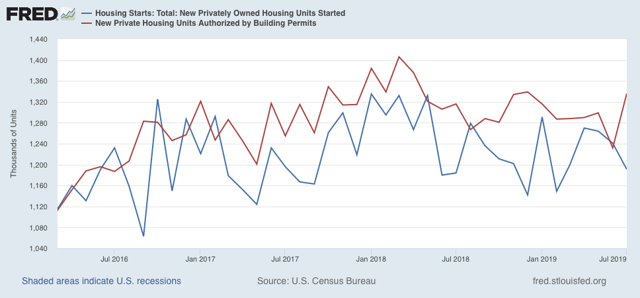
While the very volatile starts declined, the slightly more forward looking and less volatile permits rebounded off their low to a 6 month high.
The less volatile single family permits (red) and starts (blue) were even more positive:
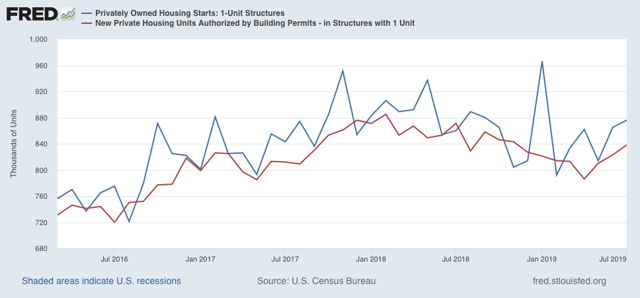
Single family starts were at an 8 month high. The more forward looking and least volatile single family permits made a 9 month high.
Lower interest rates are now clearly feeding into the housing construction market. This is a positive 12+ months out.
There are two issues. The first is whether house prices advance so quickly that they eat up the savings purchasers would otherwise pocket. This is the “housing choke collar” theory I have recently advanced. The second is that this in no way negatives the potential for a recession this winter, much as the advance in housing in 2000-01 did not prevent the 2001 producer led recession.
Thursday, August 15, 2019
Industrial production, jobless claims, and retail sales
- by New Deal democrat
As I noted this morning, a slew of important data was released. Let me deal with the “normal” weekly and monthly data in this post.
First, industrial production continues to languish, down significantly from the end of last year, whether measured in total or just as to manufacturing:
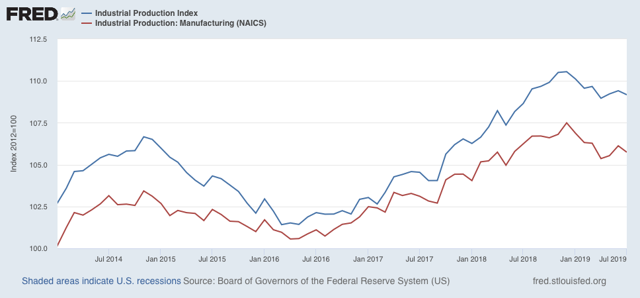
The saving grace here is that it has not declined as much as it did during the 2015-16 “shallow industrial recession” which was not sufficient to cause the economy as a whole to contract.
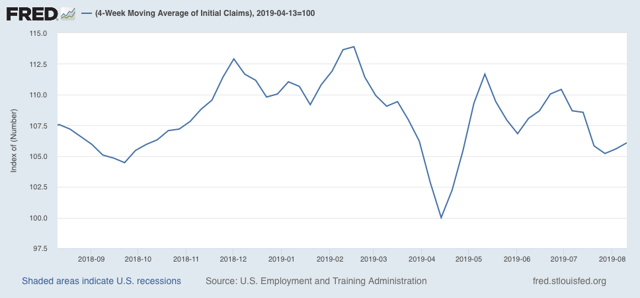
Second, initial jobless claims rose, and are (slightly) higher YoY for the first two weeks of August:
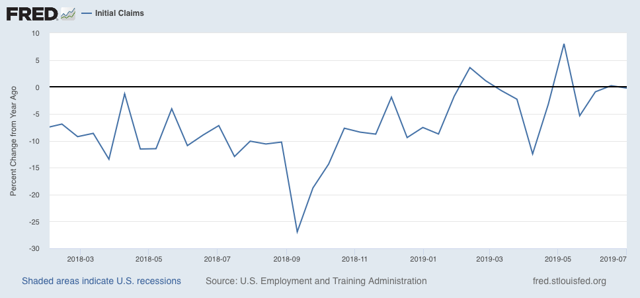
The 4 week average is only about 6% higher than their trough this past April:
The four week average of continuing claims, which is much less volatile, is about -2.5% lower than it was a year ago. Should it turn higher YoY, that would be a yellow flag; if it were to reach 10% higher, that has always meant recession:
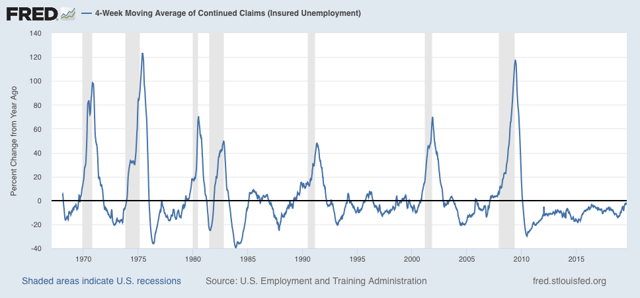
For now, jobless claims are just showing a slowdown.
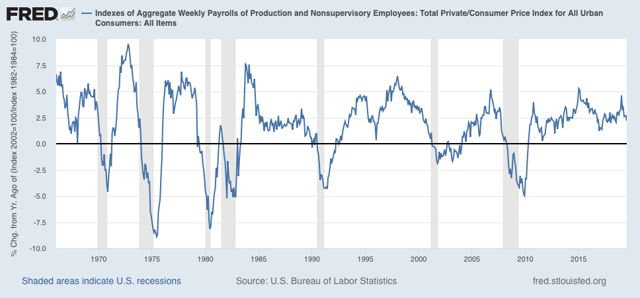
Finally, real retail sales (blue) rose 0.4% to another new high in July:
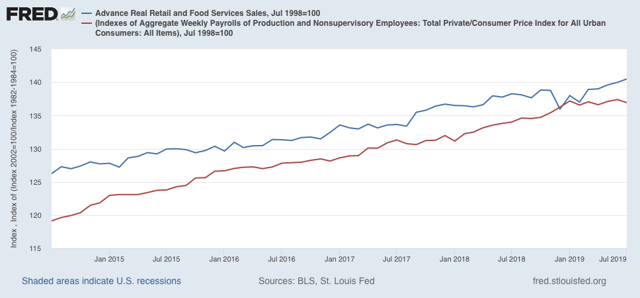
Here’s the longer term look for the past 20+ years:
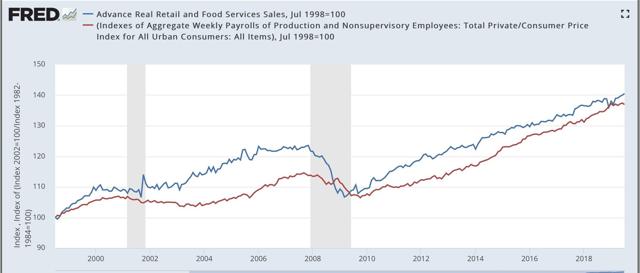
The red line is real aggregate payrolls. Since sales tend to lead payrolls (note the former flattened out about 6 months before the latter prior to each of the last two recessions), this is an encouraging sign.
A couple of other recent data points also suggest that the consumer continues to be in decent shape. The NY Fed’s report on consumer debt delinquencies was released this week, showing a slight decline to expansion lows:
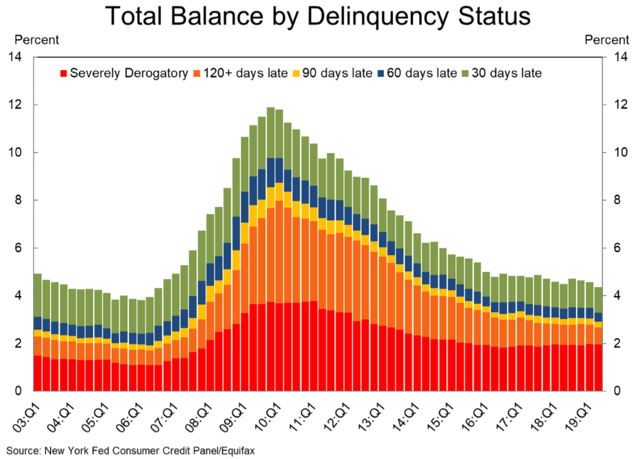
If the consumer were getting stressed and ready to cut back, I would expect this metric to be rising.
Also, the American Banking Association’s report on consumer bankruptcies showed only a small uptick from expansion lows during the 2nd Quarter:
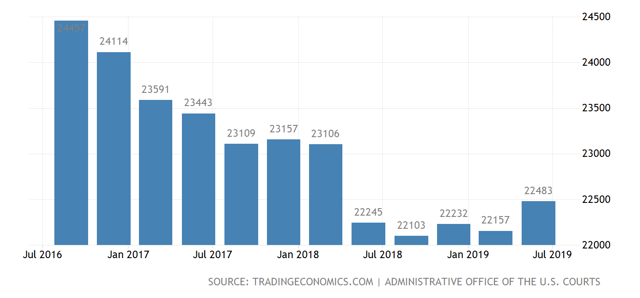
Right now the consumer, relatively speaking, is doing pretty well. If we are on the cusp of a recession, it is almost certainly going to be producer led.
Quick hits on a major Thursday economic news blitz
- by New Deal democrat
There has been a ton of significant economic news this morning. I’m not going to be able to get to all or even most of it in depth. So I am going to leave a quick rundown here.
Starting with the positive:
-nominal retail sales up +0.6%, up +0.3% in real terms, up +0.2% Per Capita. This is another new high and suggests the US consumer continues to be in good shape (relatively speaking). Note that much of this apparently has to do with Amazon “Prime Day” purchases, and if the seasonal adjustments are off, this could easily be a false positive.
-Both the NY and Philly Fed indexes higher, including new orders for both. No indication here that manufacturing is rolling over.
-The manufacturing component of industrial production higher, again suggesting that manufacturing is not rolling over (although this is still below its December high point).
The negative:
- overall industrial production was negative - again! Industrial production as a whole has remained in a decline off its high in December of last year. This is the premier coincident economic indicator, even more than payrolls.
- initial jobless claims higher YoY on both a weekly and monthly measure. It is not more than 10% higher than its recent lows, so overall is a neutral not a negative.
- the 2 year to 10 year treasury spread briefly inverted again this morning, although once again it has rebounded to positive.
-a MAJOR negative: unit labor costs for the last five years revised higher, meaning that adjusted corporate profits (a long leading indicator) peaked back in 2014, and were almost 15% lower than that as of Q1 of this year. The placeholder proprietors income is also slightly lower through Q2 than its peak in Q4 of last year.
I’ll try to post one or two things in detail later.
Wednesday, August 14, 2019
A note on the stock and bond markets
- by New Deal democrat
No economic data releases today, but a little kerfluffle in the markets.
First of all, in case you missed it, the 10 year to 2 year bond spread briefly inverted early this morning. Here’s the screenshot from CNBC:
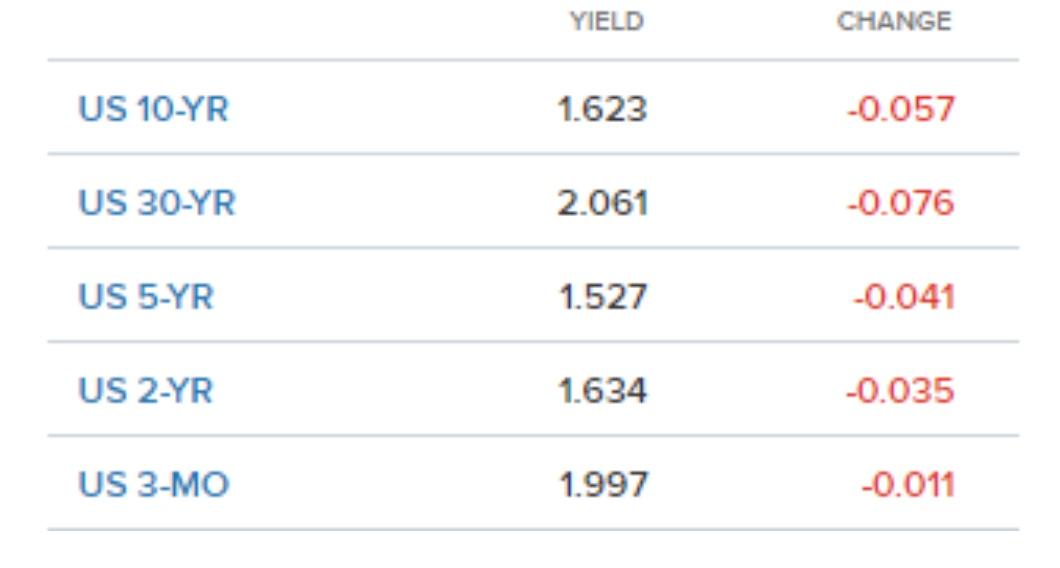
As I say, it was brief. As I type this, the spread has reverted to normal.
But another significant spread inverted yesterday, and has remained inverted today: the 30 year bond vs. the Fed funds rate. The Fed funds rate is currently at 2.12%, and beginning yesterday afternoon, the 30 year bond yield went lower than that. As I type this, the long bond is yielding 2.05%, an all-time low. Here’s the lifetime chart:
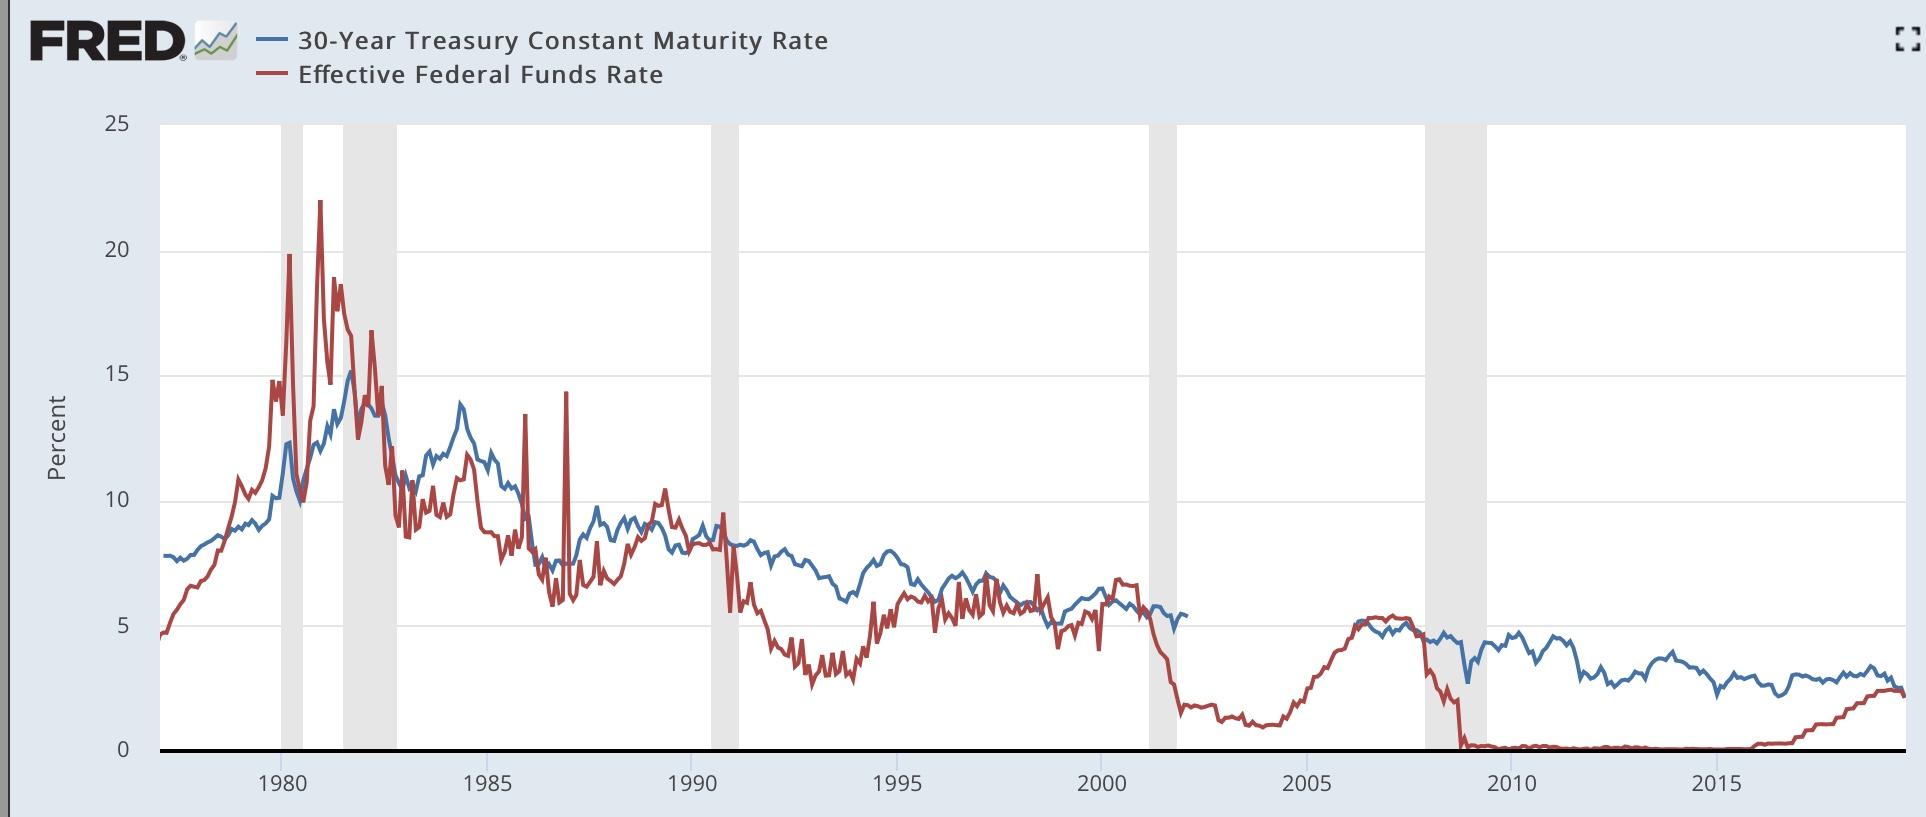
As a caution, note that this spread also inverted for a few days several times in the mid-1980s and mid-1990s, as well as for a month and a half in 1998, without signaling recession. Most importantly, the Fed acted swiftly in 1998 to cut rates.
As it did last December when the first portions of the yield curve inverted (in the 2 to 5 year range), the stock market is taking this badly:
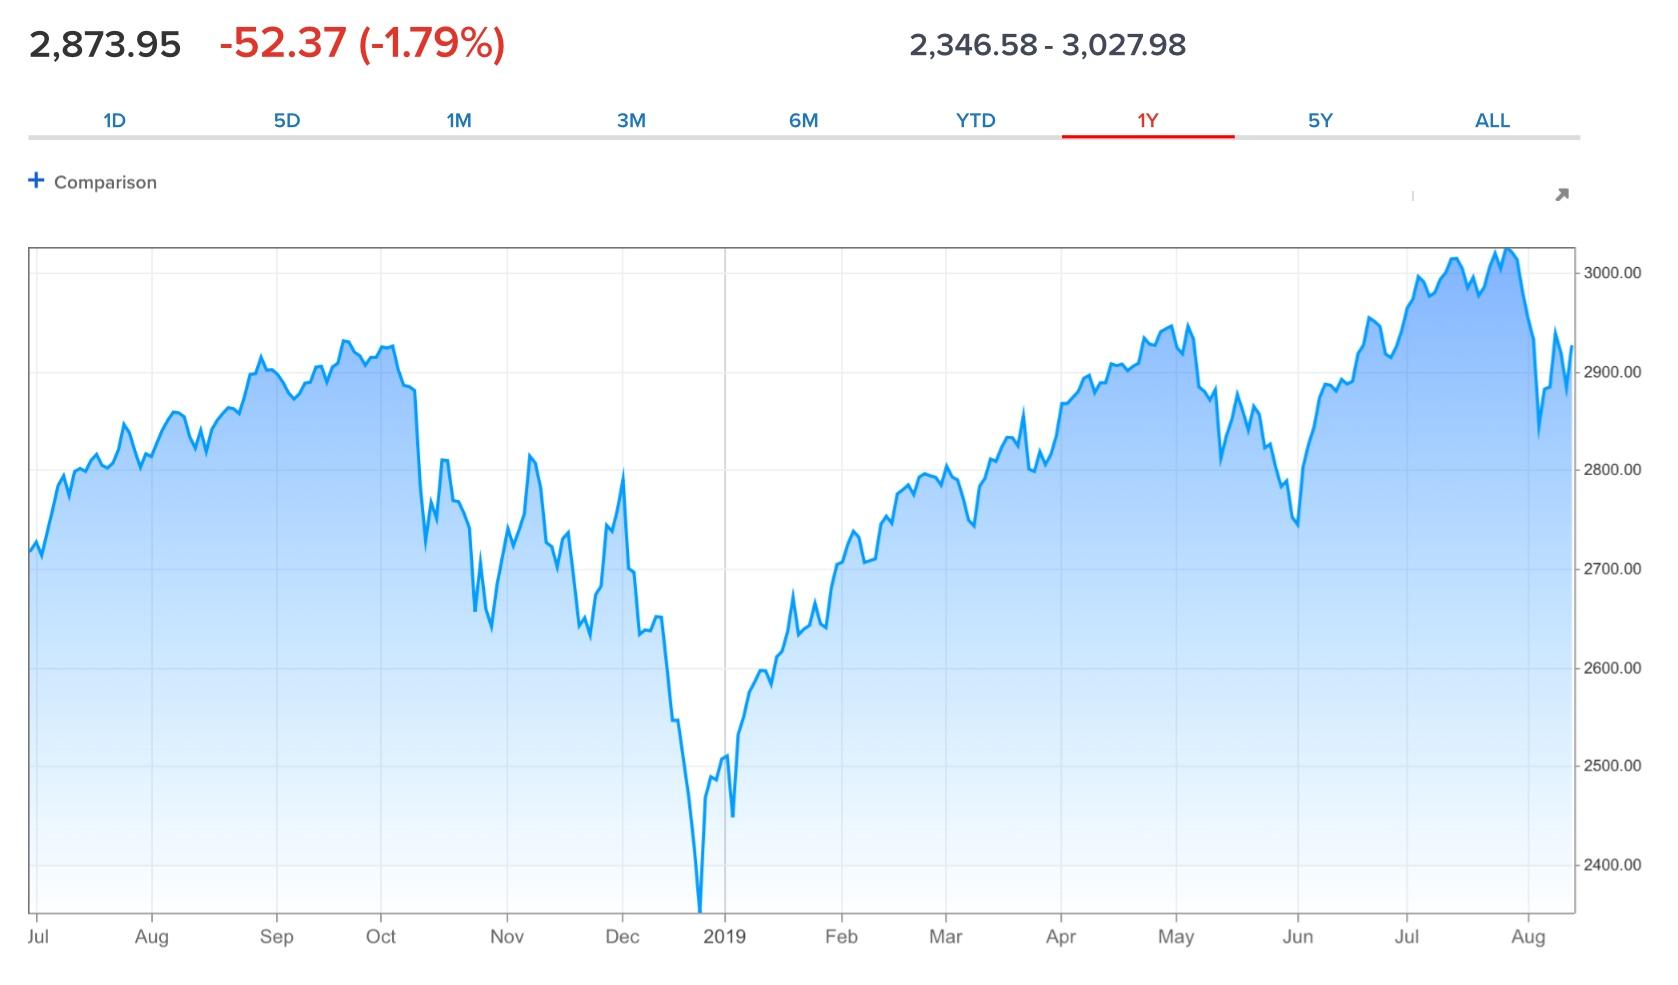
The stock market is up over 20% since that bottom.
Here is my takeaway from this morning:
1. The more portions of the bond yield curve invert, the stronger the negative signal.
2. BUT, we still have the counter-examples of 1966 and 1998, where the inversions were met with fiscal stimulus (1966) or prompt interest rate cuts (1998) and no recession occurred.
3. Even if the yield curve is signaling a recession in the near future, it doesn’t mean there is one arriving imminently. A strong stock market sell-off like December’s would be an overreaction.
4. If the further yield curve inversions mean a recession this coming winter, we ought to be seeing signs of either consumer weakness in retail sales (reported tomorrow) or corporate profits (reported for Q2 in two weeks in the revised GDP report).
I plan on doing a more detailed look at the consumer tomorrow after retail sales for July come out.
Tuesday, August 13, 2019
Real average and aggregate wage growth for July 2019: yellow flag for aggregate wages
- by New Deal democrat
Now that we have the July inflation reading, let’s take a look at real wages.
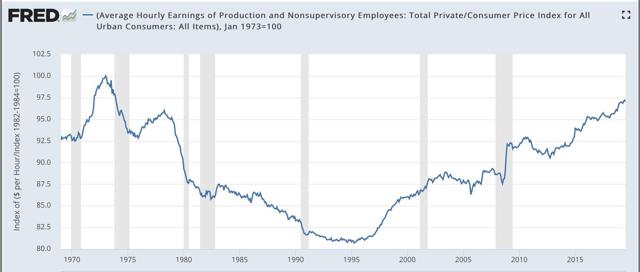
First of all, nominal average hourly wages in June increased +0.2%, while consumer prices increased +0.3%, meaning real average hourly wages for non-managerial personnel decreased -0.1%. This results in a slight decline of real wages to 97.0% of their all time high in January 1973:
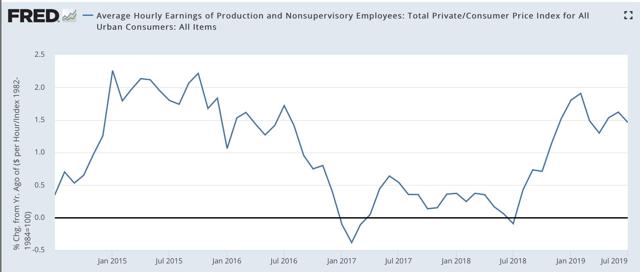
On a YoY basis, real average wages were up +1.5%, a decline from their recent peak growth of 1.9% YoY in February:
Updated through July, real aggregate wages - the total amount of real pay taken home by the middle and working classes - are up 28.7% from their October 2009 low:
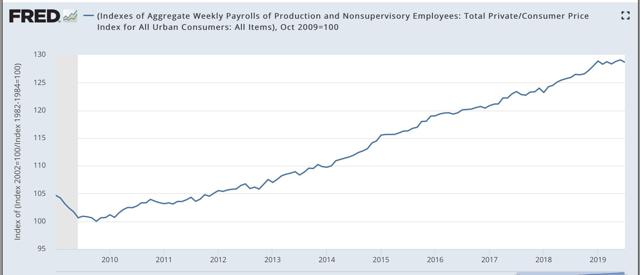
For total wage growth, this expansion remains in third place, behind the 1960s and 1990s, among all post-World War 2 expansions; while the *pace* of wage growth has been the slowest except for the 2000s expansion.
Finally, two months ago I raised a concern that real aggregate wages had decelerated sharply this year, writing that “real aggregate wage growth has typically decelerated by 1/2 or more from its 12 month peak just at the onset of recessions, although there have been 3 false positives coincident with slowdowns.” Last month that concern disappeared. As of this month it re-appeared, as YoY growth has declined to 2.2% vs. 4.9% at the beginning of this year, and is actually -0.2% below its level in January:
Still, we have had two similar declines already during this expansion, so I would characterize th is metric as a yellow flag vs. a red flag at this point.
Monday, August 12, 2019
My preliminary long leading forecast through midyear 2020
- by New Deal democrat
This post is up at Seeking Alpha.
This is my first look at economic conditions into next summer. I suspect that it is contrary to most punditry that you will read.
In any event, as usual clicking over and reading helps reward me for the effort I put in to this endeavor.
Subscribe to:
Posts (Atom)