Saturday, August 3, 2013

Weekly Indicators: still all about interest rates, housing, and oil edition


 - by New Deal democrat

Quarterly and monthly data reported in the last week included weak, but positive GDP growth in the 2nd quarter. Real median wages were up. Employment was positive in trend, and the unemployment rate dropped slightly. The internals were poorer, with aggregate hours, average wages, and the manufacturing workweek (one of the 10 LEI's) down. Consumer confidence (another component of the LEI) was also down. Personal income was up, but less than spending, so the savings rate went down.

There is evidence that the moribund manufacturing sector is coming to life again, with a positive Chicago PMI, improved positive ISM manufacturing index (and greatly improved new orders, another component of the LEI). Factory orders were also up.

Let's start this week's look at the high frequency weekly indicators again by looking at the Oil choke collar:

Oil prices and usage
  • Oil $106.94 up $2.24 w/w

  • Gas $3.65 down -0.04 w/w

  • Usage 4 week average YoY up +3.2%
The price of Oil was close to its 52 week high. The 4 week average for gas usage was, for the fourth week in a row after a long streak to the contrary, up YoY.

Interest rates and credit spreads
  •  5.25% BAA corporate bonds down -0.04%

  • 2.57% 10 year treasury bonds up +0.03%

  • 2.68% credit spread between corporates and treasuries down -0.07%
Interest rates for corporate bonds had been falling since being just above 6% in January 2011, hitting a low of 4.46% in November 2012. Treasuries previously were at a 2.4% high in late 2011, falling to a low of 1.47% in July 2012, but remain back above that high, although they have backed off the recent new high. Spreads made a new 52 week low this week. Their recent high was over 3.4% in June 2011.

Housing metrics

Mortgage applications from the Mortgage Bankers Association:
  • -3% w/w purchase applications

  • +5% YoY purchase applications

  • -4% w/w refinance applications
Refinancing applications have decreased sharply in the last 10 weeks due to higher interest rates to a two year low. Purchase applications have also declined from their multiyear highs in April, and this week were again only slightly positive YoY.

Housing prices
  • YoY this week +9.0%
Housing prices bottomed at the end of November 2011 on Housing Tracker, and averaged an increase of +2.0% to +2.5% YoY during 2012. This weeks's YoY increase made a new 7 year record.

Real estate loans, from the FRB H8 report:
  • -0.5% w/w

  • -0.1% YoY

  • +1.9% from its bottom
Loans turned up at the end of 2011 and averaged about 1% gains YoY through most of 2012.  Over the last few months, the comparisons have completely stalled, and this week turned negative.

Money supply

M1
  • +1.3% w/w

  • +2.3% m/m

  • +8.6% YoY Real M1

M2
  • +0.2% w/w

  • +1.6% m/m

  • +5.1% YoY Real M2
Real M1 made a YoY high of about 20% in January 2012 and eased off thereafter. Earlier this year it increased again but has backed off its highs significantly.  Real M2 also made a YoY high of about 10.5% in January 2012.  Its subsequent low was 4.5% in August 2012. It increased slightly in the first few months of this year and has generally stabilized since, although it has declined slightly in the past few weeks.

Employment metrics

The American Staffing Association Index rose 1 to 95. It is up +2.9% YoY

Initial jobless claims
  •   326,000 down -17,000

  •   4 week average 341,250 down -5000
Tax Withholding
  • $165.2 B for the month of July vs. $144.0 B last year, up +$21.2 B or +14.7%

  • $141.2 B for the last 20 reporting days vs. $130.6 B last year, up +10.6 B or +8.1%

Daily tax withholding has improved to the middle part of its YoY range compared with its YoY average comparison in the last 7 months. Initial claims remain within their recent range of between 325,000 to 375,000, and have flattened out just as they have in the last 3 springs and summers.

Transport

Railroad transport from the AAR
  • +7200 carloads up 2.5% YoY

  • +6100 carloads or +3.7% ex-coal

  • +6000 or +2.8% intermodal units

  • +13,500 or +2.5% YoY total loads
Shipping transport Rail transport has been both positive and negative YoY in the last several months. This week it was positive once again. The Harpex index had been improving slowly from its January 1 low of 352, but has flattened out in the last 7 weeks. The Baltic Dry Index remained close to its 52 week high. In the larger picture, both the Baltic Dry Index and the Harpex declined sharply since the onset of the recession, and have been in a range near their bottom for about 2 years, but have stopped falling.

Consumer spending Gallup's YoY comparison was extremely positive this week. The ICSC varied between +1.5% and +4.5% YoY in 2012, while Johnson Redbook was generally below +3%. The ICSC has recently been relatively weak, but Johnson Redbook remains close to the high end of its range.

Bank lending rates The TED spread is still near the low end of its 3 year range, although it has risen slightly in the last month.  LIBOR remained at its new 3 year low established last week.

JoC ECRI Commodity prices
  • up +0.02 to 123.79 w/w

  • +6.08 YoY
The recent important changes in interest rates, housing, and Oil are still the main story. Interest rates have subsided somewhat from their recent highs, and spreads made new 52 week lows. Housing prices are positive, but purchase and refinancing applications, as well as real estate loans, are negative The Oil choke collar remains engaged.

Positives include bank rates, money supply, jobless claims, and commodities. Consumer spending is still very positive as measured by Gallup and as measured by Johnson Redbook, but only weakly positive as measured by the ICSC. Temporary staffing was quite positive for the first time in many weeks. Tax withholding for the month of July turned out quite positive.

Shipping rates were the one neutral.

The big picture remains the spike in interest rates and the concomitant decline in mortgage activity, both long leading indicators, as well as the spike in prices of gas and oil. Short leading and coincident indicators remain positive.

Have a nice weekend.

Friday, August 2, 2013

It's the Weekend.

Sorry, no pups.

I'm here on Monday, NDD will be here over the weekend.

See you Monday

... And in other economic news


- by New Deal democrat

While the July jobs report was the big news this morning, in the last couple of days we've had some other significant economic releases that are worth noting.

A number of short leading indicators have been quite positive. First of all, the ISM manufacturing index came in a 55.4. The new orders component of that index was even higher at 58.3. There has never been an economic contraction at these readings. Ever.

First time jobless claims came in close to their post-recession unadjusted lows. Similarly, there has never been a recession within 2 1/2 months of such a reading.

July auto sales declined slightly from 15.9 million annualized to 15.7 million annualized. This is still the second highest reading since 2008. Auto sales typically turn negative about half a year before any economic contraction, and are typically down at least 10% from their peak at that time. This suggests that the remainder of 2013 will continue to show expansion.

Finally, personal income increased 0.3%, probably 0.1% in real terms. Spending increased 0.5%. Not surprisingly, the savings rate declined 0.2% to 4.2%. June's income and spending were both revised down -0.1%. The savings rate has risen from its post-recession low in January of 3.3%. The consumer is still powering the economic expansion, but an increasing trend in the savings rate, while necessary, acts as a brake on that expansion.

Depending on what happens in the ongoing fiscal showdowns in Washington, the rest of 2013 looks clear. The jury is out on 2014.

July employment report: almost everything except the headlines stunk; warning flag for 2014


- by New Deal democrat

The headline report for July 2013 employment is that 162,000 jobs were added, and the unemployment rate declined to 7.4%. Don't be deluded. Almost every other indicator in this report was poor. And the unemployment rate is a lagging indicator. Let's examine the carnage.

First, let's look at the more leading numbers in the report which tell us about where the economy is likely to be a few months from now. Most of these were negative.
  • the average manufacturing workweek declined 0.2 hours from 40.9 hours to 40.7 hours. This is one of the 10 components of the LEI and will affect that number negatively.

  • construction jobs declined by -6,000, .

  • manufacturing jobs rose for the for the first time in 5 months in a row, up 6000.

  • temporary jobs - a leading indicator for jobs overall - increased by 7700.

  • the number of people unemployed for 5 weeks or less - a better leading indicator than initial jobless claims - declined by 129,000, and is about 125,000 off its lows.

Now here are some of the other important coincident indicators filling out our view of where we are now:
  • The average workweek for all workers declined 0.1 to 33.6 hours.

  • Overtime hours were down -0.2 to 3.2 hours.

  • the index of aggregate hours worked in the economy declined from last month's level of 98.6 (revised down to 98.5) to 98.4.

  • The broad U-6 unemployment rate, that includes discouraged workers declined from 14.3% to 14.0%, but is still above the sub-14% readings of this spring. The workforce declined 37,000. Part time jobs grew by 19,000.
Other news included:
  • the alternate jobs number contained in the more volatile household survey showed an increase of 227,000 jobs.

  • Combined revisions to the May and June reports totalled a loss of -26,000 jobs, with the reports now showing +176,000 and +188,000 jobs, respectively. Downward revisions are not a good sign, although this is only one month.

  • average hourly earnings decreased from $24.00 (revised down from $24.01 to $13.98. This is going to be worse, on the order of -0.3% in real terms, given my prediction for a June CPI increase of +0.2%. The YoY change decreased from +2.2% to +1.9%, meaning that YoY average real wages have probably decreased slightly, the first time that has been the case since winter.
  • the employment to population ratio was moribund at 58.7%. The labor force participation rate actually declined 0.1% to 63.4%

The internals in this report almost all were poor. The workweek declined. Average wages declined. Aggregate hours declined. May and June were revised downward. The participation rate is still barely above its post-recession low.

It wasn't all bad, as manufacturing jobs increased slightly as did the number of recently laid off workers. Temp jobs are still a positive.

Still, after the recent marked deceleration in the economy as shown by the last three quarters of GDP reports, and with three of the four long leading indicators having turned negative or neutral, this report adds yet more reason to be concerned about 2014.

Australian Dollar Breaks Key Long-Term Support


For the last two years, the Australian dollar ETF has been trading in a range between 92 and 106.  However, since the early spring it has clearly been in a bear market, continually dropping sharply week after week.  Now prices are below he 200 week EMA, and the price move is pulling the shorter EMAs lower.  Momentum is clearly negative and money is flowing out. 

Thursday, August 1, 2013

US Labor Market Preview Summation

This week, I've looked at various components of the US labor market statistical set to get an idea for the overall composition of the employment situation.  The indicators were broken down along the lines established by Macroblog in their spider chart, and involve four data sets: leading indicators, confidence, utilization and employer behavior.  Let's put all of the information together to get a complete picture.

1.) The leading indicators (jobless claims, temp employment) are positive.  Initial claims are in the 330,000-360,00 range and are clearly in a downtrend.  Temporary help hiring is at very high levels.

2.) Employer behavior still shows a great deal of caution.  While there has been a consistent trend of hiring over the last four years, there is still a 2 million job gap between the highest employment level of the last expansion and the current level of establishment jobs.  Employer trepidation is best shown in the weak hires/job openings number, which shows that employers are being very cautious about who they hire.

3.) There isn't much confidence right now.  Quits are low, which indicates people are concerned about their ability to get a new job.  In addition, employer confidence is still at an overall low level.

4.) Overall labor market utilization is still at pathetically high levels, indicating we're just not using our available labor resources efficiently.

There are a lot of reasons for the slow pace of hiring.  First, overall domestic growth is "moderate" (to use the most often used adjective in the Beige Book), telling us there isn't a big crush for new hires.  Overseas markets are still weak, lowering export demand.  Productivity growth is fair, which is probably all that is required in a slow growth environment to keep employers from hiring.

However, I am still amazed at the remarkable lack effort on the part of Washington to actually do anything at this point.  That is perhaps the greatest crime of all.


It's official !!!


- by New Deal democrat

Atrios says that today's jobless claims number of 326,000 is ...
[click on video for accompanyment]:


... "pretty good".

Houston, Tranquility Base here. The Eagle has landed.

It's official. Allelulia !!!

US Employment Preview: Labor Market Confidence

Let's finish our look at the US labor market by looking at labor market confidence as expressed in two data sets: overall hiring plans from the National Federation of Independent Business and Quits from the JOLTs survey.

Hiring plans have stalled at low levels for the last two and a half years.  The current level is at the same level of the low point of the early 2000s, indicating an incredible lack of confidence.


Unfortunately, we don't have a lot of data for the JOLTs survey, but what we do have indicates that people are extremely reluctant to leave their current employment.  This means that employees have very little confidence in their ability to find a job right now.


GDP shows Washington's fiscal FAIL


- by New Deal democrat

While most commentary yesterday was about how 2nd quarter GDP beat expectations, the trend over the last three quarters is very concerning. The business cycle algorythm James Hamilton uses at Econbrowser was updated to register a 30% chance of recession after Q1. That isn't enough for him to believe a recession has begun, but since we are four months past that, it isn't exactly reassuring. Here's the updated graph of GDP for the last 10 years:


This is an economy just barely shambling along, similar to what we saw at the end of 2006 and beginning of 2007.

What is particularly disheartening is the contractionary role government is playing in this. Here's the input of the private sector and government sector for the last 3 quarters:

IV I II
GDP Percent Change 0.1 1.1 1.7
Federal Contribution  -1.19 -0.68 -0.12


If government's contribution were simply zero as opposed to outright contraction for the last three quarters, GDP would have grown over that period at an annual rate of +1.6% - hardly great but at least palpably positive - vs. the actual +1.0% annualized that we've had.

There is going to be another debt ceiling debate this autumn. That's on top of the payroll tax increase that went into effect on January 1, and the ongoing Sequestration. Most likely there will be some sort of compromise with even more cuts in spending. I'm really not sure at all that the economy can handle even more cuts without actually tipping into a contraction.

In such a case, by the way, I wouldn't expect leading indicators to lead by much. For many of these indicators 1974 (Oil embargo) and 1981 (Fed hiking rates precipitously) stand out as times when very little lead time was given between indicators turning and the recession beginning.

Market/Economic Analysis: South Korean: Big Improvement in GDP

South Korea posted its best GDP print in awhile last week:

South Korea’s economy grew the most in more than two years, on stronger government spending and private consumption even as a slowdown in China clouds the outlook. 

Gross domestic product rose 1.1 percent in April-to-June from the previous quarter when it rose 0.8 percent, the Bank of Korea said today in a statement in Seoul. That was above the median 0.8 percent estimate of 13 economists surveyed by Bloomberg News. From a year earlier, Asia’s fourth-largest economy expanded 2.3 percent.

Let's take a look at the underlying data from the South Korean Central Bank's GDP release:


Consumer spending increased at its strongest rate since 1Q12, posting a 1% increase.  This is the second strongest growth rate in the last 10 quarters.  A big reason for this increase was the 2.4% increase in government spending -- which is the direct result of recent stimulus moves by the government.  While investment was down, it was still positive.  And exports also printed a decent number -- although the slowdown in China is obviously having an impact.  As noted the the Bloomberg article above:

Slower growth in China is “a major risk” to South Korea’s outlook, given Korea’s manufacturing sector has significant trade and investment exposure to the world’s second-biggest economy, said Ma Tieying, an economist at Singapore-based DBS Group Holdings Ltd. The preliminary China Purchasing Managers’ Index fell to 47.7 in July from 48.2 in June, further below the level of 50 that separates contraction from expansion, HSBC Holdings Plc and Markit Economics said yesterday. 

Let's take a look at the ETF:


Over the last year and three months, the South Korean market has done a perfect, round-trip route.   Notice that on the sell-off we see a great deal of discipline -- there isn't a great crash, but instead a very measured move lower.  This tells us there is simply a bit more bearish sentiment in the SK market right now, but it certainly isn't an overwhelming, bar the door sell off. 


Wednesday, July 31, 2013

While The Tax Code Is Complicated, The Chances Are High You'll Never See It


I originally posted this back in April, but given the renewed focus on taxes it seems appropriate to re-post it here
 
One of the most common refrains used about the tax code is that it's so complicated that no one can use it.  People who rail against it complain about it's length (there are over 2000 pages to it, after all), the odd way in which it's written and the fact you sometimes have to read multiple sections in multiple subsections to understand what's going on.

First, all of the above is true.  However, let's ask a follow-up question: how many people actually have to see this complexity as part of their daily economic life?  The answer is not many -- easily less than 5% of the total population.  Let me spend the rest of this article explaining the last paragraph.

First, the tax code is organized as a hierarchy: it's largest "section" is title, followed by sub-title, then chapter, followed by sub-chapter, then part and sub-parts and finally sections and sub-sections.  Here is how it looks conceptually.

Title
     Sub-Title
          Chapter
               Sub-Chapter
                    Part
                        Sub-Part
                             Section
                                   Sub- Section


For the purposes of most taxpayers, the most important divisions are the "sub-chapters," the vast majority of which no one will ever see.  For example, do you own a bank or insurance company?  How about a non-profit corporation or for-profit corporation?  Any exposure to natural resources?  Any international income, trusts, real-estate investment trusts or corporations used to eliminate taxes on shareholders?  If you answered no to all of the above questions, then you don't need to know anything about the vast majority of the tax code.

In fact, for most people, the only major sub-chapter they'll ever see is sub-chapter B, computation of taxable income. And here's the best part: if you use any of the major accounting packages to do you taxes (turbo tax etc...), you're already way ahead of the game as these packages are really good and work for the vast majority of people.

Now, when we look in detail at some of the other sub-chapters (estate and gifts, partnership tax, corporate tax, estates and trusts, and international tax) there are some complex issues.  However, most of this complexity is the result of anti-avoidance provisions built into the law.  These are rules that are put into place to plug previously exploited loopholes, a situation that fills the corporate tax code (sections 301-395), international tax code (sections 861-1000) and estate tax code (Subtitle B).  And, if you're involved in these areas of the code in any way, you're already working with accountants and lawyers who specialize in this area of the law.

And finally, consider this: the reason why we spend time preparing taxes etc... is because the US has a self-reporting tax system -- that is, we tell the government what we make and the fear of audit keeps us in check.  Do you really want the other system where the government is that much more aggressive?

So here's the real tax deal.  Yes the tax code is over 2000 pages (and that doesn't include the accompanying Treasury Regulations which easily add over 20,000 more.  I know because I've read the vast majority of them).  However, over 95% of the US population will never see this complexity because it doesn't apply to them.  Additionally, a primary reason for the complexity is that people have tried to get around the law with cute legal maneuvers (the vast majority of which wouldn't survive a substance over form challenge) requiring Congress to plug loopholes.  This means these sections need to be in the code to prevent abusive practices.

US Employment Preview: Labor Market Utilization; or, How To Really Not Use Your Available Labor Resources Very Well

Let's continue looking at the US labor market by highlighting how well (or more correctly how poorly) we are utilizing our labor force.


This chart combines the unemployment rate, marginally attached workers plus people who are part time for economic reasons.  After the last two jobless recoveries (as the early 1990s and 2000s were characterized) we saw this rate move up to about 12% and 10%).  After the last recession the percentage moved up to a bit below 17%.  It is still at embarrassing levels.  

GDP report: Real median wages highest in two years


- by New Deal democrat

As you recall, I have been studying and tracking real average and median wages and income. Earlier this month, the quarterly report on Usual Weekly Wages showed a significant increase in the 2nd quarter. This has now been joined by the Employment Cost Index, part of this morning's GDP release.

Here's a graph of the median wages as measured by the Employment Cost Index, deflated by the CPI, through the second quarter:


This past quarter saw a spike in the index. Real median wages are now positive YoY, and are at their highest level since the first quarter of 2011.

Remember, what we have seen is that real median wages have been positive or negative largely due to the increase or decrease in the price of gasoline. That price has gone generally sideways over the last couple of years, and real median wages have bottomed out and now, on both quarterly measures, have improved.

P.S. I haven't forgotten about following up with real median income. I hope to have an extensive post up on that next week.

Market/Economic Analysis: UK; Looking Better

From the Office of National Statistics:
  • Gross domestic product (GDP) increased by 0.6% in Q2 2013 compared with Q1 2013.
  • All four main industrial groupings within the economy (agriculture, production, construction and services) increased in Q2 2013 compared with Q1 2013.
  • The largest contribution to Q2 2013 GDP growth came from services; these industries increased by 0.6% contributing 0.48 percentage points to the 0.6% increase in GDP.
  • There was also an upward contribution (0.08 percentage points) from production; these industries rose by 0.6%, with manufacturing increasing by 0.4% following negative growth of 0.2% in Q1 2013.
  • In Q2 2013, output in the construction industry was estimated to have increased by 0.9% compared with Q1 2013. In Q1 2013 construction output was at its lowest level since Q1 2001.
Here are relevant charts from the report:


The above chart shows two important points.  First, total GDP is still below pre-recession levels (the red line).  This was caused by an incredibly weak economy, which is caused by the weak growth in the Q/Q area.  The UK has had periods of negative growth since the end of the recession, highlighting how fragile their economy has been.

The above chart shows two important developments.  First, in the latest quarter production, construction and services all contributed to growth.  Additionally, each sector contributed in a meaningful way.  Compare the most recent quarters performance to the previous four quarters where at least one area contracted, leading to the slower growth.

In addition, the latest Markit indicators show an economy about to expand.

UK service sector growth accelerated to its highest level since March 2011 during June as incoming new business rose at a rate unmatched for six years. The sharp increase in new business led to a marked rise in backlogs of work, and encouraged companies to take on additional staff to the strongest degree since August 2007.

Confidence regarding future activity was also retained, with expectations at their highest for 14 months. However, margins remained under some pressure as strong competition prevented companies from fully passing on higher cost burdens. 


After accounting for seasonal factors, the headline Business Activity Index recorded 56.9 in June, up from May’s 54.9 and the highest reading for 27 months. Growth has now been recorded for six successive survey periods, and has continually improved throughout this sequence.

Here's the accompanying chart:

That's a strong rise, and one that indicates an economy with some momentum for growth.

And manufacturing appears to have the same bullish qualities:

The UK manufacturing sector maintained its solid second quarter performance into June, with levels of production and new business rising at the fastest rates since April 2011 and February 2011 respectively. Domestic market conditions improved further, while demand from overseas also strengthened.
 

At 52.5 in June, up from a revised reading of 51.5 in May, the seasonally adjusted Markit/CIPS Purchasing Manager’s Index® (PMI®) posted above the neutral mark of 50.0 for the third month running. Moreover, the rate of improvement signalled by the PMI was the steepest for 25 months. The average reading over the second quarter as a whole (51.4) was the highest since Q2 2011.
 

The latest expansion in UK manufacturing production was broad-based, with all of the sub-sectors covered by the survey signalling increases in June. The strongest rates of growth were recorded by the Textiles & Clothing and Food & Drink categories.

Here's a chart of the data:

Let's take a look at the ETF chart for the UK market:


Since early June of last year, prices have been rallying and have been using the 200 day EMA as technical support, hitting that level twice.  There have been several periods of consolidation.  The market recently hit a peak just below the mid-May peak.  I've drawn a red line connecting these peaks.  My guess is we're starting to see some consolidation from the year long rally. 


The pound is still trading at very low levels on the weekly chart; prices are just above three year lows, indicating traders still view the economy as weak.  Ultra-low interest rates are not helping in this matter.


Tuesday, July 30, 2013

Consumer prices in July likely up 0.2%


. - by New Deal democrat

One of my running themes for the last few years is how the engaging or loosening of the Oil choke collar explains the acceleration and deceleration of the economy in general, and the inflation rate in particular. In an era of paltry average wage gains, that makes the difference between households gaining or losing ground.

In fact, knowing what has happened to the price of gas is virtually all you need to know to figure out the inflation rate. Since underlying cor inflation is typically +0.1% or 0.2% a month, all you need to do is divide the percentage change in gas prices by 10 (or by 16 if you want to be more conservative), add that to core inflation, and you are almost always going to be within 0.1% of that month's non-seasonally adjusted inflation rate. Then all you need todo is make the seasonal adjustment.

We now know that the average price for gas in July was $3.59 vs. $3.62 in June (remember that June started at a high price and then declined). This is about a 0.7% decline or less tha 0.1% after we divide by 10. Adding in core inflation gives us roughly +0.1%. As you can see from the below graph of NSA vs. S A inflation each month beginning last July, the seasonal adjustment is +0.1%:


This gives us a July inflation rate of +0.2% +/-0.1% seasonally adjusted, or +2.0% YoY.

So you should expect to read in a couple of weeks at a lot of sources that inflation is worryingly picking up steam. Don't buy it. Note that in August and September of last year there was a big run-up in the price a gas, and inflation clocked in at +0.5% each month. Unless gas prices run up to $3.90 or so a gallon, that isn't going to be duplicated. If gas prices remain stable, in two months we will be right back down at about +1.2% YoY inflation. Then we can switch right back to worrying about deflation.

US Employment Preview: Employer Behavior

Let's continue looking at the US labor market by focusing on employer behavior:


The total number of establishment jobs indicates that employers have been hiring, and doing so consistently.  However, the total amount of establishment jobs is still 2 million below that highest level of the previous expansion -- and that's before we take population growth into account.


The above two charts are from the JOLTs survey and they highlight an interesting trend.  While the number of openings being advertised is at decent levels for this time in the expansion, the total number of hires is still very low.  Put in a different way, while employers are advertising job openings, they aren't hiring at a high rate.

This information tells us that while employers are advertising positions as open, they're just not filling them that quickly.  This ties in with the low level of employer confidence.


Market/Economic Analysis: Japan -- Still Looking Better

From Reuters:

Japan's consumer prices rose in June for the first time in more than a year, a positive sign for the government's battle against deflation, but the rises centered on higher electricity bills rather than stronger demand that could drive a durable recovery.


.....

Core consumer prices rose 0.4 percent in June from a year earlier, higher than a median market forecast for a 0.3 percent increase, largely due to higher electricity bills and gasoline prices.

Japan's energy prices have been rising as a weaker yen has boosted the cost of imported fuel needed to make up for the closure of almost all the nation's nuclear reactors after the March 2011 tsunami.

"Such cost-push inflation should not be taken as particularly positive," said Yasuo Yamamoto, senior economist at Mizuho Research Institute. Market participants "are skeptical about the prospects for a steady pickup in inflation, with service-sector firms struggling to pass on costs to consumers due to a persistent output gap."


.....

"If you look at a narrower basket of goods without energy, the clear rising trend isn't there yet and we can't say with great confidence that Japan is clearly on its way out of deflation," said Koichi Fujishiro, economist at Dai-ichi Life Research Institute in Tokyo.

Short version: it's a start. 

Here is a link to the Japanese CPI numbers from their statistical bureau.

Most importantly, the rise in inflation is a direct result of the BOJs plan to drop the yen's value.  Consider this long-term chart of the yen's ETF:

 
The yen was in a clear uptrend from 2007 until the end of 2011 -- this despite the obvious weakness of their economy.  The first reason is the yen was part of the carry trade -- people would borrow in yen because of their ultra low rates and then invest in another currency, pocketing the difference.  After the Great Recession, the yen became a safe haven.  But either way, a currency that should have been dropping in value because of the fundamental weakness of the underlying economy was rising. 

Now it appears the yen is probably closer to "fair value" given the weakness of the Japanese economy.

In addition, Abe's party swept the most recent elections, giving them a strong mandate to continue their policies:

Japanese Prime Minister Shinzo Abe, fresh from a strong election victory, vowed on Monday to stay focused on reviving the stagnant economy and sought to counter suspicions he might instead shift emphasis to his nationalist agenda.

The victory in parliament's upper house election on Sunday cemented Abe's hold on power and gave him a stronger mandate for his prescription for reviving the world's third-biggest economy.

At the same time, it could also give lawmakers in his Liberal Democratic Party (LDP), some with little appetite for painful but vital reforms, more clout to resist change.

"If we retreat from reforms and return to the old Liberal Democratic Party, we will lose the confidence of the people," Abe told a news conference on Monday.

He emphasized that his priority remains proceeding with his "Abenomics" program of hyper-easy monetary policy, government spending and economic reform, describing it as the cornerstone of other policy goals.


Let's take a look at the Japanese ETF to see how it's fared:


After peaking in late May, the ETF fell to the 200 day EMA and rallied again to just shy of the previous peak.  The ETF has dropped over the last few days in reaction to weak news coming out of China.  It still appears that the Japanese market is consolidating gains made in the post Abe run-up.

Monday, July 29, 2013

US Employment Preview; Leading Indicators

This week we get another employment report.  So let's place the upcoming data into perspective by using the Macroblog employment spider chart categories (leading indicators, employer behavior, confidence and utilization) to get a broad picture of the US employment situation, starting with leading indicators.


The top chart shows weekly initial claims and the 4-week average of claims and places the latest reading into a 20 year historical perspective.  Claims are currently at levels associated with the mid-point of an economic expansion.  The bottom chart shows a five year history of claims and demonstrates a clear downward trend which appears to be stabilizing around the 350,000 area.


Secondly, temporary services are at very high levels and are in a clear upward trend.

In short, the leading indicators for employment are very positive.

Market/Economic Analysis: US; More of the Same "Moderate" Recovery

Let's take a look at last week's economic news

The Good

The Kansas City Fed index rose to 6.  Most importantly, the internal numbers on production and shipments rose sharply.  Additionally, the Markit flash estimate increased from 51.9 to 53.2, which included some strong growth in internal numbers.


New home sales increased 8.3% from the previous month.  However, keep an eye toward the next 3-5 readings for this number.  The spike in this reading could reflect higher interest rates pulling sales forward, but we won't know until we see a few more months of data.

The Neutral 

From the Chicago Fed: The index’s three-month moving average, CFNAI-MA3, increased to –0.26 in June from –0.37 in May, marking its fourth consecutive reading below zero. June’s CFNAI-MA3 suggests that growth in national economic activity was below its historical trend. The economic growth reflected in this level of the CFNAI-MA3 suggests subdued inflationary pressure from economic activity over the coming year.

I've placed this reading in the neutral category because it indicates the economy is growing below its overall economic growth potential.

Existing home sales decreased 1.2% last month.  This is a neutral reading as it may indicate that higher interest rates area starting to slow the real estate recovery.  However, this is only one month of data, so we obviously can't be sure on that. 

The University of Michigan Consumer sentiment decreased a bit last month.

The Bad

The Richmond Fed's manufacturing index fell 18 points to -11Production and new orders also declined.  It should be noted the Richmond Fed's index has shown depressed readings relative to other Fed numbers for the last few years.

Conclusion: the best news came in the Markit report, which showed an improvement in the manufacturing environment.  But more importantly, the internals show a good possibility for a continued improvement in the coming months.  The housing numbers are a bit concerning as both may indicate we're starting to see higher rates impact purchases.   But we we don't have enough data to make a solid call in that area.  Finally, the Chicago Fed number merely concerns that regardless of the news we get, the economy is still operating below potential.

Let's turn to the markets, starting with a long-term view of the SPYs:


The monthly chart shows that we're clearly in new technical territory.  At the end of last year, the market hit resistance around the 139 level -- the previous high from the 2003-2007 rally.  After stalling there at the end of last year, prices have made a strong push higher.  The underlying MACD and CMF support a continued move higher.


The daily chart shows that prices may be consolidating.  The most recent push higher is characterized by weak candles (small bodies) on lower volume.  While the most recent peak is technically higher than the peak in late May, it's pretty insignificant technically.  Most importantly, the MACD is currently declining and close to giving a buy signal.  In addition, the MACD appears to be declining.


When the daily chart SPY analysis is combined with the above 60 minute chart, it shows that next week's most likely direction is consolidation or lower.  Prices above have broken trend from the June 24-July 23 rally and are tight at technical support established in mid-June.  The MACD is declining.


The belly of the treasury curve (the IEIs and IEFs) are consolidating their recent sell-off.  While both have a rising MACD, the indicator is still negative indicating weak momentum.  The key level for the IEIs is 119.5 and the IEFs 100.5.


The dollar is still trading in a tight range of 21.5 - 23. 

The week ahead: we're in the middle of the summer doldrums, so barring a cataclysmic event, trading will be weak.  While there is a Fed announcement this week, I'm not anticipating a major change in their statement.

Sunday, July 28, 2013

A thought for Sunday: turning points


- by New Deal democrat

Why do I blog? Why should you read me? In the last week I've thought a lot about political end economic turning points. For example, Obama is touting a "middle [class] out" economic strategy. He always gives great speeches, but he wouldn't have to be giving them now if he hadn't ceded the narrative to the Tea Party all throughout 2010, telling one Georgia Congressman at the time that there wouldn't be a repeat of 1994 because, "This time, you've got me."

The news of late has been totally "blah." Everything seems either totally stuck in the doldrums or just shambling forward. Unless Washington seriously rattles markets and the economy by refusing to pay bills that it has already incurred this autumn in what looks like Debt Ceiling Debacle 2 - a serious possibility - the news is likely to remain "blah" through the end of the year. Almost nobody is calling for, or saying we are already in, a recession. And the use of the term "recovery" in scare quotes, minus Atrios and a few Doomers, has almost completely disappeared. Almost everybody seems to have accepted the narrative that the economy is improving, as it has for 4 years, but way too slowly compared with what was needed for average Americans.

Meanwhile the stock market continues to make new highs. In the blogosphere, that means that economic sites are losing readership while investing sites are gaining as the public, as always, arrives late to the stock market rally party.

Which means it's a "blah" time for me as well. While I have a strong political viewpoint, my thoughts are usually expressed about 1000 times better by Digby, David Atkins, Charlie Pierce, Riverdaughter, and Armando a/k/a Big Tent Democrat. Simply put, my forte is identifying and calling economic and market turning points - and debunking the false hysteria in between.

In 1994, I was schooled. There was a huge back-up in interest rates, for a couple of days the long end of the bond market inverted, and consumer confidence plummeted. The overwhelming consensus of the pundits, and of individual investors, was bearish. I agreed, but it turned out it was the absolute bottom.

I only needed to learn once. I dug deeply into historical data. I saw why business infrastructure investment in software and computer hardware, touted by raging bull Joe Battapaglia, was driving the economy. I realized that as long as interest rates were declining over the longer term, and businesses continued to invest, the historic bull market was likely to continue. Further, whenever any one or two indicators would roll over, but the important ones remained intact, there would be a "V" market correction, Elaine Garzarelli would announce that a crash was imminent, and that would be the bottom. This was a historic secular bull move, and I figured every individual indicator would give a false positive at least once. At the top, everyone would be ignoring all the signals, all of the late Louis Rukeyser's elves would be bullish (or at least neutral), and then the bottom would fall out.

And that's exactly what happened. After Rukeyser booted Gail Dudak in 1999, all his elves were afraid of being bearish. Marty Zweig looked like he was in agony, continuing to say that he was neutral, while looking as if he wanted to grab Rukeyser by the lapels, shake him like a ragdoll, and scream, "Game over, man. Game over!!!" All of the other leading indicators started to turn. The advance/decline line from 1998 through 2000 looked absolutely horrible. In March 2000, I sat down with a friend over lunch, went through all of the indicators, virtually all of which had turned negative, and announced that the great bull market that had started in 1982 was over.

In 2005 when I started writing diaries at Daily Kos, I figured progressives could use neutral economic commentary, written by somebody with no product to sell. I am always worrying, I am always cautious, and my disposition is pessimistic, but usually with the caveat "not yet," because the long and short term data simply don't support that any Day of Reckoning is nigh.

I was almost positive that we were in a housing bubble, and called its turn in real time. In November 2006, I wrote that a recession would probably start within a year. As the data deteriorated, I wrote "Are Hard Times Near?" the thesis of which was that we were entering a period of prolonged, well, Hard Times as the strugle of the middle class to stay afloat by taking on ever greater debt, and refinancing at lower and lower interest rates, was probably coming to an end (as it turned out, there was one more chance, post 2008, to refinance). In 2007, I wrote of the similarities to 1929 in the broader economy.

Then the deluge hit. My focus turned to whether it would be a self-negatively-reinforcing deflationary spiral, or whether it would avoid going over the precipice. The first clue was when retail sales stopped falling - or fell at a very slow rate - beginning in December 2008. With gas at $1.40 a gallon, it looked like consumers might actually start to rebound in a few months. In January 2009, I started to write that the recession might bottom out in the summer, a conviction which increased as housing permits and starts stopped falling in the spring, and other leading indicators started to turn. Even the horrific monthly payroll declines started to be a little less horrific each month. By early May, Bonddad and I parted company with the dominant Doomish narrative on Daily Kos, and dared to say that conditions were on the cusp of improving.

They did. Since then I have remained positive, with greater or lesser caution at times, seeing off double dippers and triple dippers and Doomish dippers. The data simply hasn't supported a return to economic contraction. In 2009 I was mocking the Pied Piper of Doom. By the end of 2011, I was challenging ECRI. In mid-2011 I also foresaw the bottom in housing prices in early 2012, and in 2012 I took the contrary position to Barry Ritholtz's thesis that housing prices hadn't bottomed. In 2010 and 2011 I called the bottom of corrections in the stock market within one day.

So, writing economic or political polemics is simply not my strong point. Telling you the direction of the data, and whether or not we are at a turning point, is.

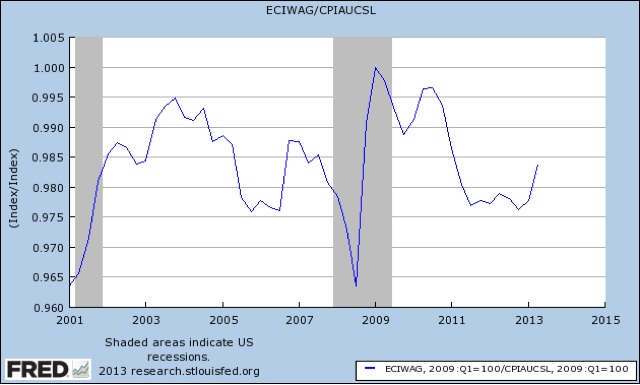
At the moment, the news is "blah." Washington could make it dramatic, in a very bad way, shortly, but there is simply no way to know how that will play out. Barring that sort of intervention in the economy, here's how I think the next recession begins. It will look very much like right now, with a significant increase in interest rates. Housing starts and permits will take a spill. Refinancing will die. Wages will fail to keep up with inflation. Corporate profits will suffer. Eventually consumers will cut back on buying cars, and then there will be a more general cutback in consumer spending. The short leading indicators will have joined the long leading indicators in rollilng over. At that point we will be right back where we were at the end of 2008, hoping we can avoid an outright wage deflationary spiral.

The recent retreat in several of the long leading indicators may or may not be the start of that process. Stay tuned.