Friday, May 21, 2010

Weekend Weimar and Beagle

This is how we clean the grill at Bonddad's house.

See you on Monday.

Will the Euro Meltdown cause a US double-dip?

- by New Deal democrat

This analysis is designed to give you a working understanding of the following two subjects:
(1) What is at issue in Europe?
(2) What are the effects of Europe's problem (including effects specific to the US)?

What is at issue in Europe is really the problem of Greece, Spain, Portugal, and Italy. All of these countries are part of the single european currency, the Euro, but never really met the official fiscal rules for entry -- their deficits were persistently too high. This problem was exacerbated as, during the good times, European governing authorities looked the other way while even big countries like France ran deficits that supposedly called for sanctions. Now, in bad times, the bill is coming due, and the typical way of dealing with the debt problems -- devaluing your currency in order to pay back your debt with cheaper paper, and to increase your exports -- is not available to them, because they are tied in a fiscal union to countries like Germany.

But keep in mind that the 4 Mediterranean countries at the epicenter of the problems are not aomng the biggest economies in Europe. They could leave the Euro and life would go on. Europe could bail them out, issuing more debt, but countries like Germany are able to handle that. Or they could insist on austerity, which only exacerbates the problems in times of deflation (a la the Great Depression). Signs are the Europe is insisting on a combination of the last two items, and has resolutely taken "leaving the Euro" off the table.

The effects of Europe's problems are primarily concerns about loss of demand. If I make money from selling you products, and you buy less of my products, I suffer too. The concern is that Europe's problems, and their demand for austerity as part of the solution, will cause demand for goods and services in southern Europe to collapse. This will hit the economies of the rest of Europe the most, causing a loss of demand there as well. And from there the downturn in demand continues to ripple outward.

Secondarily, if I make my profits party in your currency, and your currency is devalued relative to mine, then when I "repatriate" my profits to my own country, in my currency I have made less profit. The further away from the epicenter I am, however, the less the effects on me are.

The United States is, among the industrialized countries, the furthest from the epicenter, in part because there are collateral but contrary benefits to us from Eurozone distress. If my currency is the "safe haven" then my interest rates go down, allowing me to borrow (for things like mortgages and cars) at a lower rate. Also, if the prices I have to pay go down (deflation), but my economy is otherwise growing, I am able to buy more stuff than I otherwise could. So, the issue for the US is whether the benefits outweigh the risks.

Now let's take a look at both of these issues in more detail.

I. Loss of demand

Here is a graph of various commodity indexes for the last year:


Notice how all the squiggles are generally going up - until a month ago. That is because the global economy was expanding, and at a rapid pace too. More natural resources were needed for production, so their prices went up. In the last month, they've all gone back down sharply. That's because the markets believe that demand will go down. Prof. Hamilton's article above includes graphs of copper and aluminum as well as oil, and they all look the same.

Notice secondly what a decline in the prices of raw materials means -- deflation. More on that below.

II. Loss of profits

Large US companies make a significant share of their profits in Europe. In addition to European demand for those products going down, the 10%+ decline in the value of the Euro vs. the Dollar in just the last month means that profits made in Euros become 10% lower profits when recorded on balance sheets in the US. Thus corporate profits are expected to go down, and that is what the following graph of the S&P 500 for the last 6 months tells us:


III. The Issue of Deflation

Prof. James Hamilton of Econbrowser notes that:
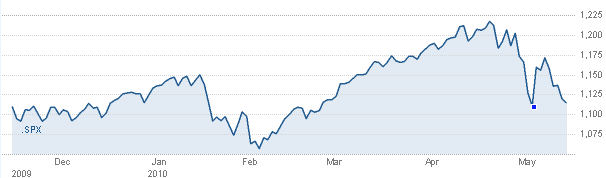
The curious thing is that [prices of natural resources] graphs [for the last month] all look the same. Which suggests ... that recent market moves have a common driving factor.

The natural explanation would seem to be that markets have interpreted developments over the last month as bad news in terms of the quantities of basic raw materials that global customers will want to buy and in terms of the profits that companies around the world can expect to earn.

Such concerns would have to come not just from the fact that the European countries forced into budget austerity measures are going to be buying less... [but] a potential replay of the credit crunch that brought the world economy crashing down in the fall of 2008.

Back in January, in 2010: Gilded Recovery, or Double Dip? (and Oil) I sketched out 2 scenarios, one for each for the two halves of this year. Based on the Leading Economic Indicators which were still strongly positive, I said
The simple fact is, the first 3-6 months of 2010 are probably going to show growth, and indeed more strong growth than few dared to hope for in 2009.
So it seems, as in the first quarter we saw ~3% growth, and the second quarter looks to be positive as well.

As to the second half, I said:
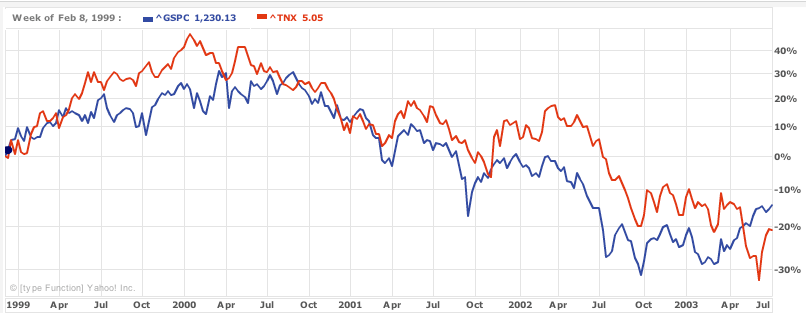
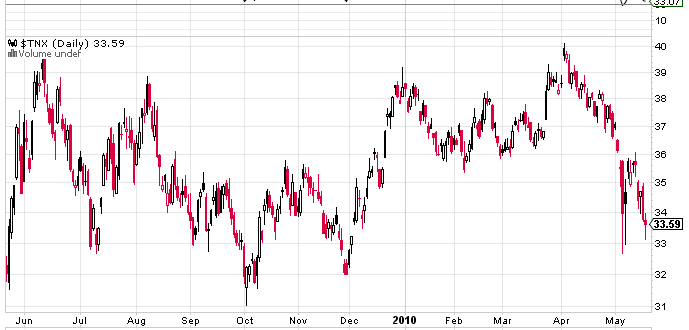
There is ... one economic indicator with an excellent track record at forecasting the economy - with one important qualifier - a year out. That is the yield curve of the bond market.

So long as there is inflation, not deflation, a positive sloping yield curve, where long term interest rates are higher than short term rates, has correctly predicted economic expansion 1 year later, without exception, since 1920, including the Great Depression.

Since long term interest rates, at ~3.5% to 4%, are higher than short term rates, which are close to zero, we still have a positively sloping yield curve as we had at the beginning of this year.

But ... the combined stock and bond markets smell deflation. To show you what I mean, in the following three graphs, the price of the S&P 500 stock index is plotted in red and the 10 year US Treasury bond yield in blue.

The first graph covers the period 1982-1997. Notice that bond yields and stock prices form mirror images of one another. As stock prices go up, bond yields go down, and visa versa:
A decline in bond yields was, on balance, good, as it meant cheaper credit, whereas higher bond yields meant more inflation and the possibility of the central bank tightening credit.

The next graph covers the period from 1998 when the Asian currency crisis hit, to 2003 when the post dot-com recovery finally got going:

Notice that during this time, bond yields and stock prices moved in the same direction. This signaled that bonds were primarily being used as a "flight to safety" and moreso that lwer, but necessarily positive bond yields weren't enough to prevent economic meltdown. In other words, the bond market was primarily concerned about DEflation rather than inflation.

Now here is the same series from 2003 to the present:
Notice that there are 4 distinct periods:
- First, from 2003 to mid 2007, during the Bushco expansion, bond yields and stock prices once again generally moved as mirror images of one another. The bond market did not fear deflaton.
- The second period is mid 2008 to mid 2009. This is the period of the Great Recession, which was the first full fledged deflationary bust since the 1930s.
- The third period is the second half of 2009, during which bonds and stocks briefly resumed their mirror image period.
- Finally, since December of last year, roughly equivalent with the Dubai solvency crisis, bonds have once again resumed primary status as a safe haven, and are moving in tandem with stocks.

In short, for the last 6 months, the bond market has again primarily feared a resumption of deflation.

Noting the (-0.1%) CPI report Wednesday, Prof. Krugman is also concerned the deflation is being signaled.

Another negative is that the Leading Indicators were reported surprisingly if slightly down yesterday, by (-0.1). Given the stock market meltdown this month, a negative LEI for May looks quite likely as well, which certainly signals weakness, if not full reversal, around about Labor Day.

IV. The Counterbalancing benefits: lower prices and interest rates

Deflation isn't always bad. If deflation occurs during an economic upturn, and wages grow rather than join prices in a vicious spiral downward, deflation can be good. Indeed, during the last decade, there have been 5 incidents of deflation longer than one month: late 2001, early 2003, late 2005, late 2006, and a very serious bout of deflation in the second half of 2008. The first four were not long or deep enough to show up as a serious impact on the economy. Only the fifth was a full-fledged deflationary bust.

In my above forecast for 2010, I called Oil the "Joker in the Deck" as to whether there would be deflation, saying:

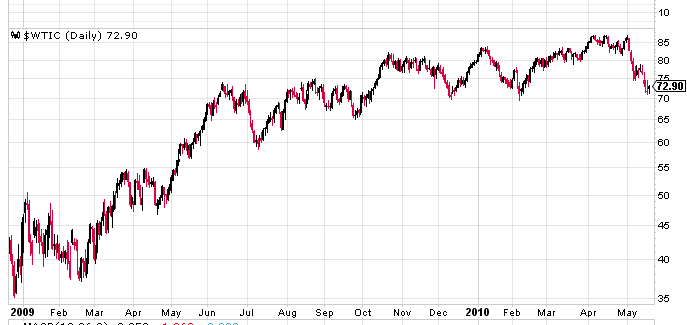
if consumers once again have to pay over $3 a gallon for gas (which ~$90 Oil would give us), it will have a psychological as well as economic impact on consumers, and I would expect them to cut back in other areas. ... It seems [ ] likely that Oil prices will continue to increase, but slowly this time as opposed to the skyrocketing speculative blowoff that led to $147 Oil in July 2008.

Whether $90+ Oil will lead to a full-blown double-dip economic contraction, or just a slowdown later in the year, is almost impossible to gauge. It depends upon how far over $90 Oil shoots, and how long it stays there. If there is a dramatic overshooting a la 2007, there will be a double-dip. If there is a gradual increase over $90 that does not last that long before consumers cut back and the feedback loop causes price declines, then there may just be a slowdown, or if there is a contraction, it may be shallow and only last a quarter or two -- which is my best guess, and only a guess, at this point.

Here's the graph showing Oil prices from their December 2008 bottom to the present:


What has happened is exactly that "gradual increase" which wound up stopping about $2 short of the $90 breaking point described above. Note that even the past month's $20+ decline in the price of Oil does not look so drastic in this larger time frame. In other words, more consistent with slowdown or shallow decline than full-fledged "double-dip."

So the price of an essential US consumer commodity is going down, retreating strongly from the level (equivalent to 6% of disposable consumer income) which in the past 40 years was the triggering point for a recession.

Additionally, here's a close up graph of the 10 year treasury bond typically used to calculate mortgage rates for the last year:

The crisis in Europe which has caused investors to flee to US bonds, has lowered their interest rate almost a full 1/2% in the last month, which will likely be reflected in new mortgage rates as well. In other words, the cost of refinancing consumer debt just went back down.

Just a few days ago, calling Income Stagnation the greatest threat to the recovery, I said that for sustainability, we needed to see lower interest rates (to aid and abet debt refinancing) and/or inflation under 1.5%. The Euro meltdown may give us both of those things.

V. Most analysts believe the benefits of lower prices and interest rates will prevent the US from sliding back into a "double-dip"recession

So far, none of the econometric forecasting services that foresaw the recovery late last year believe that the European problem is sufficient to drive the US back into a double-dip recession, although they believe a slowdown in growth is likely.

For example the Federal Reserve Bank of San Francisco accurately forecast the shape and strength of the recovery to date back in August. Here's the projection of their "Laubach and Williams" (LW) model for the rest of the year:


The model calls for nearly 4% YoY GDP growth, which is quite strong.

Similarly, the Economic Cycle Research Institute (ECRI) which distinguished itself during mid freefall in March of last year by accurately calling for the recession to bottom in summertime, says that "there is little risk of renewed recession this year," although the pace of improvement in the overall economy is set to slacken in the months ahead," according to its managing director, Lakshman Achuthan.

One persuasive analyist has gone even further. University of Oregon economics professor Tim Duy has described, in this post at Economist's View, which I encourage you to click through to and spend a few minutes reading in full, that the European problems may wind up being a net positive for the US economy:

I think it unlikely that an export demand shock alone is sufficient to push the US economy back into recession. Menzie Chinn tackled this issue back in 2007, arguing at the time it was unlikely a rise in exports would stave off a recession. The reverse logic holds as well; US recessions look to be driven by sharp declines in domestic absorption, not exports....

[O]ne would have to consider the positive impact of the Greek crisis against any trade drag. And yes, there are positive implications. First, the weaker Euro has taken a bite out of oil prices, which fell back below $70 today. Make no mistake - keeping a lid on oil prices offers continued support for US consumers. And while we can all dream of a more balanced economy less dependent on household spending, for now it remains the best game in town. ...the overall trend in retail sales continue to look solid:

Consumers have a wind at their backs, unbelievably, and further job growth will only speed them further. Likewise, the rush to Treasuries is keeping a lid on US interest rates....

Bottom Line: The European crisis, by keeping US interest rates in check and oil prices low, may do more to help the US recovery than hurt it

Paul Krugman agrees:
Many of us have noticed that the US exports only a bit more than 1 percent of GDP to the euro zone, limiting the direct negative impact. Meanwhile, as Duy points out, the immediate impact of the euro crisis has been (a) a fall in oil prices (b) a fall in long-term interest rates. Both of these are actually positive for the US.

Against that you might set fear of financial disruption, which may drive up borrowing costs for some private sector players. But Duy is right: it’s not at all clear that this hurts prospects for growth over the next few quarters.


Just this morning, Menzie Chinn, Professor of Public Affairs and Economics at the University of Wisconsin, Madison, notes that:

The OECD has recently released documentation on their new macroeconometric model. One of the experiments implemented involves a 10% euro depreciation against a basket of currencies
....
the table indicates the effect of a 10% euro depreciation would only have a modest impact on US GDP -- a 0.2 percentage point deviation relative to baseline two years out, if sustained.


Conclusion. It is worthwhile to note that in the 2008 recession, the US was the epicenter of the crash. No other region took so big a hit to GDP or employment. In fact, most of Asia kept right on growing. If Europe gets hit now, Asia will be one step removed, and as Krugman points out, the US will be even more on the periphery than that.

The question is, which will be affected more by a Euro meltdown: the manufacturing and exports that have helped drive the US recovery so far (bad), or interest rates and the price of Oil and other commodities (good)? Nobody knows for sure, in part because nobody can gauge the trade-offs I've described above with any real precision; and also because some of the decisive factors are going to be the aptitude - or maladeptness - of the political response. In my opinion, the panic-mongering of Bush, Bernanke, and Barney Frank among others, needlessly and stupidly amplified consumer fear at the time of their pleas for the September 2008 Wall Street bailout. Similarly, German Chancellor Angela Merkel's blunt declaration that the Euro was in danger may well have had a similar effect on the markets this week.

Still, for now my best guess is that Profs. Duy and Krugman are right, and we sustain only a slowdown in the rate of recovery, but not a double-dip. Time will tell, and anybody who tells you they know for sure is lying to you.

Yesterday's Market


On the euro, notice the increasing volume over the last month. Then notice yesterday's spike in volume. I've wondered out loud over the last week or so whether we were witnessing a selling climax. Yesterday there were rumors of the ECB intervening on behalf of the euro, but that rumor was not confirmed. But that is a reason for the volume spike.


The overall technical picture is still bearish, with all the EMAs moving lower, the shorter below the longer and prices below the EMAs (c). The MACD is moving lower as well (a). But, notice the MACD could be about to give a buy signal and the A/D line has turned positive as well.


in relation, notice the dollar is right at technical support.


Gold caught a safety bid as part of the European situation. But we may be seeing a flight from there as well. First, notice the shorter EMAs have turned lower and that prices are right at technical support (a). Also notice the momentum has decreased ( b) and the A/D line is dropping as well.


The SPYs are dropping in a big way. First, all the EMAs are moving lower, the shorter are belwo the longer and prices are below the EMAs (a). Momentum is dropping (b) and the A/D line is moving lower (c).


Note the large down bars (a) and gaps down (b) on the chart.


On the Russell 2000, notice the 10 day EMA has moved through the 50 and the 20 is about to do so.

Thursday, May 20, 2010

Mortgage Data and Seasonal Adjustments

From the NY Times:


Data released Wednesday by the Mortgage Bankers Association showed the mortgage delinquency rate rose in the first quarter to 9.38 percent of all loans outstanding, from 8.22 percent in same period last year.

When adjusted for seasonal variations, the default rate rose over 10 percent for the first time.

Seasonal adjustments are used to smooth out data in ordinary times, but in these extraordinary times the bankers’ group said it was not sure how much they could be trusted. In the first quarter the seasonal adjustments showed the delinquency rate worsened considerably. The raw data, on the other hand, indicated a marked improvement.

Warning that “fundamental market factors” might be exercising undue influence over the seasonal numbers, the mortgage bankers said they did not know whether the optimistic or pessimistic sequence was more accurate.

“We may be at a point where the market is changing for the better, but we can’t be sure because of the confounding effect of seasonal differences,” said Jay Brinkmann, the group’s chief economist.

Yesterday's mortgage data conflicted with this report from Reuters:

Fewer U.S. consumers are falling behind on their debt, prompting lenders to look again for ways to make their business grow.

Delinquency rates on mortgages, home equity loans and credit card bills fell in April for the third straight month, according to data that Equifax Inc (EFX.N), one of the largest U.S. credit bureaus, provided exclusively to Reuters.

The data is based on Equifax' 200 million-plus files of U.S. consumers using credit.

"If you think about the entire U.S. population as a risk portfolio, it's safe to say that the portfolio is indeed improving," said Dann Adams, president of Equifax' U.S. Consumer Information Solutions.

The only credit product in which delinquency continues to rise is student loans, where 11.2 percent are late, up 0.7 percent from March and 3.5 percent from last year.

"It's a tough labor market," Adams said. "It's difficult for many to start repaying those loans."

So, the MBA says one thing while Equifax says another. This should be interesting.

For more on seasonal adjustments, see this post from Silver Oz.


Leading Indicators Down .1

From the Conference Board:

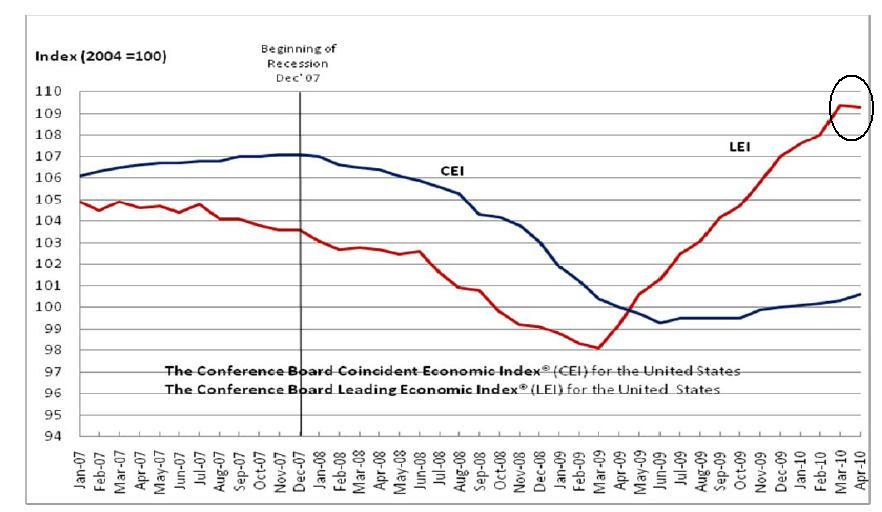
The Conference Board Leading Economic Index®(LEI) for the U.S. declined 0.1 percent in April, following a 1.3 percent gain in March, and a 0.4 percent rise in February.

Says Ken Goldstein, economist at The Conference Board: "These latest results suggest a recovery that will continue through the summer, although it could lose a little steam. The U.S. LEI declined slightly for the first time in more than a year, and its six-month growth rate has moderated since December. Meanwhile, the coincident index, a measure of current economic activity, has been improving since mid-2009."


Here's the chart:


Notice the chart has increased for the better part of a year, making this one month a "blip". However, this is a very good indicator with a good track record that can't be ignored. Here's the data for why the index dropped:


Manufacturer's new orders and supplier deliveries dropped. This is hits the manufacturing sector which has been a big part of the turnaround. Coordinate this data with the drop in the Empire State index (which dropped but is still positive) and a possible slowdown may be in the works (although today's Philly Fed was positive). Building permits are way down, impacting housing, construction employment and construction/home improvement retail (Home Depot, Lowe's etc.). Home retailers had reported some good numbers recently. Money supply dropped which hits everyone. Consumer expectations dropped, hitting retail sales.

So, we have one month of a drop, but the underlying reasons for the drop are pretty broad based. This, in conjunction with the rise in initial unemployment claims, raises a yellow flag until we get more data.

Initial Unemployment Claims Increase 25,000

From Bloomberg:

More Americans unexpectedly filed applications for unemployment benefits last week, showing firings remain elevated even as employment climbs.

Initial jobless claims rose by 25,000 to 471,000 in the week ended May 15, exceeding the median forecast of economists surveyed by Bloomberg News and the highest level in a month, Labor Department figures showed today in Washington. The number of people receiving unemployment insurance and those getting extended payments fell.

Some companies are trimming payrolls to boost or maintain profits, even as employers have added jobs each month this year. Unemployment may take time to recede as more jobseekers enter the workforce and fail to find work.

“Claims remain uncomfortably high,” Aaron Smith, a senior economist at Moody’s Economy.com in West Chester, Pennsylvania, said before the report. “The improvement in continuing claims has slowed noticeably.”

Applications were projected to drop to 440,000 from 444,000 initially reported for the prior week, according to the median forecast of 44 economists in a Bloomberg survey. Estimates ranged from 425,000 to 448,000. The Labor Department revised the prior week’s figure up to 446,000.

There were no special factors behind the jump in claims last week, a Labor Department spokesman said.

The sideways movement of initial claims has been a concern of mine for the last several months. This increase is not good and indicates the the labor market is not healing as quickly as we would like.

Here's a chart of the data:


Yesterday's Market


Over the last week or so, trade has been dominated by the declining euro, which has led to a dollar rally. Yesterday, the dollar broke a week long plus uptrend (a) at point (b). Remember a trend break does not mean a reversal. Instead it means the trend is changing.


The daily chart is still strong. Prices are in a strong uptrend, the EMAs are in a bullish orientation (shorter are above the longer, all are moving higher and prices are above all EMAs). in addition, momentum is positive (b) and money is flowing into the security (c) although the A/D line has topped a bit over the last few days.


Gold caught a safety bid with the euro situation, but that bid might be going away. First, prices formed a downward sloping channel (a) starting last Thursday. yesterday prices gapped down in a big way (b) on heavy volume (c).


The daily chart shows weakening as well. The 10 and the 20 day EMA have dipped lower, although the EMAs are still in a bullish orientation. However, the MACD has given a sell signal (b) and the A/D line is dropping as well (c).


The main issue with gold prices is they went parabolic on very high volume. As I noted last week:

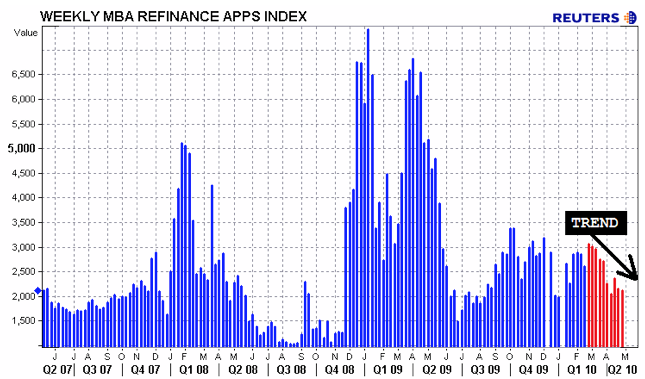
The only drawback to this chart is it is parabolic -- th erate of ascent is incredibly steep which no price chart usually maintains for long. In addition, the heavy volume could be a buying climax with the addition of an exhaustion gap. However, that's one possible technical interpretation. The fundamental picture is gold bullish as traders express their concern with the EU situation by purchasing safe assets -- here, gold.


The key for this chart will be holding support at the upward sloping trend line


The SPY chart has a lot of technical weakness right now.


First, we had the big fat finger sell-off from a few weeks ago (a). While this was followed by a nice rally (b), prices fell on high volume at the open last Friday (c). This was followed by further sell-offs at (d) and (e). Simply put, there is a lot of nervousness right now.

Finally, consider this chart, which compares the 5-minute TLT to the 5-minute SPY


The TLTs are catching a safety bid from the SPYs sell-off.

Wednesday, May 19, 2010

Empire State Down; Housing Starts Up


From the NY Fed:

The Empire State Manufacturing Survey indicates that conditions for New York manufacturers continued to improve for a tenth consecutive month in May, albeit at a slower pace than in April. The general business conditions index fell 13 points, to 19.1. Similarly, the new orders and shipments indexes also moved lower but remained at positive levels. The inventories index dropped back to a level near zero after rising into positive territory in March and April. The prices paid index continued to climb, reaching its highest level of the year, while the prices received index was little changed and positive. The index for number of employees rose for a fifth consecutive month, reaching its highest level since 2004. Future indexes suggest that activity is expected to expand further in the months ahead, but the level of optimism was noticeably lower in May than in recent months.


As the chart shows, the number is still positive and doing well. We'll have to wait and see if the euro situation will start to hit the manufacturing numbers -- especially those on the East Coast. My guess is part of the recent drop in the Empire number is probably related to Europe, but that's just a hunch at this point.


However, future activity will probably be muted:

Construction of new homes rose more than expected in April but new building permits fell sharply, signaling the industry's rebound could be short-lived.

The results show builders ramped up to meet demand from buyers seeking to take advantage of federal tax incentives, but are now scaling back their plans.

Building permits, a gauge of future activity, sank 11.5 percent to an annual rate of 606,000, the lowest since October 2009, the Commerce Department said Tuesday. Analysts were expecting a slight dip to a rate of 680,000.

Home sales have rebounded this year. They were helped by low mortgage rates and two government tax credits — $8,000 for new buyers and $6,500 for current owners who buy and move into another property. To receive the tax credit, borrowers had to have a signed offer by April 30 and must close the deal by the end of June.


Starts are up but permits are down. I think we'll continue to see the same level of housing starts for the next year that we've seen for the last year and a half.

April CPI: good news and bad news

- by New Deal democrat

The good news and the bad news are exactly the same. April CPI came in at -0.1% NSA. YoY inflation is down slightly to 2.2%. Core inflation is virtually non-existent at 0.9%.

The good news is that inflation looks very likely to retreat to a level less than wage growth in the next couple of months (wage growth averaging about 1.5% for the last year. In June of 2009, because of Oil prices, NSA inflation increased 0.7%. Unless there is a rapid and complete turnaround in the price of Oil (down to about $68.50/barrel as I type this), we are going to see a further, significant downdraft of prices in the next month. This will be good for consumers.

The bad news is that this raises the risk of a repeat episode of deflation. Outright deflation will probably occur only if there is a significant decrease in demand, and that means consumer retrenchment.

In fact, since December of last year, the bond market has been primarily driven by fear of deflation, rather than inflationary expansion. You may recall that deflation was my caution about the second half of 2010, when I posted my outlook back in January. I will post the graphs on this later in a separate post.

Yesterday's Market


Let's start with a look at the euro, as it is the cause of the recent problems in the market. First, current prices (b) have moved through previous lows (a) established at the height of the financial crisis. In addition, volume on the recent move (c) is incredibly high.


Note that the euro and the dollar have a nearly perfect inverse relationship - hence the reason for the dollar's recent increase.


Since the beginning of April, we've seen a huge sell-off that included numerous downside gaps (a). Gaps are a bit more common in currency ETFs because currencies are traded nearly 24/7 while ETFs aren't. However, also note the bearish EMA orientation (b) -- the shorter EMAs are below the longer EMAs, all the EMAs are moving lower and prices are below the EMAs. Finally, there has been a massive volume spike (c) over the last few weeks. This could be a selling climax.


Momentum is clearly declining (a) and money is leaving the market in a big way (b).

As a result -- at least recently -- we've seen the dollar as rally strongly.


The dollar has been in a strong uptrend (a) with several different price consolidations along the way (b).

Let's turn to a shot of yesterday's market now, because it started off really well, but then died.


Stocks opened higher, but then fell for the remainder of the day. Notice the disciplined manner in which prices fell (a). Also note that volume increased throughout the day (b).


As a result of stocks dropping, Treasuries caught a bid, rising for the whole day. Prices rallied in two uptrends (a and c) which prices broke at the end of trading (c).


Industrial metals fell for the entire day after opening higher (a).


The dollar rallied, forming two upward sloping channels (a and b). Prices broke through previous resistance (c) and consolidated at the end of trading (d).

Tuesday, May 18, 2010

Consumer Delinquencies Decrease

From Reuters:

Fewer U.S. consumers are falling behind on their debt, prompting lenders to look again for ways to make their business grow.

Delinquency rates on mortgages, home equity loans and credit card bills fell in April for the third straight month, according to data that Equifax Inc (EFX.N), one of the largest U.S. credit bureaus, provided exclusively to Reuters.

The data is based on Equifax' 200 million-plus files of U.S. consumers using credit.

"If you think about the entire U.S. population as a risk portfolio, it's safe to say that the portfolio is indeed improving," said Dann Adams, president of Equifax' U.S. Consumer Information Solutions.

The only credit product in which delinquency continues to rise is student loans, where 11.2 percent are late, up 0.7 percent from March and 3.5 percent from last year.

Three months of decreases is a good sign. I'm not confident enough to call a top yet, but this is a good sign nonetheless.


Wrong again, Doomers: State tax receipts are going *UP*!

- by New Deal democrat

A few readers wonder why occasionally Bonddad and I wrote posts excoriating "Doomers." Bonddad usually deletes the ridiculous stuff before I see it, although personally I think the proprietor of this blog should save it at treat you all to a "Tauntapalooza" so you can read some of the "plaudits" we get. Nevertheless, some of the stuff I do see and usually I just chuckle.

Here's one that came over the transom last week:
Obviously Gov. Schwarzenegger does not read Bonddad. He explained that the significant economic pain accruing to working class people resulting from his state budget was due to the “sour economy” and he went on to compare California to Greece.

If he were a regular reader of the “chicken in every pot” Bonddad blog he would know that the recession is over, the economy is growing and California’s budget problems are ‘lagging indicators’.

Don’t you just hate uninformed politicians?
{sigh} So much ignorance and lack of reading comprehension all packed tightly into 4 little sentences. I wonder if it takes practice, or whether it just comes naturally?

To begin with, of course, our Doomish visitor never bothered to read Happy Days are not Here Again. But, hey, why let a little thing like someone's actual positions get in the way of a misinformed insult.

Our correspondent also flunks out in the tax receipt department. I've been warning that Mish unintentionally bottom-ticked tax revenues, and last week
The Liscio Report, a newsletter that tracks state tax revenues, says 94% of the states that the Liscio report tracks saw sales tax revenue increase in April from April 2009. That's up from just 18% of states in March.

The average gain is around 2.5%, adjusted for population....

What that means is that March was a good month because sales-tax revenue in any given month reflects activity of the month before.
For the math impaired, 94% of 50 is 47 states, meaning only 3 states had YoY shortfalls in April. And California wasn't one of them. According to California Comptroller John Chiang:
Compared to April 2009, General Fund revenue in April 2010 was up $142 million (1.4%). The total for the three largest taxes was above 2009 levels by $150 million (1.6%). This increase was driven by sales taxes that were $450 million higher (103.2%) than last year. However, corporate taxes were down by $115 million (-7.6%), and personal income taxes came in slightly below last April by $186 million (-2.5%)T
Since California's revenues actually went UP, what was the problem? Mr. Chiang continues:
Compared to estimates from the 2010-11 Governor’s Budget, total General Fund revenues in April were $3.6 billion lower (-26.4%) than expected. Personal income taxes were well below expectations by $3.1 billion (-30.0%), and corporate tax revenues came in below projections by $541 million (-28.1%). Sales tax revenues were $123 million better (16.1%) than anticipated.
In other words, the problem isn't actual tax collections, which were up -- and in the case of sales tax receipts, have been up YoY for 4 months in a row. No, the problem in California is the pie-in-the-sky budget projections set by Der Gubernator. Surprise, surprise.

But isn't the fact that income tax receipts came in light in April a clincher for the Doomer? Ummm, no. Over to you, Prof. Krugman:
I’ve been hearing some muttering about the April tax receipts, which are well below those of a year ago. Doesn’t that mean that all hopes of recovery, either in the economy or in the budget, should be abandoned?

No.

Read the CBO’s Monthly Budget Review (pdf) for the lowdown. Basically, April non-withheld income tax payments were way down — because those payments reflect 2009 income, which was way below 2008. But those tax receipts that reflect the current state of the economy — payroll, withheld income, and corporate — are all rising.
Now, I don't want to sound callous to the uncounted Californians who will suffer through budget cuts that are now being proposed. But they aren't being proposed due to collapsing state revenues, because California's revenues have improved. They are being imposed because politicians lied last year in their future projections.

Even more importantly, Californians have known for at least a year just how badly hamstrung their budgetary process is due to the constraints imposed by a series of past Propositions, most importantly the infamous Proposition 13 with regard to property taxes, and mandating a 2/3 majority for any tax increases -- a majority that will never be obtained while one political party is resolutely intransigent on that issue. Yet not steps have been taken to enact a new Proposition to repeal or even just modify those constraints.

So, our misinformed Doomer should skidaddle on back to Doomerville, where he can stomp his feet in impotent rage and hold his breath till he's blue, because the facts sure don't support him.

US Is Now a Safe Haven Play

From Bloomberg:

“Reverse diversification” boosted global demand for long-term U.S. financial assets to a record as the European fiscal crisis may be beginning to translate into increased demand for dollar assets.

Purchases of equities, notes and bonds totaled $140.5 billion in March, more than double economists’ projections, after net buying of $47.1 billion in February, the Treasury Department said yesterday. Treasury purchases rose by the most since June as China, the largest lender to the U.S., added to its holdings for the first time since September.

“Diversification was a major deadweight on the dollar last year and reverse diversification is now a major source of vulnerability for the euro,” said Alan Ruskin, head of foreign- exchange strategy at Royal Bank of Scotland Group Plc in Stamford, Connecticut. The crisis may result in 2 percentage points of “growth divergence in the U.S.’s favor,” he said in a telephone interview yesterday.

Signs of a sustained economic recovery, including a rebound in earnings and stock prices, may increase demand for U.S. investments as concerns mount about the sustainability of government debt in Europe. The world’s largest economy has expanded for three consecutive quarters and added 573,000 jobs in the first four months of the year. Russia cut the share of euros in its international currency reserves to 43.8 percent at the end of 2009 from 47.5 percent a year earlier, Interfax reported yesterday, citing central bank data.

‘Fear Was Misplaced’

The dollar has strengthened 7.2 percent so far this year while the euro has slumped 8.7 percent, according to Bloomberg Correlation-Weighted Indices. The euro dropped to $1.2235 yesterday, the lowest level since April 2006.

The Standard & Poor’s 500 Index in March rose 5.9 percent, its biggest gain since July 2009, while the Dollar Index, a gauge of the U.S. currency’s strength against six other major currencies, gained 0.9 percent. Treasuries declined 0.9 percent in March, according to an index compiled by Bank of America Corp.’s Merrill Lynch unit.

“Foreign institutions and individuals are still turning to the U.S. as a safe haven,” said Paul Christopher, senior international investment strategist at Wells Fargo & Co. in St. Louis. “There was some concern foreigners were abandoning the U.S. currency. That fear was misplaced.”

I've covered the market moves extensively in the "yesterday's market" posts. Suffice it to say, US assets are currently a safe haven asset. This has incredibly important implications.

1.) Low interest rates: as traders bid up Treasury bonds, yields drop. This means US borrowing costs -- which could easily get out of hand right now -- are contained (at least for now).

2.) Lower commodity prices: commodities are price in dollars. A stronger dollar means lower commodity costs, which in turn means lower inflationary pressure. This also means the cost of oil will be kept in check, helping US consumers.

3.) Weaker exports. A strong dollar means US exports are now more expensive, lowering the amount of exports foreigners are willing to buy.


Yesterday's Market

Let's start with the fact the markets are currently risk averse as a result of the European situation. As a result, we've seen the dollar rally strongly, which has led to a drop in commodities and a rise in bond prices. Stocks are mixed


Gold is priced in dollars. Therefore, it usually moves inversely to the dollar. The chart above is a three year chart of the UUP and GLD ETF. However, gold and the dollar have moved in tandem for the last several months. The questions is this: how long can that last, especially as other commodities are getting hammered.

So long as we're comparing commodities, here is a chart of the FXI (China) and DBB (industrial metals).


Chinese demand -- as represented by an increasing stock market -- is a clear driver of base metals demand. As such, an increasing Chinese stock market drives prices higher and lower.

Let's take a closer look at the base metals ETF:


We've seen some very strong downward bars (a) on strong volume (c). Also note the shorter EMAs are moving lower, the shorter EMAs are beloe the longer EMAs and prices are below the longer EMAs. Finally, prices are now below the 200 day EMA - a bear market.


However, base metals were here before -- at the beginning of the year, in fact -- and bounced back.


But from an even longer perspective, notice that prices have broken the uptrend started at the beginning of 2009 and may be printing a double top. However, a double top should have volume peaks at the peaks. In contrast, there charts have volume peaks in the troughs.


The long-end of the Treasury market is still above the 200 day EMA on decent volume. My guess is prices are going to consolidated around this area for the next week or so.


Finally we have yesterday's turnaround in the equity markets. The pattern is simple: the indexes dropped until the turned around, forming a "v" pattern. The main point here is the psychological importance of a mid-day turnaround. It can indicate there is a marked change in the underlying market psychology. Yesterday the big news was the euro stopped falling mid-day. For Us equities to keep up their turnaround, we need more of that type of move in the euro.

Monday, May 17, 2010

Job Losses and Productivity


On May 11 I wrote the following:

Personally, I think what has happened over the Great Recession is jobs that would have disappeared by natural attrition over a period of say 5-10 years were accelerated out of existence by the recession. For example, a manufacturer was thinking, "I'll continue to move in the area of automation at a slow rate." But then the recession hit and he said, "no time like the present to at least start getting rid of people."


The next day, a NY Times article observed:

For the last two years, the weak economy has provided an opportunity for employers to do what they would have done anyway: dismiss millions of people — like file clerks, ticket agents and autoworkers — who were displaced by technological advances and international trade.

The phasing out of these positions might have been accomplished through less painful means like attrition, buyouts or more incremental layoffs. But because of the recession, winter came early.

This is a central problem to the long-term unemployment the country is facing. Consider this:


Ms. Norton is one of 1.7 million Americans who were employed in clerical and administrative positions when the recession began, but were no longer working in that occupation by the end of last year. There have also been outsize job losses in other occupation categories that seem unlikely to be revived during the economic recovery. The number of printing machine operators, for example, was nearly halved from the fourth quarter of 2007 to the fourth quarter of 2009. The number of people employed as travel agents fell by 40 percent.

This “creative destruction” in the job market can benefit the economy.

Pruning relatively less-efficient employees like clerks and travel agents, whose work can be done more cheaply by computers or workers abroad, makes American businesses more efficient. Year over year, productivity growth was at its highest level in over 50 years last quarter, pushing corporate profits to record highs and helping the economy grow.

But a huge group of people are being left out of the party.

Millions of workers who have already been unemployed for months, if not years, will most likely remain that way even as the overall job market continues to improve, economists say. The occupations they worked in, and the skills they currently possess, are never coming back in style. And the demand for new types of skills moves a lot more quickly than workers — especially older and less mobile workers — are able to retrain and gain those skills.

There is no easy policy solution for helping the people left behind. The usual unemployment measures — like jobless benefits and food stamps — can serve as temporary palliatives, but they cannot make workers’ skills relevant again.

I've covered one big reason for this problem: educational achievement. The data indicates that higher educational levels leads to higher wages and lower rates of unemployment.

But consider this chart, which is a 10-year chart of output per hour in logarithmic scale:


Output per hour increased during the great recession, indicating that productivity increased. Simply put, despite a massive drop in employment, the amount of work done increased, telling business they could indeed get by with less. That means the from a business owners perspective, the massive cut in payrolls was a good thing, as it lowered their fixed costs (by lowering payroll expenses which are usually some of the largest a company faces) but didn't hurt overall output.


Industrial production Increases

From the Federal Reserve:

Industrial production increased 0.8 percent in April after having risen 0.2 percent in March. The rates of change for both January and March were revised up, but the rate of change for February was revised down; nevertheless, the cumulative change over those months was only slightly lower than previously reported. Manufacturing output climbed 1.0 percent in April for a second consecutive month and was 6.0 percent above its year-earlier level. The increases in manufacturing continued to be broadly based across industries. Outside of manufacturing, the output of mines rose 1.4 percent, and the output of utilities decreased 1.3 percent. At 102.3 percent of its 2002 average, total industrial output in April was 5.2 percent above its year-earlier level. The capacity utilization rate for total industry advanced 0.6 percentage point to 73.7 percent, a rate 6.9 percentage points below its average from 1972 to 2009, but 4.5 percentage points above the rate from a year earlier.


Once again, we have a strong report from the manufacturing sector.

First, let's go to the data:


Both industrial production and capacity utilization continue to improve from their mid-2009 lows.

And the improvements were (again) broad-based:

The output of most major market groups rose in April. The production of consumer goods increased 0.2 percent, the result of higher output of consumer nondurables. The output of consumer durables was unchanged; declines in automotive products and in home electronics offset advances in appliances, furniture, and carpeting and in miscellaneous goods. The production of consumer nondurable goods moved up 0.3 percent, with the output of non-energy nondurables rising 0.3 percent and the output of consumer energy products gaining 0.5 percent. All major categories of consumer non-energy nondurables recorded increases, although most of the gains were small; the exception was paper products, which moved up 1.0 percent. For consumer nondurable energy products, higher fuel production was partly offset by a decrease in residential sales by utilities, which moved down for a third consecutive month.

.....

The production index for durable goods advanced 1.1 percent in April; all major categories of durables strengthened with the exception of motor vehicles and parts and aerospace and miscellaneous transportation equipment. Gains of 2.0 percent or more were recorded for nonmetallic mineral products; primary metals; machinery; and electrical equipment, appliances, and components.

Nondurable manufacturing climbed 1.0 percent in April. The output of petroleum and coal products jumped 3.6 percent, the index for plastics and rubber products expanded 2.7 percent, and the production of paper climbed 2.4 percent. The indexes for textile and product mills, for printing and support, and for chemicals also increased, while the indexes for food, beverage, and tobacco products and for apparel and leather were little changed.


Wage Stagnation: the biggest threat to recovery

1. There has been a long-term stagnation in wages

The biggest threat to ongoing economic recovery now is the biggest chronic problem for the middle/working classes for the last 45 years: a lack of real wage growth. This is something I first described a year ago. Only twice in the last 45 years has there been real, sustained wage growth (that is, wages growing faster than inflation) for more than a year or so: once, in the post-war economic golden era of the 1960s and early 1970s; and again during the tech boom of the 1990s.

This is shown in the following graph. It takes average wages measured as year over year percentage change, and subtracts CPI. Thus, in those time periods where wage growth exceeded inflation are positive in the graph. Those where wage growth failed to keep even with inflation are negative:


Because the above graph uses average (i.e., "mean" wages) it can be distorted by a few number of very high income workers. A better measure of wages is something called the Employment Cost Index, which measures income for the "median" (i.e., 50th percentile) worker. The problem with the ECI is that it os less than 10 years old. With that limitation, here is the same graph showing wage growth as measured by the ECI (red) and wages + benefits (blue) vs. the inflation rate (green):


Notice that the ending of the Great Recession was helped enormously by the fact that wages grew substantially faster than prices (which actually fell for a while).

In the longer term, as you can easily see from the above graphs, real wage growth essentially stagnated in 1974, and ever since the Reagan revolution, almost all growth from productivity has been vacuumed up by the very top of the income scale:


2. American consumers have coped in two ways

As the American middle/working classes have been relentlessly squeezed, they have coped with this stagnation by resorting to a small bag of budgeting tricks. Chief among those coping mechanisms has been that there has been a generation-long decline in interest rates since they peaked at 15.21% for the 30 year US Treasury bond in October 1981. This has allowed consumers to refinance their debts at ever lower rates every few years, specifically by refinancing their mortgages. Here is a graph which compares real wage growth (from the first two graphs above) and adding average mortgage rates in red:


The graph shows that for most of the period of 1982-2007, mortgage rate declines were frequent enough for homeowners to refinanced their debt at lower interest rates, freeing up additional income for spending.

For awhile during the housing bubble, many people went further, taking equity out of their houses as they appreciated in value by way of home-equity loans (HELOCs). This of course came crashing down as thouse values vaporized, but the debts remained. Before that, in the 1980s and 1990s, some people were able to cash in on appreciation of stocks in their 401K's -- but of course that ended in the dot-com crash a decade ago.

3. When neither coping mechanism is available, recession has inexorably followed

I described this back in August 2007, I wrote a piece called Are Hard Times Near? The Great Decline in Interest Rates is Ending, in which I said:

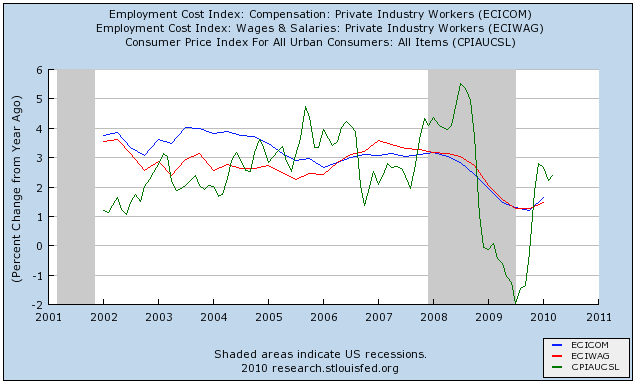
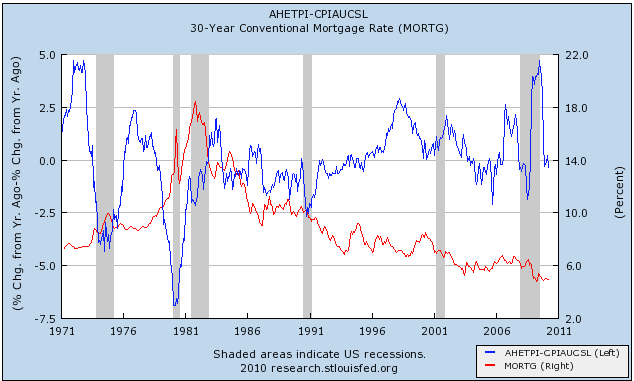
In other words, since 1980, facing stagnated real wages, the only way American consumers have been able to significantly improve their lifestyles is either:
- to take on more debt, using assets which have appreciated in value as collateral (stock investments, housing), or
- to refinance their existing debt at lower interest rates.

When consumers were unable to do either of those things, they cut back on spending, triggering consumer-led recessions.


In a follow up piece a few months later, entitled Why American Consumers are Signaling Recession I also pointed out that:
You can see that for long periods of time in the 1980s, 1990s, and 2000s, consumers were able to spend more by refinancing their existing debt at lower interest rates. By contrast, when interest rates were stable, or even rising as in the 1970s, and wages failed to keep up with inflation, a recession ensued within several years (the only exception was the Y2K recession, which wss investment/tech led and was not a consumer recession)....

Only twice in the last 27 years has the consumer been unable to refinance debt or tap into his or her stock or house ATM. ... [T]he 3rd and final time is almost certainly near.
That's exactly what happened as squeezed consumers cut back, their ability to refinance debt terminated by the collapse of the housing bubble.

4. Wage growth is pathetic in this recovery

Now that we've looked at the long-term problem, let's describe the short term outlook.

While all the other indicators of recovery have turned positive -- including, in the last few months, jobs -- real income is still limping along the bottom:


Because of this, the economic recovery is in a very tight spot -- precisely because average American consumers also remain in a very tight spot. Look again at the first two graphs above. They show wage growth of about 1.5% for the last year. Under those circumstances, even 2% inflation is too much for them to withstand -- without the ability to refinance debt, their disposable income simply isn't keeping up. Outright deflation too is bad, because it only occurs if there is a decrease in demand, causing general prices to go down -- in other words, it will only happen if the economy rolls over again and there are more layoffs, wage cuts, and higher unemployment.

5. No widely held middle-class assets are appreciating

So with paltry income increases of about 1.5%, there are only two ways to sustain the recovery for very long: (1) the inflation rate remains in a very narrow window of 0-1.5%; (2) some asset held widely by average consumers appreciates in value. or (3) another opportunity arises to refinance mortgage debt.

I thik we can all agree that number (2) doesn't look like it's going to happen. That leaves either number (1) or number (3).

6. What about refinancing at lower interest rates

As it happens, lo and behold, a window of opportunity in mortgage interest rates has opened: since the end of 2008. Here's the graph of mortgage rates overlaying real wage growth again:


Note that mortgage rates went under 5% for the first time at the end of 2008, and have stayed close to that rate since. Since that time, mortgage refinancings have risen, and have remained at least somewhat ahead of their 2008 nadir, although with rates rising over 5% in the last couple of months, as the graph below indicates, in the short term refinancings have fallen somewhat again:


7. The price of Oil in particular determines if inflation can remain in the "sweet spot" given low wage growth

Further, as indicated above, only a very narrow window of inflation is helpful to the recovery, and if the unlikely event of decent wage increases doesn't happen, that kind of extremely tame inflation is dependent most of all on energy prices. They have gradually risen in the last year to the poitn where they are within 0.1% of the 4.0% of GDP level (or 6% of disposable income) where historically they have triggered a recession, as shown from this graph current through February 2010:


With the problems in Greece in particular and Europe generally, the dollar has strengthened, and this has cause the price of Oil to decline from over $85 a barrel to $70 a barrel in only one week. Should that decline last for awhile, it will take a little pressure off the consume, and allow inflation to return to that very narrow "sweet spot" which will keep consumer spending -- the biggest engine of economic growth -- positive.

8. This is a very small needle to thread --> so the biggest danger to sustaining the recovery.

But the fact remains that, from here on, we're not going to see any sustained recovery, no long term growth in the American economy until average Americans see a real and sustained increase in their compensation for labor -- for the first time in over 35 years. So long as real wages remain stagnant, any recovery which might start will be vulnerable to every uptick in inflation -- particularly increases in energy prices -- and interest rates. Without real and sustained wage growth -- without addressing the structural issues faciing the American middle/working classes -- recessions will be more frequent and deeper, and recoveries including this one will have problems being sustainable for too long a period of time.