Saturday, October 3, 2020

Weekly Indicators for September 28 - October 2 at Seeking Alpha


 - by New Deal democrat

My Weekly Indicators post is up at Seeking Alpha.

Almost all of the indicators across all time frames are well off their worst levels. The question now is becoming whether or not they will stall out or reverse.

As usual, clicking over and reading should be educational for you, and rewards me just a little bit for my efforts.

Friday, October 2, 2020

September jobs report: a drastic slowdown in improvement, but further demonstrating an economy that *wants* to get better


 - by New Deal democrat

HEADLINES:
  • 661,000 million jobs gained. The gains since May total a little over half of the 22.1 million job losses in March and April. The alternate, and more volatile measure in the household report was 275,000 jobs gained, which factors into the unemployment and underemployment rates below.
  • U3 unemployment rate fell -0.5% from 8.4% to 7.9%, compared with the January low of 3.5%.
  • U6 underemployment rate fell -1.6% from 14.2% to 12.8%, compared with the January low of 6.9%.
  • [UPDATE: Correcting error] Those on temporary layoff decreased 1.523 million to 4.637 million.
  • Permanent job losers increased by 345,000 to 3.756 million.
  • July was revised upward by 27,000. August was also revised upward by 118,000 respectively, for a net gain of 145,000 jobs compared with previous reports.
Leading employment indicators of a slowdown or recession

I am still highlighting these because of their leading nature for the economy overall.  These were positive: 
  • the average manufacturing workweek rose 0.2hours from 40.0 hours to 40.2 hours. This is one of the 10 components of the LEI and will be a positive.
  • Manufacturing jobs rose by 66,000. Manufacturing has still lost -647,000  jobs in the past 7 months, or 5% of the total. A little over half of the total loss of 10.6% has been regained.
  • Construction jobs rose by 26,000. Even so, in the past 7 months -394,000 construction jobs have been lost, 5.2% of the total. About 1/3rd of the worst loss of 15.2% loss has been regained.
  • Residential construction jobs, which are even more leading, rose by 6,600. Even so, in the past 7 months there have still been -14,000 lost jobs, or about 1.7% of the total.
  • temporary jobs rose by 8,100. This is a *drastic* slowdown from the gains of the past few months, which typically were over 100,000. Since February, there have still been -463,800 jobs lost, or 15.8% of all temporary help jobs.
  • the number of people unemployed for 5 weeks or less rose by 271,000 to 2.552 million, compared with April’s total of 14.283 million.
  • Professional and business employment rose by 89,000, which is still -1.386 million, or about 6.4% below its February peak.

Wages of non-managerial workers
  • Average Hourly Earnings for Production and Nonsupervisory Personnel: rose $0.01 from $24.78 to $24.79, which is a gain of 3.4% in the 7 months since the pandemic began. Gains had previously reflected that job losses were primarily among lower wage earners, who have been disproportionately recalled to work. That we have increased employment and increased wages as well is a very positive development.

Aggregate hours and wages:
  • the index of aggregate hours worked for non-managerial workers rose by 1.2%. In the past 7 months combined this has nevertheless fallen by about -7.4%.
  •  the index of aggregate payrolls for non-managerial workers rose by 1.2%. In the past 6 months combined this has nevertheless fallen by about -4.3%.  

Other significant data:
  • Full time jobs were responsible for 54,000 of the gain in the household report.
  • Part time jobs were responsible for 188,000 of the gain in the household report.
  • The number of job holders who were part time for economic reasons fell by -1,272,000 to 6.300 million. This is still an increase since February of 1.982 million.

A special note: government job losses were 216,000, most of them temporary census workers. Without these, the net gain in jobs was 877,000.

SUMMARY

This was certainly a positive report, but a drastic slowdown in improvement compared with prior months. Most noteworthy that that part-time jobs constituted about 3/4’s of the improvement. That permanent job losers increased substantially is not a good sign for the months going forward. 

A “not so bad” element of the report is that both unemployment and underemployment have dropped to “normal” recession levels.

The best news in this report - the last before the November election - was that all  of the leading job sectors and indicators were positive. As I have said many times in the past few months, this is an economy that *wants* to improve. All that remains is gaining control over the pandemic, which has proved impossible for this Administration. 

Thursday, October 1, 2020

Happy Every Economic Statistic in the World Day! 4. Manufacturing continued to expand strongly in September


 - by New Deal democrat

This morning’s final economic report is  the ISM manufacturing index for September.


This is a short leading indicator, and the new orders subindex specifically is one of the 10 components of the Index of Leading Indicators.

A neutral reading is 50. The overall index came in at 55.4, and the new orders subindex came in at 60.2:


So while the Index pulled back a little bit from August’s levels, it was still a very strong positive.

Again, this is evidence that the economy “wants” very much to expand smartly in the near future, if only the pandemic can be brought under control.

Happy Every Economic Statistic in the World Day! 3. Private residential construction spending improves smartly


 - by New Deal democrat

This morning’s third economic release is August construction spending. I track this because it is part of the important long leading housing sector. While it isn’t nearly as leading as housing permits or starts, it is the least volatile of all of the data.


And the news was good, in particular for private residential construction spending, which increased 3.7%:


Residential construction spending is only -0.6% below its February peak.

This is more confirmatory evidence that the economic *wants* to expand, and quite smartly, in 2021, if the pandemic is brought under control.

Happy Every Economic Statistic in the World Day! 2. Real income declines sharply, spending continues to increase


 - by New Deal democrat

This morning’s second economic release was personal income and spending for August.


With the ending of some Congressional emergency unemployment payments, in August real personal income declined sharply, by -3.0%. Nevertheless it remains 1.4% higher than it was in February just before the pandemic hit:


Real personal consumption expenditures (spending), by contrast, improved again in August, up 0.7%:


Nevertheless it remains -4.0% below its level in February.

So, we have continued if decelerating improvement in spending, while income is fading.

Happy Every Economic Statistic in the World Day! 1. Jobless claims continue making glacial progress


 - by New Deal democrat

1. Jobless claims

Another week of glacial progress in initial jobless claims, at levels worse than the worst weekly levels of the Great Recession.

On a non-seasonally adjusted basis, new jobless claims fell by -40,263 to 786,942. After seasonal adjustment (which is far less important than usual at this time), claims fell by -36,000 to 837,000, another new pandemic low. The 4 week moving average also  declined by -11,750 to a new pandemic low of 867,250:


Continuing claims declined on a non-adjusted basis declined by -1,020,192 to 11,410,703. With seasonal adjustment they declined by -950,000 to 11,767,000. Both of these numbers are also new pandemic lows:


The seasonally adjusted number is now less than 1/2 of its worst level from the beginning of May, while the unadjusted number is still slightly higher than that. Both remain about 5  million higher than their worst levels during the Great Recession.

There has been only very slow downward movement in new jobless claims over the past eight weeks. As a result, the pandemic shock recession is gradually turning into something much more chronic at very depressed levels. 

Wednesday, September 30, 2020

Coronavirus dashboard for September 30: a portrait of dismal societal failure


 - by New Deal democrat

I hear the WWE staged a helluva mud wrestling cage match last night!

Since we won’t get any economic news until Every Statistic In The World is released tomorrow, in other, more uplifting news, let’s take the most updated look at coronavirus infections in the US.

Total US infections: 7,190,230
Average infections last 7 days: 42,045
Total US deaths: 205,986
Average deaths last 7 days: 743

Source: COVID Tracking Project 
   
A number of weeks back, I looked at how each US State was doing by way of a color coding system based on the global history of the pandemic. Here’s the system:

Deep Red (general alarm out-of-control fire): 200+ infections per million, 5+ deaths per million.
Red (3 alarm fire): 100-200 infections, 2-5 deaths
Orange (2 alarm fire): 60-100 infections, 1-2 deaths
Yellow (1 alarm fire):40-60 infections, 0.5-1 deaths
Blue (smoldering/1 alarm fire): 20-40 infections, 0.2-0.5 deaths
Green (embers): 0-20 infections,  0-0.2 deaths

Here’s how all 50 States, plus DC and Puerto Rico, fit into that paradigm, for infections only.

Deep Red (general alarm out-of-control fire): 200+ infections per million:


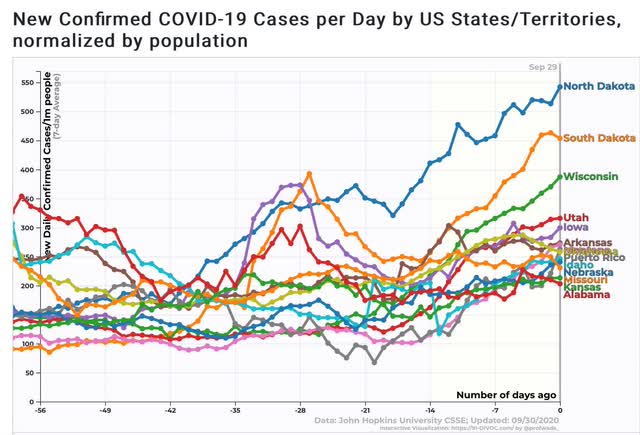
14 States (ND, SD, WI, UT, IA, AR, MT, OK, ID, NE, MO, KS, AL)+ Puerto Rico (up from 5 five weeks ago). 

R ed (3 alarm fire): 100-200 infections per million:  

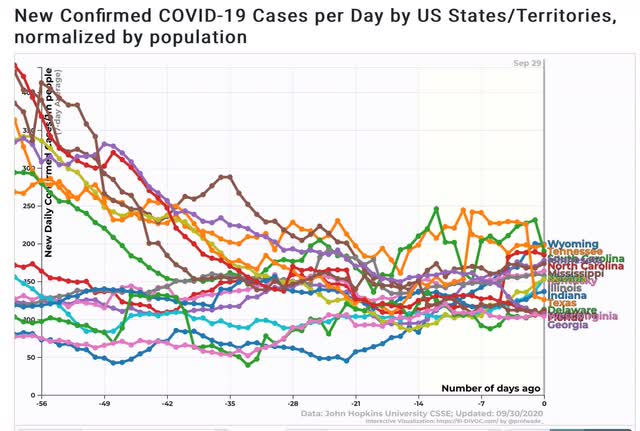
17 States: (WY, TN, SC, NC, MN, MS, KY, IL, NV, AK, IN, TX, DE, FL, GA, LA, WV),  (down from 19 five weeks ago) 
 
Orange (2 alarm fire): 60-100 infections per million:

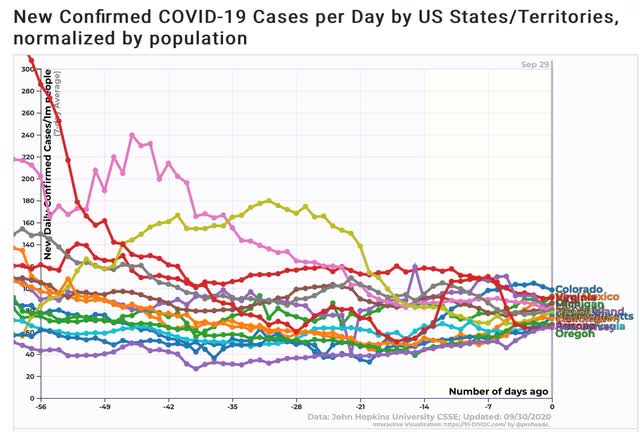
15 States: (CO, NM. MI, VA, RI, OH, CA, MD, HI, PA, MA, WA, OR, AZ, NJ) (up from 10 five weeks ago)
  
Yellow (1 alarm fire):40-60 infections per million: 


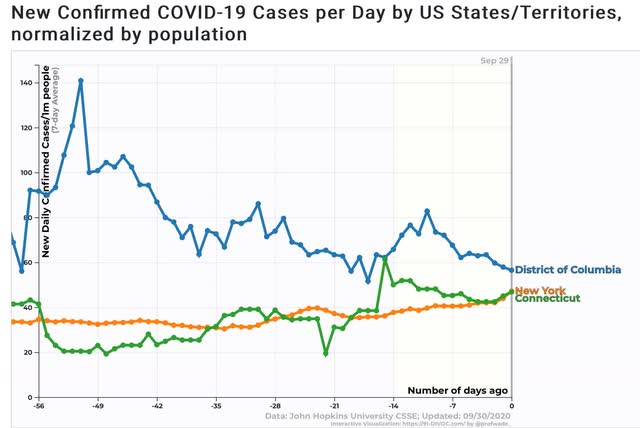
2 States: (NY, CT) plus DC (down from 6 five weeks ago)
 
B lue (smoldering/1 alarm fire): 20-40 infections per million:

 
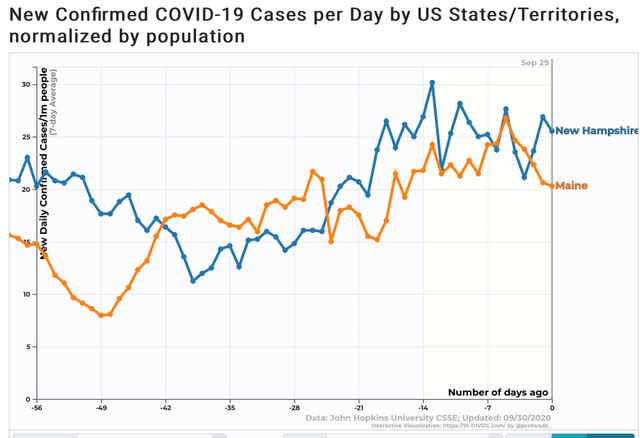
2 States: (NH, ME) (down from 3 five weeks ago)
 
Green (embers): 0- 20 infections per million

 
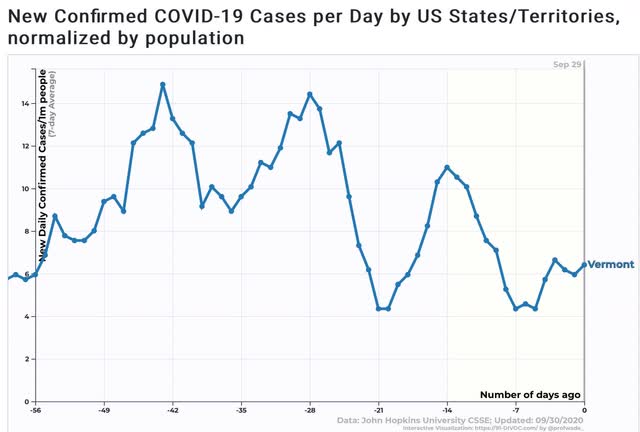
1 State (VT) ( down from 3 five weeks ago)

In case it isn’t already clear, there are 31 jurisdictions that are Red or Deep Red now, vs. 24 five weeks ago. On the other hand, there are only 5 jurisdictions that are Yellow, Blue, or Green now vs. 12 five weeks ago.

This is the portrait of dismal societal failure. About the only good news is that a number of States that were previously out of control about a month ago panicked enough to take effective steps to rein in the pandemic at least somewhat.  

Tuesday, September 29, 2020

Outside the US, complacency leads to the virus roaring back


 - by New Deal democrat

The United States is not the only place where human behavior, alternating between panic and complacency, traces out the path of the pandemic.  Below are the per capita 7 day averages  over the past 3 months for new infections and deaths for the EU, with France, Spain, and Italy highlighted, plus the UK and Canada, in addition to the US.


First, here are deaths:


To see where deaths will be in several weeks, here are new infections:


Three months ago, the EU had the coronavirus beat, to the utter shame of the US.  Then they let down their guard, and the virus has come roaring back. Spain’s death rate has already exceeded that of the US. But as the rate of new infections shows, France is likely to join that sorry club in a couple of weeks, with the UK close behind if behavior doesn’t change immediately. Even Canada is showing is significant if much less concerning increase. Only Germany (not highlighted) down near the bottom has retained its vigilant policies and behavior.

Given human behavior, it is simply extremely unlikely that society can really get back to normal until there is an effective vaccine.

Monday, September 28, 2020

Monday political potpourri for a slow-starting Economic news week


 - by New Deal democrat

It’s a very slow most-of-the-week for economic data. Except for house prices, nothing much gets reported until Thursday, when a slew of data (personal income, spending, ISM manufacturing, construction, and jobless claims) all gets reported at once. And then Friday is the last jobs report before the election.


I’ll update the Coronavirus dashboard tomorrow or Wednesday. In the meantime, here’s a few random notes for your Monday morning.

1. YouGov has now premiered their own election model, which gives Biden 351 Electoral votes as the median forecast. The model does not give probabilities.

2. G. Elliott Morris makes an important point: the Trump tax returns story probably won’t change many minds, but it will set the narrative for another week before the election - and we are now only 5 weeks away. And every day that Trump fails to make up ground on Biden is another day making it more and more difficult.

3. Nate Silver concedes the obvious: you don’t need a fancy algorithm to conclude that as of now Trump is on track to lose the popular vote. And with Biden at 50% in the national polls, it’s almost impossible for Trump to make that up.

4. Current odds, according to 538, of the Democratic candidate winning a particular State’s Senate race, in decreasing order:

AZ - 77%
CO - 72%
NC - 64%
ME - 59%
IA - 47%
MT - 34%
GA - 24% (Ossoff)
SC - 20%
KS - 20%
AK - 14%
TX - 13%

Since I think Nate plays it too safe in his ratings, my preference is to give to the races that are closest to 50% probability, with a bias to those below.

5. As usual, ALL POLLING IS REALLY JUST NOWCASTS, NOT FORECASTS. The average deviation between polling now and the actual Presidential vote is about 2.2%. Further, because voters *react* to the polling (see, 2016, “Hillary has it in the bag”), the more people trust the polls, the more inaccurate they can be!

Sunday, September 27, 2020

The 2020 Presidential and Senate nowcast: not a good week for Biden


 - by New Deal democrat

Here is my weekly update on the 2020 elections, based on State rather than national polling in the past 30 days, since that directly reflects what is likely to happen in the Electoral College. Remember that polls are really only nowcasts, not forecasts. They are snapshots of the present; there is no guarantee they will be identical or nearly identical in early November.

Let’s begin with Trump’s approval. Disapproval remains absolutely steady at 52.7% for the third week in a row, while approval improved very slightly (by +0.3%), and remains right in its normal range for the past 3 1/2 years: 


There is no indication that either Trump’s “law and order” pitch, or the replacement of the late Justice Ruth Bader Ginsburg have moved the needle in any significant way in the past 3 weeks.

Here is this week’s updated map through September 26. To refresh, here is how  it works:

- States where the race is closer than 3% are shown as toss-ups.
- States where the range is between 3% to 5% are light colors.
- States where the range is between 5% and 10% are medium colors.
- States where the candidate is leading by 10% plus are dark colors.


There were 8 changes this week, most of them adverse to Biden. While Nevada improved to “likely Biden,” Louisiana improved from “solid” to “likely GOP,” and  Alabama, on a sole small poll improved from “solid” to “lean GOP,” the rest of the moves were all significant, and all downward. Most notably, Florida declined to “toss-up” (only 45 days ago having been “likely Biden”), and Pennsylvania declined to “lean Biden.” Virginia declined from “solid” to “likely Biden,” and Arizona and New Hampshire declined from “likely Biden” to “lean Biden.”

Biden’s “solid” plus “likely” Electoral College votes have now declined from their peak of  302 eight weeks ago to 255 this week. This is the very first time that this number has been under 270.

Additionally, I am somewhat concerned that outside of Wisconsin and Minnesota, Biden’s support is under 50%, and only above 49% in Michigan, New Hampshire, and Pennsylvania. That being said, if Biden wins those 5 States, he is going to win the election.

I have been expecting some incremental improvement in Trump’s position as voters who were leaning GOP “come home,” and I suspect this is mainly what we are seeing now. In the meantime, I believe the public’s perception of both the economy and Trump’s handling of the pandemic have congealed. The last significant economic report prior to the election, the September jobs report, will be released this Friday. Right now October looks like the final right-wing takeover of the Supreme Court will be front and center, along with Trump’s refusal to commit to an orderly transition if he loses.

Turing to the Senate, there has only been 1 changes this week, as an old poll in MIssissippi dropped out, and the sole remaining poll causes that race to be changed from “lean GOP” to toss-up:


At current polling, if Democrats win all those seats rated “solid” and “likely,” they will have 50 Senate seats; and have improved from 55 to 57 in the past two weeks if they were to win all of the “toss-ups.” They will have 58 seats if they were to capture the “lean GOP” seat in Georgia. A shift to Democratic control of the Senate continues to look even more likely.