- by New Deal democrat
Total confirmed COVID-19 infections: 21,046,195*
Infections last 7 days average: 219,253
Total deaths: 357,258
Deaths last 7 days average: 2,670
Total vaccinations: 4,836,489
*A study just released, based on random blood samples, suggests that as many as 50,000,000 Americans may have already been infected. Because some of the positive tests may be based on exposure to other coronaviruses, I do not think the number is that high. But my own guess is that the “true” number might be about 30,000,000, or 1 in every 11 Americans.
Today I want to focus on comparing this winter’s breakout with last spring’s and summer’s, by comparing the top and bottom 25 States with the “poster children” for each of the past breakouts.
Seven day average of new infections
Bottom 25
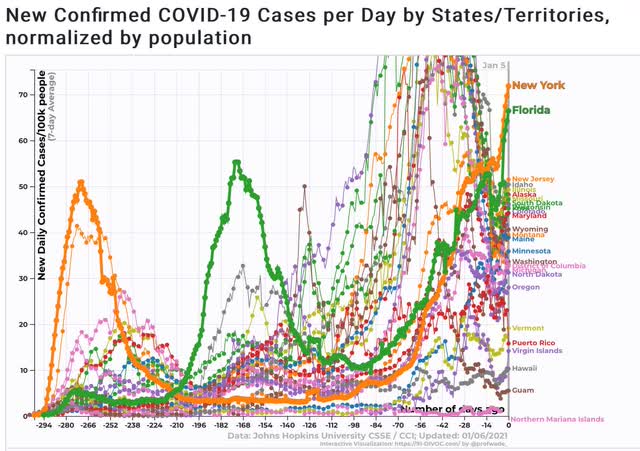
Top 25
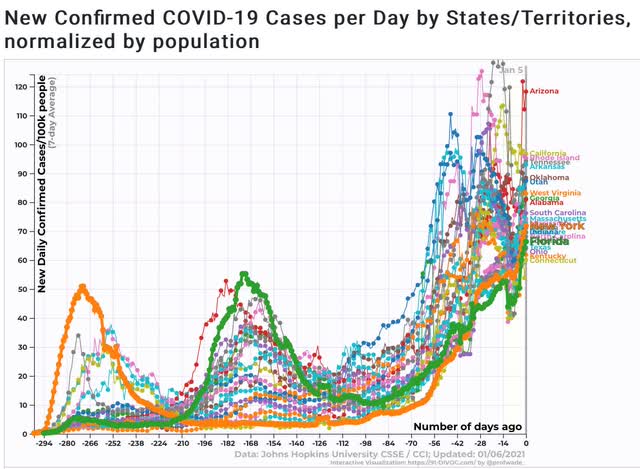
Not only do *all* of the top 25 now exceed the infection rate of the 2 poster children for the previous breakouts, but many of the bottom 25 are in the same ballpark as well. Among the 50 States, only Vermont and Hawaii have some semblance of control.
Seven day average of hospitalizations
Bottom 25
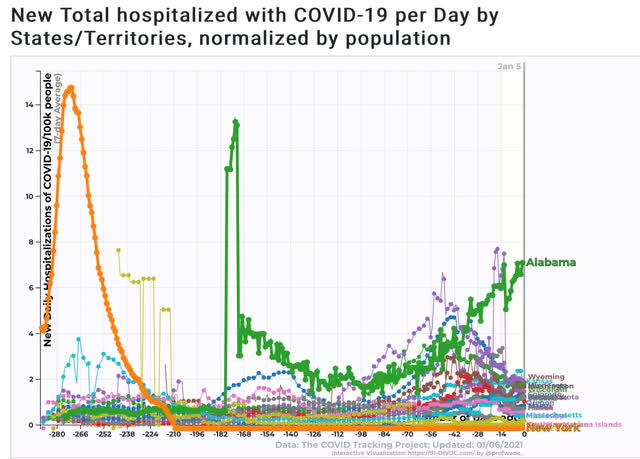
Top 25
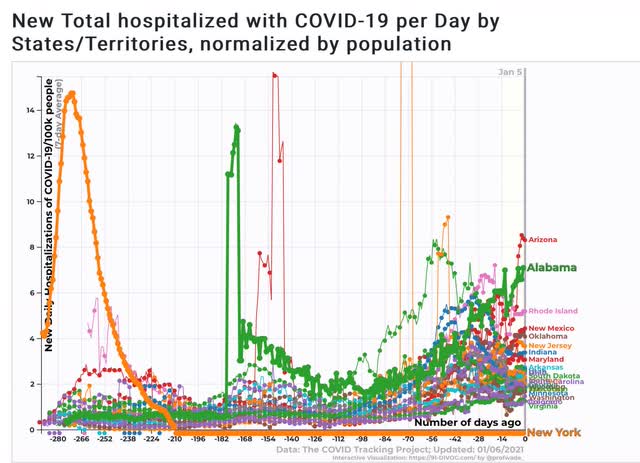
So far, only about 6 of the States have hospitalization rates equivalent to those of the past 2 outbreaks. But because hospitalizations lag infections by about 2 weeks, we can expect over half of all the States to have hospitalization rates at or near emergency conditions by the time Biden becomes President on the 20th.
Seven day average of deaths
Bottom 25
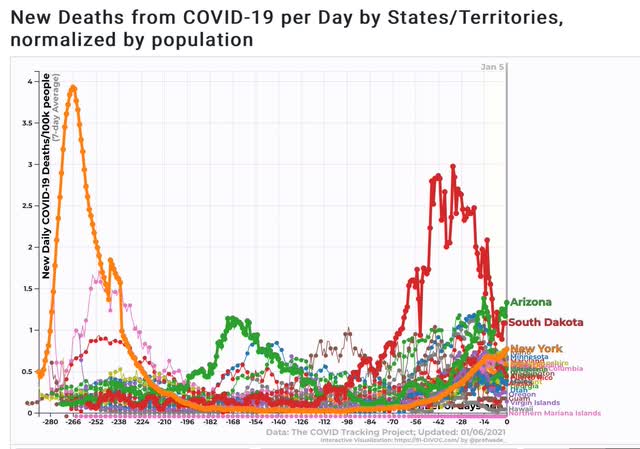
Top 25
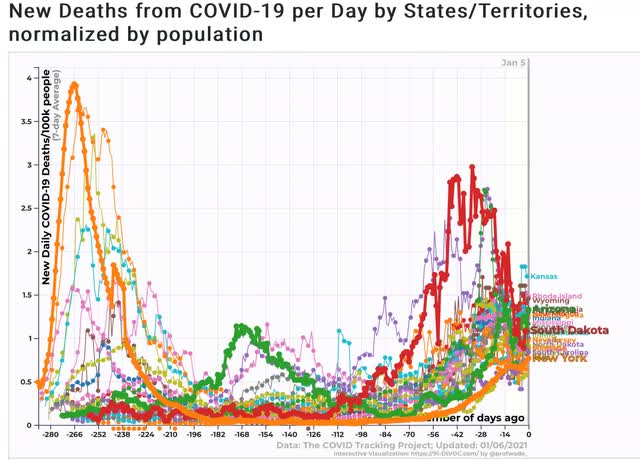
Many States are already showing a rate of deaths that is roughly half of that of the peak during the summer outbreak. About a dozen have already exceeded it. Note the inclusion of South Dakota as a recent prior peak - it wasn’t broken out separately for infections or deaths because, in view of subsequent data, it doesn’t stand out there. In other words, if deaths follow a similar trajectory, by Valentine’s Day we should expect to see a death rate for most States on par with South Dakota’s recent experience, and roughly 2/3’s of that of NY and NJ during the early spring outbreak.
This is utterly ghastly, and it is already “baked in the cake.”
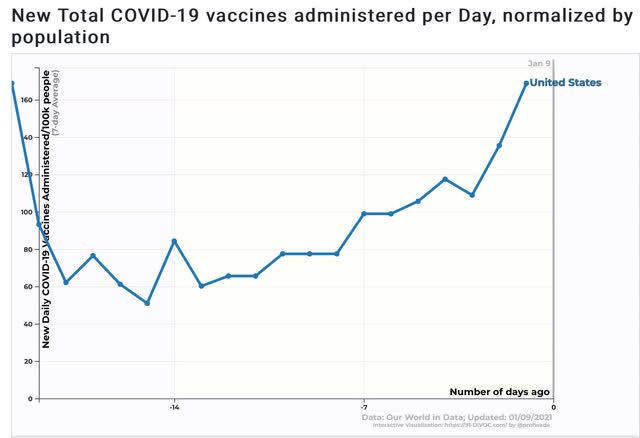
Finally, here is the 7 day rate of new infections (finer line) vs. 7 day rate of vaccinations (heavier line)(note separate scales):
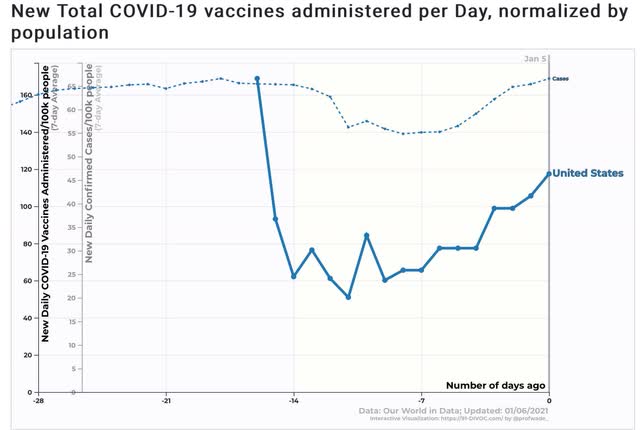
New infections so far are completely outrunning vaccinations, by close to a 4:1 pace. Less than 175,000 vaccinations are taking place daily as of the most recent data point. We need to get that up to 1,000,000 per day if not more just in order to have the population vaccinated by the end of 2021.