Saturday, April 17, 2021

Weekly Indicators for April 12 - 16 at Seeking Alpha


 - by New Deal democrat

My Weekly Indicators post is up at Seeking Alpha.

The big call I made last year is that conditions were setting up for a Boom this year, once the pandemic started to be overcome. Well, almost half of all Americans have received at least one dose of vaccine, and all the signs are that the Boom is well and truly upon us.

So the nowcast and short term forecast is all about chronicling the Boom, while the long term forecast is about what happens as the Boom begins to fade.

As usual, clicking over and reading will bring you up to the virtual moment about the economy, while rewarding me just a little bit for my efforts.

Friday, April 16, 2021

Why March’s big jump in real retail sales augurs well for big employment gains through summer


 - by New Deal democrat

Yesterday I wrote that the steep decline in new jobless claims in the past 4 weeks likely presages another big monthly employment gain, on the order of 1 million or more jobs.


Another very big positive for the next few months in employment is the massive, stimulus-fueled jump in retail sales.

As I have pointed out many times, real retail sales (blue in the graph below, /2 for scale) tend to lead employment (red) by about 3-4 months. Here’s the long term YoY look from 1993 on, averaged quarterly to cut down on noise:


I’ve also included aggregate hours (gold) in the above. Hours tend to be cut more than jobs in recessions, and increase faster in recoveries. The pandemic has been somewhat unique in that, for obvious public health reasons, jobs were cut entirely rather than just hours. Note also the “China shock” in the first few years after 1999, when both jobs and hours continued to be cut, even after sales had rebounded.

But saying that there is likely to be a big YoY jump in jobs in the next several months is hardly surprising, given the 22 million loss in jobs last April. So the below graph compares the absolute data, sales on the left scale, and employment on the right:


Again, the brief lag with which employment follows sales is obvious. The most important takeaway is that, if the big March gain in sales isn’t taken back in the next month or two, then there’s likely to be a similarly large jump in employment by the end of summer. A gain of another 4 to 6 million jobs, to close to the pre-pandemic peak, is quite possible.

March housing permits and starts - don’t get too excited


 - by New Deal democrat

Don’t get too excited about this morning’s big jump in housing starts for March. In the first place, it wasn’t confirmed in either total or single family permits, which both remain down from December and January, and the latter of which is the least of all housing numbers:


Also, the big jump in starts is mainly a rebound from February’s Big Texas Freeze. February and March starts together average 1599 annualized, which is significantly below the December and January pace.

And no, I’m not cherry picking. I checked, and here is how I led my report on housing permits and starts one month ago:

The headline numbers for both permits and starts for February, released this morning, were both poor, off -10.8% and -10.3%, respectively. The temptation is to say, “higher interest rates, We’re DOOOMED!!!” Not so fast. In context, the declines were well within normal month to month variation, and at least some of the declines looks like more fallout from the Big Texas Freeze that we saw yesterday in industrial production and retail sales.
Higher mortgage interest rates and surging prices are having an effect. To the extent there is a surprise, it’s that there hasn’t been a bigger effect so far.


Finally, here is something that concerns me. One twitter account I usually peak in on, more for political tweets than anything else, had this to say:


Here’s the problem. Here’s the time stamp of the above tweet:


How did this person know about a big jump in housing starts 24 hours before the Census Bureau published the information?

Thursday, April 15, 2021

Industrial production for March disappoints - but only on the surface


 - by New Deal democrat

As an initial note, retail sales for March blew out to the upside, but as expected due to cosnumers’ spending their latest pandemic stimulus checks. This does have implications for future jobs reports, but I will report on that tomorrow. But to the main point . . . 

Industrial production rose in March, but disappointingly - on the surface at least - did not recover to its level in January, as shown below in the graph of total production (blue) and the manufacturing. component (red):


But on closer examination, the reasons for the shortfall put an entirely different gloss on the numbers.

First of all, one of the three components of production, besides manufacturing and mining, is utilities, as to which the Fed appended this note:

The drop of 11.4 percent for utilities in March was the largest in the history of this index (since 1972).”

This was probably due to much fairer weather than expected during the month.

Further, as to manufacturing, the Fed noted:

The output of motor vehicles and parts rose 2.8 percent in March after falling 10 percent in February. Shortages of semiconductors held down vehicle production in both months, while cold weather also curbed production in February.”


In other words, had it not been for a bottleneck in supply, industrial production would have rebounded much more sharply in March.

This is very bullish for production in the immediate future. I think we may see production all the way back at pre-pandemic levels by the end of summer.

Jobless claims break on through - 1M+ jobs report for April looks likely


 - by New Deal democrat

As I have said for the past few weeks, new jobless claims are likely to the most important weekly economic data for the next 3 to 6 months. With the number of those vaccinated continuing to increase, I have been expecting a big increase in renewed consumer and social activities, with a concomitant gain in monthly employment gains - as we saw in the March jobs report.

Four weeks ago I set a few objective targets: new claims to be under 500,000 by Memorial Day, and below 400,000 by Labor Day. 

This week was a major advance towards those targets.

On a unadjusted basis, new jobless claims declined by 152,833 to 612,919. Seasonally adjusted claims declined by 193,000 to 576,000 (with last week’s number being adjusted upward by 25,000). The 4 week average of claims also declined by 42,250 to 683,000. 

Here is the close up since last August (recall that these numbers were in the range of 5 to 7 million at their worst in April of last year): 


Note that I have discontinued the YoY comparisons, since we would be comparing agains the very worst weeks of the initial lockdowns last year.

Continuing claims, which historically lag initial claims by a few weeks to several months, and which are reported with a one week lag, in something of an unusual occurrence, failed to make another new pandemic low this week. While the unadjusted number did decline 87,991 to 3,936,696, which was a new low, the seasonally adjusted number of continuing claims rose by 4,000 to 3,731,000:


Seasonally adjusted continued claims are at levels last seen in the summer of 2011, when weekly jobless claims were just over 400,000 and the unemployment rate was 8.2%.

In the last 4 weeks, since the March reference week for the jobs report, initial claims have declined on average by 68,750 m/m. This kind of decline has happened less than a dozen times since data started to be collected almost 60 years ago, and even in normal times has typically been associated with strong monthly employment gains on the order of +350,000. When we had a similar decline last August, the monthly gain in jobs was about 1,600,000. 

In other words, barring big revisions or a reversal next week, April’s jobs report could easily show well over 1,000,000 new jobs added. 

Let me close, however, with the caveat I added last week: I am growing more concerned at the big spike in new coronavirus cases from the now-dominant UK variant in Michigan and the Northeast. the recent decline in deaths has plateaued and may have begun to increase slightly. It is at least reasonably possible that this will counterbalance progress on the vaccine front for the next 2 to 3 months.

Wednesday, April 14, 2021

Wealth distribution in the US continues to be a first order economic issue


 - by New Deal democrat

Tomorrow is one of those days when just about Every Economic Statistic in the World will be released. In the meantime, no new data today.

So, while we wait, let me send you over to this article by Wolf Richter analyzing the distribution of wealth and assets in the US updated by the Fed through the end of last year.

Unsurprisingly, the rich have gotten richer, and their preferred asset classes are the most protected by the tax code.

Just one of many first-order economic problems in the US. Wealth, once entrenched - most particularly when it is unearned and inherited - will never be voluntarily disgorged. The beneficiaries would rather give up democracy, give up the Rule of Law, rather than see their privileged status compromised.

Tuesday, April 13, 2021

Monthly consumer inflation rate increases by most in 10 years; real wages decline, but real aggregate wages increase


 - by New Deal democrat

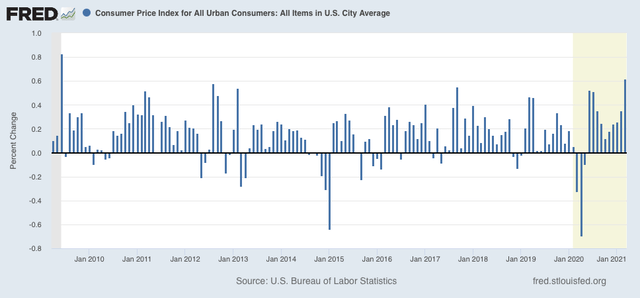
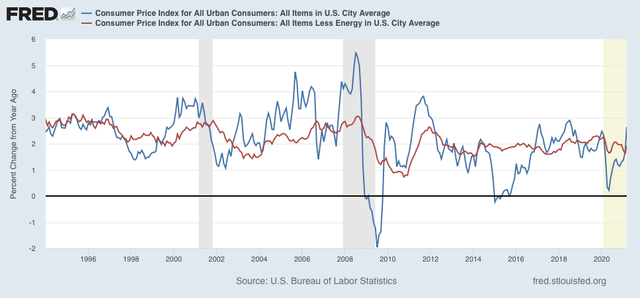
Seasonally adjusted consumer prices rose 0.6% in March. This was the biggest single month gain since June 2009, coming out of the Great Recession:


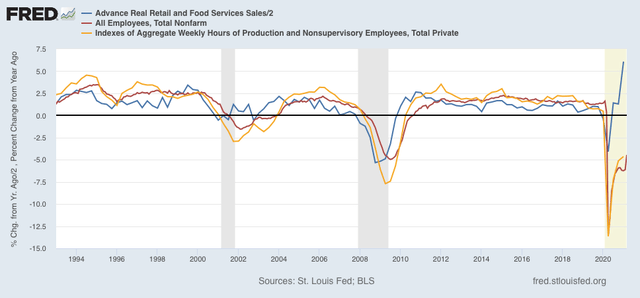
Leaving aside the pandemic, since the 1980s recessions have only happened when CPI less energy costs (red) had risen to close to or over 3%/year, usually driven by increases in the price of oil by more than 40% YoY. Even with this month’s spike, YoY inflation ex-energy is only up 1.9%:


Because in the first few months of the pandemic during the lockdowns there was a spurt of deflation as shown above in the first graph, in the below graph I’ve normed the values to 100 as of May of last year. In the 9 months since, total inflation has been up 3.5% (for a 4.7% annual rate), while inflation ex-energy has risen 2.0%, (for a 2.7% annual rate):


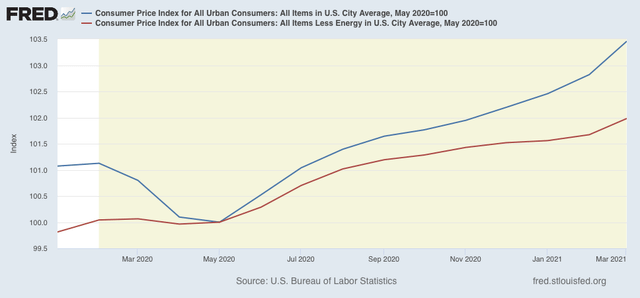
This is still not enough to be of concern on a transient basis.

Now let’s take a look at how inflation has affected real wages. 

Because wages are “stickier” than prices, typically as recessions beat down prices (or at least price increases), in real terms wages rise, either during or just after a recession. That was the case for the coronavirus recession as well. As prices increase with renewed demand, and employers are able to add workers from the larger pool of the unemployed and underemployed, real wages decelerate and even decline.

That was the case for March. Real wages declined -0.5%, and are -3.1% off their all-time high set last April:


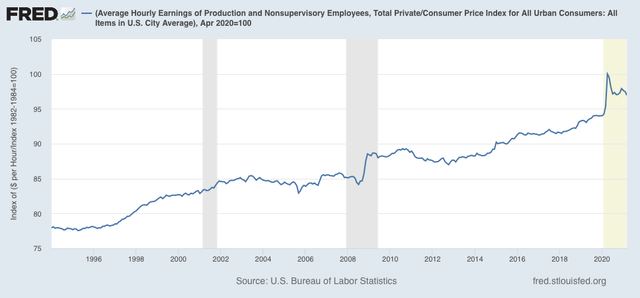
They are still 0.9% above their previous 1973 peak.

As more low-wage employees in service industries like dining and entertainment are called back to work, the YoY% change in real wages has decreased from over 7% last April to 1.9% in March:

 
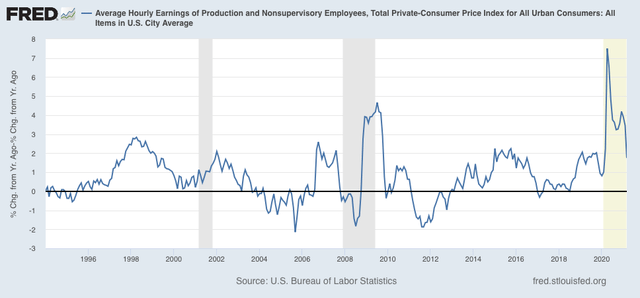
A further decline in real wages is quite likely. As a result, YoY real wage increases have declined from over 5% last I suspect we will see an actual YoY decline in real wages by the end of this year.

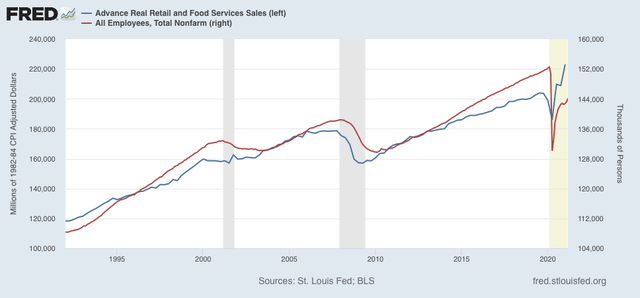
A bright spot is that real *aggregate* payrolls for nonsupervisory workers did increase:


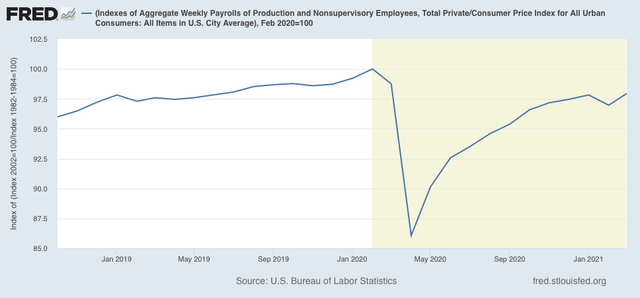
These are now only -2.1% below their pre-pandemic peak, and equivalent to where they were in July 2019. If vaccinations succeed in controlling the pandemic, it is quite likely that these make a new all-time high by the end of the year as well.

Monday, April 12, 2021

Coronavirus dashboard for April 12: more good news, more bad news


 - by New Deal democrat

The good news is, vaccinations work.


Vaccine effect in the UK:


By age group:


Vaccine effect in France (in the face of an increasing case count):


Vaccine effect even in Chile:


While confirmed cases have gone up by 100% in Chile, deaths have “only” gone up by 50%. Even employing a 4 week lag, 4 weeks ago cases had gone up 50%, while deaths are up 33% from 4 weeks ago:


Vaccine effect in the US:


Now, the bad news.

A 4th wave has clearly begun in the US, as confirmed cases are up over 30%, from 53,300 3 weeks ago to just over 70,000. Deaths have plateaued:


One week ago I said that Michigan would be the acid test for what happened with deaths in the face of a 4th wave of infections even with a substantial portion of the population having been vaccinated. And the news is not good:


Deaths have followed new infections higher with a 3.5 week lag. And worse, so far deaths have increased at the same rate as new infections since the bottom.

One final note: I have seen several stories recently about “breakthrough” infections, I.e., infections which are claimed to have begun *after* a person was fully vaccinated, and even a few hospitalizations and deaths. There are two important caveats to those stories: 

(1) the studies are based on *diagnoses* more than 14 days after the 2nd vaccination. They are not based on *when the person was infected.* In other words, a person who first felt symptoms and got tested 14 days or more after their 2nd vaccination may well have been infected shortly after, or even *before* their 2nd shot. These studies would have a lot more credibility if the test were first performed more than 28 days after the 2nd shot, so that the infection would have almost certainly begun more than 14 days later. Until we see such studies, take the “breakthrough” claims with many grains of salt. 

(2) the vaccines have never been claimed to be 100% effective. At roughly 95% effective, that means a certain small number of infections are still likely to take place. As yet, however, I do not know of even a *single* death that we are sure resulted from an infection that began more than 14 days after a person’s 2nd shot.