Saturday, April 11, 2020
Weekly indicators for April 6 - 10 at Seeking Alpha
- by New Deal democrat
My Weekly Indicators post is up at Seeking Alpha..
As you can imagine, most of the numbers are horrible.
Clicking over and reading will bring you as up to date as you can be on the economy, and as usual rewards me a little bit for my efforts.
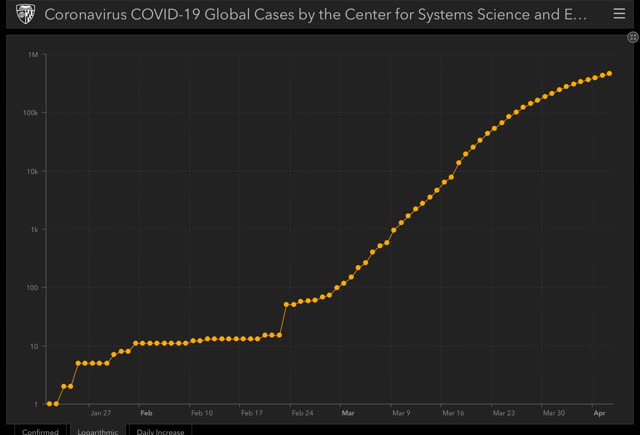
Coronavirus dashboard for April 11: new high in daily infections as testing falls further behind
- by New Deal democrat
Here is the update through yesterday (April 10)
I’ve changed the format, moving the “just the facts, ma’am” data to the top, and comments to the end. Significant new developments are indicated in italics.
The four most important metrics are starred (***) below.
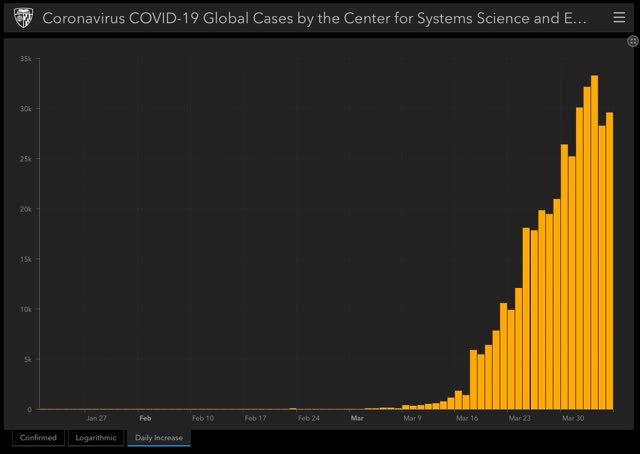
Number and rate of increase of Reported Infections (from Johns Hopkins via arcgis.com)
- Number: up +35,219 to 501,615 (vs. 33,958 prior peak on April 9)
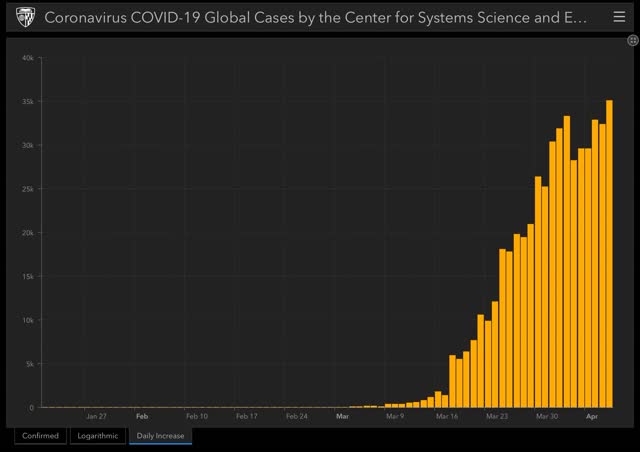
- ***Rate of increase: day/day: 8% (vs. 9% for the past week, and 8% on April 9)
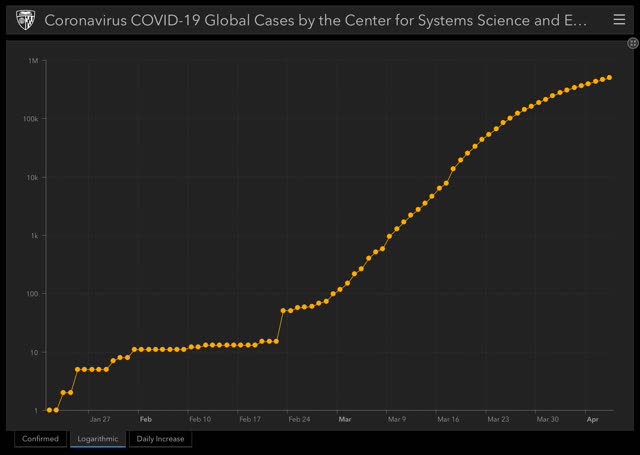
The exponential growth rate began to fall from 35% on March 24. In the past two weeks it was in a slowly decelerating trend of between -0.5% and -1%/day. In the past 5 days that has nearly come to a halt.
It’s not clear if this is a shortcoming in State lockdowns which appeared to have been working, or a shortcoming in testing, but I strongly lean towards the latter explanation.
Ben Engebreth is tracking coronvirus infection and testing numbers for each State, with graphs, here. Also, there is an awesome interactive tool to measure infections and other data for various countries and US States at 91-divoc.com.
Number of deaths and infections and rate of increase of testing (from COVID Tracking Project)
- ***Number of deaths: Total 18,488, up +2,089 day/day
- Rate: increase of 13% day/day vs. average of 15% in past week
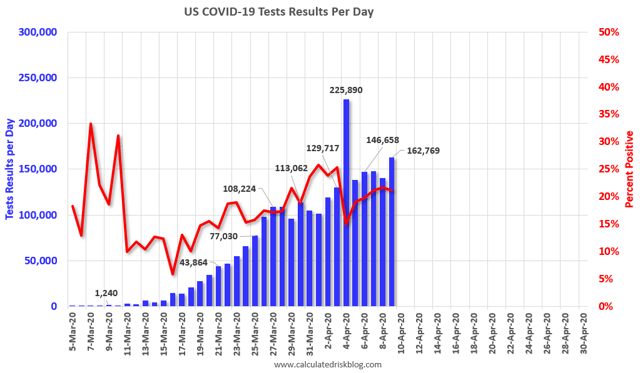
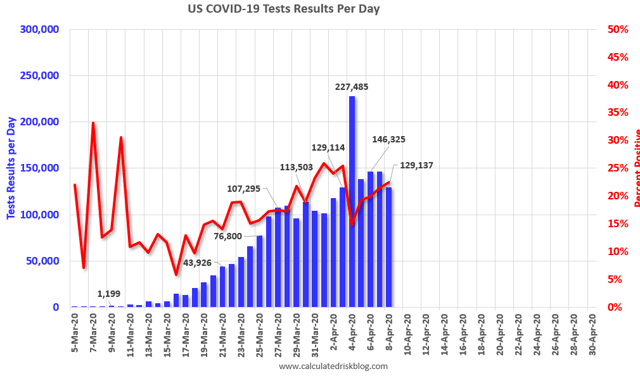
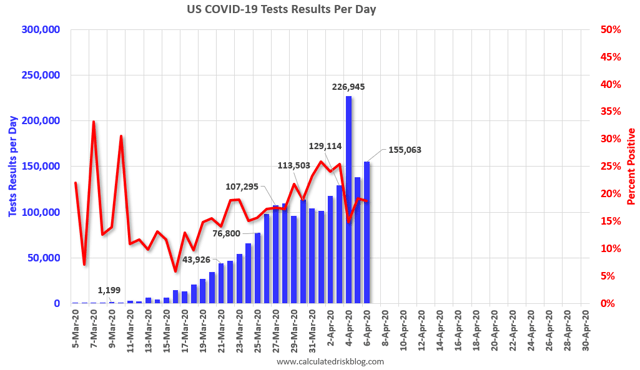
- Number of tests: 153,514 down -9,255 day/day, new daily high for non-“pending” tests
- Rate: decrease -6% vs. number of tests previous day
- Tests pending result: 17,631 vs. 17,631 on April 9 day/day
Comparison of rates of increase in documented infections vs. testing
- Infections +8% vs. Tests -6% day/day
Result: The rate of testing appeared to be catching up a little bit to the spread of the virus, but stalled again in the past week at about 140,000/day. It remains far below what is needed, which is probably now at least 250,000/day, and is falling further behind.
Ratio of tests to positives for infection (from COVID Tracking Project)
- Number: 153,514 new tests vs. 34,204 new diagnosed infections
- ***Ratio: 4.5:1
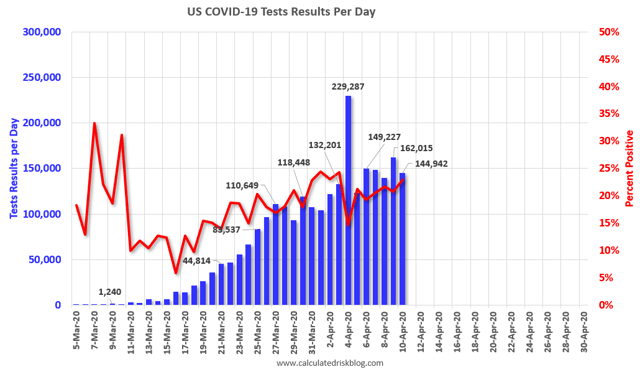
In South Korea, the inflection point where the number of new daily cases plateaued was reached when the ratio of tests to new cases found reached 15:1. Any ratio less than that suggests that not enough testing is being done. Yesterday’s ratio of 4.5:1 is not only far behind, but has gotten worse in the past 7 days. Along with a number of others, I am very concerned that insufficient testing is hiding the increasing spread of the virus. That the percentage of positive results to total tests keeps rising only heightens that concern — i.e., we are not finding new potential breakouts. Yesterday’s pattern - decreasing tests with the highest ever number of positives - is the worst situation.
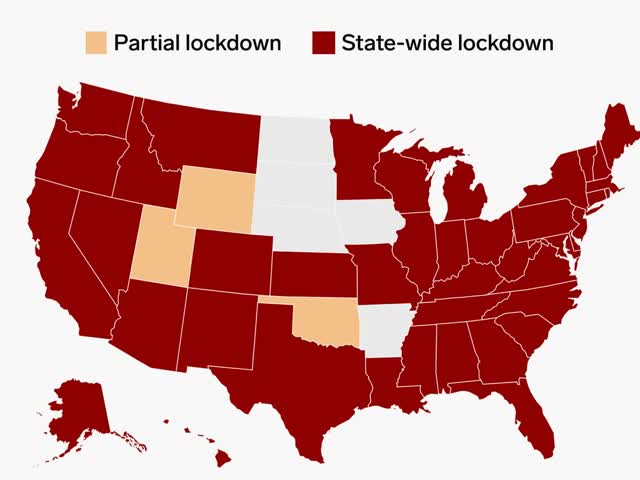
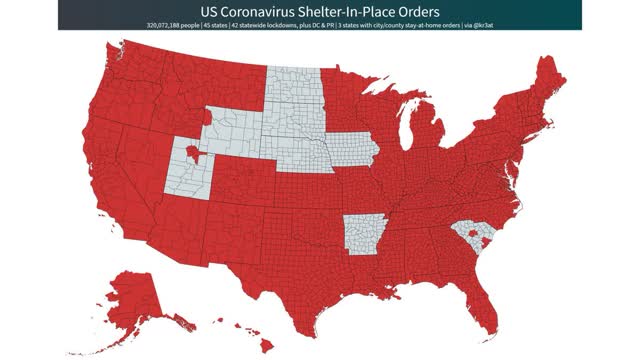
US States and population in total lockdown, business lockdown, and partial restrictions - no changes in past 24 hours
- ***Total lockdown: 43 States, 306.7 million, 92.4%
- ***Business lockdown: 2 States (KY, MA^^) 14.4 million, 4.3%
- Partial restrictions on business (bars, restaurants): 5 States (IA, ND^, NE, UT*^, WY^) 9.7 million, 2.9%
- School closure only: 2 States (AR^, SD*) 3.9 million, 1.2%
- No mandatory restrictions: NONE
*some local areas under lockdowns
^restrictions on or quarantine of travelers from out of State
^^mandatory quarantine of persons attending Easter services(!)
There have been no meaningful changes in the past day.
US States with “test, trace, and quarantine” programs
- Under development: 6 States: CT, MA, MD, NJ, NY, UT
Summary for April 10
The best public health strategy is that of a temporary total lockdown to turn the new infection rate negative while the production and distribution of necessary medical equipment to treat existing cases and for a massive “test, trace, and quarantine” to be put in place.
Here’s how we stand (meaningful new developments in italics):
- About 95% of the total US population is under total lockdown.
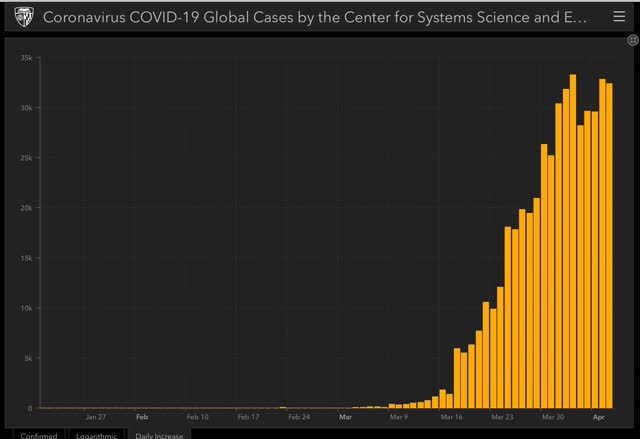
- Yesterday the US recorded a new high in daily new infections.
- Mandatory lockdowns have brought the rate of growth in new infections down to just below 8%/day, but this deceleration has stalled in the past week. Most likely, this is because of the next bullet point.
- The number of daily tests appears to have stalled again at about 140-150,000. As a result, we appear to be missing an increasing number of actual new infections.
- The Trump Administration has still not mandated a nationwide lockdown, and in fact appears to want to “open up” society on or by May 1, even without a testing regimen in place.
- The Trump Administration has taken no meaningful steps to mandate mass production of necessary medical equipment.
- The Trump Administration has taken no steps towards a nationwide “test, trace, and quarantine” plan that will be needed to lift lockdowns, or to assist States to do so.
- In the absence of federal action, various States are either coordinating in making purchases of the necessary equipment, and/or to develop their own “test, trace, and quarantine” plan.
- Until States or the federal government implement a regimen of “test, trace, and quarantine,” lockdowns cannot be lifted.
- Kentucky’s governor has announced that people who disregard the State’s social distancing order to attend Easter services will be placed in quarantine.
- Google and Apple have premiered an app under development that will trace coronavirus contacts
Friday, April 10, 2020
(Abbreviated) coronavirus dashboard for April 10
- by New Deal democrat
Here is the update through yesterday (April 9). Real life intrudes a little, so I have omitted the State by State analysis, and abbreviated the conclusions.
I’ve changed the format, moving the “just the facts, ma’am” data to the top, and comments to the end. Significant new developments are indicated in italics.
The four most important metrics are starred (***) below.
Number and rate of increase of Reported Infections (from Johns Hopkins via arcgis.com)
- Number: up +33,958 to 466,636 (vs. 33,787 prior peak on April 4)
- ***Rate of increase: day/day: 8% (vs. 10% for the past week, and 8% on April 8)
The exponential growth rate began to fall from 35% on March 24. In the past two weeks it was in a slowly decelerating trend of between -0.5% and -1%/day. In the past 4 days that has nearly come to a halt.
Nevertheless, State lockdowns have been working.
Ben Engebreth is tracking coronvirus infection and testing numbers for each State, with graphs, here. Also, there is an awesome interactive tool to measure infections and other data for various countries and US States at 91-divoc.com.
Number of deaths and infections and rate of increase of testing (from COVID Tracking Project)
- ***Number of deaths: Total 16,399, up +1,904 day/day
- Rate: increase of 13% day/day vs. average of 14% in past week
- Number of tests: 162,769 up +21,460 day/day, new daily high for non-“pending” tests
- Rate: increase +15% vs. number of tests previous day
- Tests pending result: 17,631 vs. 17,228 on April 8 day/day
Comparison of rates of increase in documented infections vs. testing
- Infections +8% vs. Tests +15% day/day
Result: The rate of testing appeared to be catching up a little bit to the spread of the virus, but stalled again in the past week at about 140,000/day. Even with yesterday’s 20,000+ increase, it remains far below what is needed, which is probably now at least 250,000/day, and is falling further behind.
Ratio of tests to positives for infection (from COVID Tracking Project)
- Number: 162,769 new tests vs. 34,326 new diagnosed infections
- ***Ratio: 4.7:1
In South Korea, where aggressive testing has led to a near-total disappearance of new cases, the inflection point where the number of new daily cases plateaued was reached when the ratio of tests to new cases found reached 15:1. Any ratio less than that suggests that not enough testing is being done. Yesterday’s ratio of 4.7:1 is not only far behind, but has gotten worse in the past 4 days. I am very concerned that we face a situation similar to what we had a month ago, where insufficient testing was hiding the spread of the virus. That the percentage of positive results to total tests keeps rising only heightens that concern — i.e., we are not looking for new potential breakouts. Yesterday’s pattern - where an increase in testing of 14% led to an increase positive diagnoses of 12% , only reinforces that position.
Summary for April 10
There are 3 items of significance that happened in the past day:
- The number of new diagnoses made a new high, superseding the recent April 4 high
- A 15% increase in testing, to a new high ex-“pending” results, netted a 12% increase in new diagnoses. In other words, about all the increase in testing did was show how many new infections we have been missing.
- Trump was forced to backtrack on ending funding for community test centers, but again put forward an early end to lockdowns (which the federal government does not have the power to force on the States anyway) which, if implemented, would only result in renewed exponential spread.
Consumer prices sharply decline in March: keep your eye on wages
- by New Deal democrat
This morning we got some monthly economic data that will be actually valuable to watch throughout this Coronavirus Recession: consumer prices. That’s because during recessions, consumer price growth decelerates, as does wage growth, which continues to decelerate well after the recession bottoms out.
Since monthly changes in inflation are closely correlated with the gas prices, let’s start by comparing the two:
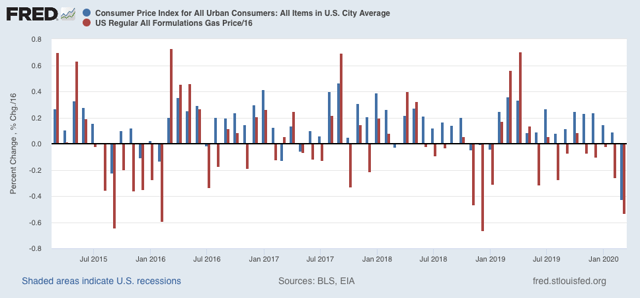
Gas prices declined -8.5% during March. Unsurprisingly, consumer prices followed suit, declining by -0.4%.
Next, let’s compare overall consumer inflation (blue again) with consumer inflation ex-energy (red), since prior to the past two recessions the latter had increased by 2.5% or more YoY:
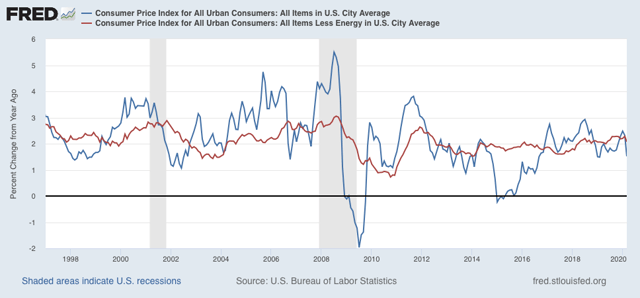
We were on the cusp of that 2.5% threshold just before this recession hit. Note that inflation ex-energy tends to follow overall inflation with a slight lag. If gas prices remain depressed, we can expect this “core” inflation measure to decelerate substantially as well. This is par for the course during a recession.
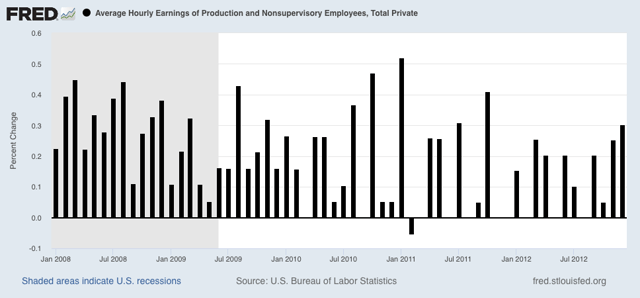
What is much more worrisome to me is whether wage growth, which came close to completely stalling even nominally during and after the Great Recession, with 16 months of wage growth of less than +0.1%, as shown below, might actually tip into deflation this time around - a concern that I have repeated numerous times during the past expansion:
Here is what YoY wage growth (black) looks like in comparison with consumer prices ex-energy (red):
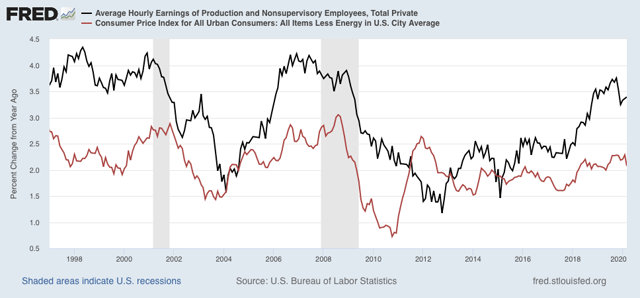
Expect wage growth to decelerate sharply almost immediately. Should it ever tip into negative territory, that would open the door almost instantaneously to a vicious wage-price deflationary spiral, the type of which was last seen during 1929-32. Keep your fingers very crossed.
Thursday, April 9, 2020
Coronavirus dashboard for April 9: Are new cases peaking? Or is a lack of testing failing to pick up continued spread?
- by New Deal democrat
Here is the update through yesterday (April 8) (NOTE: significant new developments in italics)
I’ve changed the format, moving the “just the facts, ma’am” data to the top, and comments to the end.
The four most important metrics are starred (***) below.
Number and rate of increase of Reported Infections (from Johns Hopkins via arcgis.com)
- Number: up +32,509 to 432,438 (vs. 33,787 peak on April 4)
- ***Rate of increase: day/day: 8% (vs. 10% for the past week, and 9% on April 7)
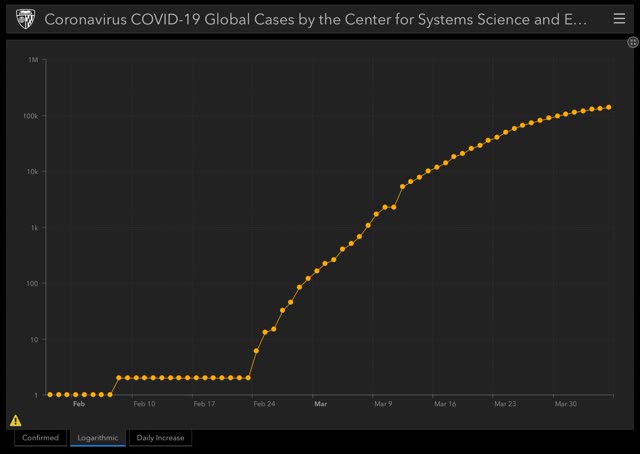
The exponential growth rate began to fall from 35% on March 24. It now looks like in the past 10 days or so it has been in a new, slowly decelerating trend, declining by between -0.5% and -1%/day. Here’s a good graph of that trend if a few days old:

State lockdowns appear to be working.
Ben Engebreth is tracking coronvirus infection and testing numbers for each State, with graphs, here. Also, there is an awesome interactive tool to measure infections and other data for various countries and US States at 91-divoc.com.
Number of deaths and infections and rate of increase of testing (from COVID Tracking Project)
- ***Number of deaths: Total 14,405, up +1,874 day/day
- Rate: increase of 15% day/day vs. average of 16% in past week
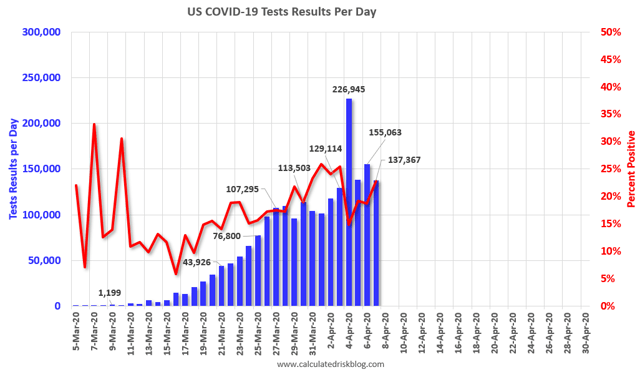
- Number of tests: 141,309 down -4,796 vs. 155,063 recent peak on April 6
- Rate: decrease -3% vs. number of tests previous day
- Tests pending result: 17,228 vs. 16,557 on April 7 day/day
Comparison of rates of increase in documented infections vs. testing
- Infections +8% vs. Tests -3% day/day
Result: The rate of testing appeared to be catching up a little bit to the spread of the virus, but has stalled again in the past week at about 140,000/day. It remains far below what is needed, which is probably now at least 250,000/day, and is falling further behind.
Ratio of tests to positives for infection (from COVID Tracking Project)
- Number: 141,309 new tests vs. 30,570 new diagnosed infections
- ***Ratio: 4.6:1
In South Korea, where aggressive testing has led to a near-total disappearance of new cases, the inflection point where the number of new daily cases plateaued was reached when the ratio of tests to new cases found reached 15:1. Any ratio less than that suggests that not enough testing is being done. Yesterday’s ratio of 4.6:1 is not only far behind, but has gotten worse in the past 4 days. I am very concerned that we face a situation similar to what we had a month ago, where insufficient testing was hiding the spread of the virus. That the percentage of positive results to total tests keeps rising only heightens that concern — i.e., we are not looking for new potential breakouts.
US States and population in total lockdown, business lockdown, and partial restrictions - no changes in past 24 hours
- ***Total lockdown: (SC joined yesterday) 43 States, 306.7 million, 92.4%
- ***Business lockdown: 2 States (KY, MA) 14.4 million, 4.3%
- Partial restrictions on business (bars, restaurants): 5 States (IA, ND^, NE, UT*^, WY^) 9.7 million, 2.9%
- School closure only: 2 States (AR^, SD*) 3.9 million, 1.2%
- No mandatory restrictions: NONE
*some local areas under lockdowns
^restrictions on or quarantine of travelers from out of State
There have been no meaningful changes in the past day.
US States with “test, trace, and quarantine” programs
- Under development: 6 States: CT, MA, MD, NJ, NY, UT
Summary for April 9
Almost every public health authority who has weighed in has advocated the “Sledgehammer, then Scalpel” approach of a temporary total lockdown, during which time, as the infection rate of growth hopefully moves to flat, the production and distribution of necessary medical equipment is surged. Once enough is in place, a regimen of “test, trace, and quarantine” can be put in place as the lockdown is lifted.
Here’s how we stand (meaningful new developments in italics):
- About 95% of the total US population is under total lockdown.
- Mandatory lockdowns, first implemented on Statewide bases 20 days ago, appear to be paying off, as the daily rate of increase in new cases is now in single digits. The peak in new daily infections might only be about 10 days away - and may possibly have already happened on April 4)
- BUT the number of daily tests appears to have stalled again at about 140-150,000, and is far short of of what is necessary. As a result, we may be missing an increasing number of actual new infections, meaning that the slowdown in diagnosed infections might be an artifact of the lack of testing, rather than a true result.
- The Trump Administration has still not mandated a nationwide lockdown.
- The Trump Administration has taken no meaningful steps to mandate mass production of necessary medical equipment.
- The Trump Administration has taken no steps towards a nationwide “test, trace, and quarantine” plan that will be needed to lift lockdowns, or to assist States to do so.
- To the contrary, the Trump Administration has announced an end to support of community testing.
- California’s governor has announced a plan for the States to coordinate in making purchases of the necessary equipment.
- Massachusetts has begun to develop its own “test, trace, and quarantine” plan. The governor of Connecticut announced two days ago that it, NY and NJ will also work on a regional plan. Utah and Maryland are also said to be developing their own plans.
- Until States or the federal government implement a regimen of “test, trace, and quarantine,” lockdowns cannot be lifted.
- Contrarily, North Dakota, a State with no lockdown, lifted part of its interstate travel restrictions yesterday.
Wednesday, April 8, 2020
The superiority of stay at home orders vs. voluntary social distancing: two graphic proofs
- by New Deal democrat
Here are a couple of graphs I pulled last week that I’ve been meaning to post. Together they show that mandatory “stay at home” orders have been much more effective than voluntary social distancing.
First, here is a graph of the “change in distance traveled” by county during March:
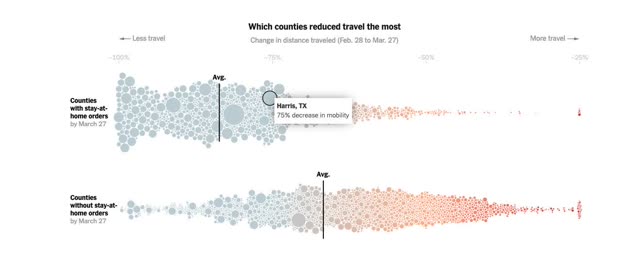
While almost all counties showed a sharp decline in the average distance travelled - the average decline in counties with only voluntary “social distancing orders” was about -66%, while the average in counties with a mandatory “stay at home” order was over 80%.
Second, here is a graph of the average decline compared to normal distance traveled during the latter part of March:
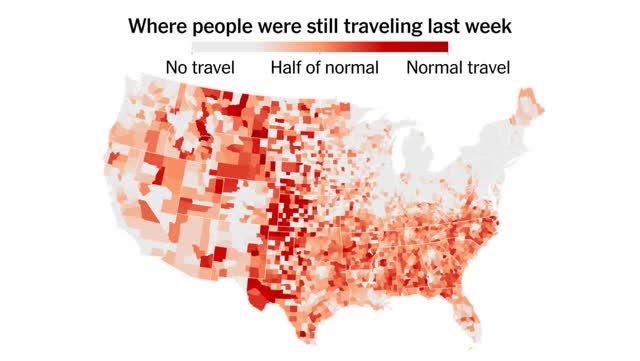
This graph largely overcomes the “retail desert” critique that people in rural areas must travel long distances to, e.g., the nearest grocery store, since it is a companison against *normal* travel in that area. Note that rural areas like West Virginia, parts of Indiana, and northern Michigan show a much sharper decrease in travel than areas in the South and Great Plains that were not under mandatory “stay at home” orders as of March 26 when the data was gathered.
It is not surprising that the sharp deceleration in the day by day increases in the number of infections happened once mandatory stay at home orders were issued. Since most of Dixie promulgated such orders within the past week or so, further deceleration is likely given the 2 week incubation period for the coronavirus.
Coronavirus dashboard for April 8: peak new infections *may* have occurred on April 4
- by New Deal democrat
Here is the update through yesterday (April 7)
I’ve changed the format, moving the “just the facts, ma’am” data to the top, and comments to the end.
The four most important metrics are starred (***) below.
Number and rate of increase of Reported Infections (from Johns Hopkins via arcgis.com)
- Number: up +31,480 to 368,449 (vs. 33,787 possible peak on April 4)
- ***Rate of increase: day/day: 9% (vs. 11% for the past week, and 9% on April 6)

The exponential growth rate began to fall from 35% on March 24. It now looks like in the past week or so it is in a new, decelerating trend, declining by about -1%/day. Here’s a good graph of that trend:
State lockdowns appear to be working.
Ben Engebreth is tracking coronvirus infection and testing numbers for each State, with graphs, here. Also, there is an awesome interactive tool to measure infections and other data for various countries and US States at 91-divoc.com.
Number of deaths and infections and rate of increase of testing (from COVID Tracking Project)
- ***Number of deaths: Total 12,621, up +1,941 day/day
- Rate: increase of 18% day/day vs. average of 17% in past week
- Number of tests: 146,105 down -8,958 vs. 155,063 on April 6 day/day
- Rate: decrease -6% vs. number of tests previous day
- Tests pending result: 16,557 vs. 17,292 on April 5 day/day
Comparison of rates of increase in documented infections vs. testing
- Infections +9% vs. Tests -6% day/day
Result: The rate of testing appeared to be catching up a little bit to the spread of the virus, but may have stalled again in the past few days. It remains far below what is needed, which is probably now at least 250,000/day.
Ratio of tests to positives for infection (from COVID Tracking Project)
- Number: 146,105 new tests vs. 31,363 new diagnosed infections
- ***Ratio: 4.7:1
In South Korea, where aggressive testing has led to a near-total disappearance of new cases, the inflection point where the number of new daily cases plateaued was reached when the ratio of tests to new cases found reached 15:1. Any ratio less than that suggests that not enough testing is being done. Yesterday’s ratio of 4.7:1 is still far behind.
US States and population in total lockdown, business lockdown, and partial restrictions - no changes in past 24 hours
- ***Total lockdown: (SC joined yesterday) 43 States, 306.7 million, 92.4%
- ***Business lockdown: 2 States (KY, MA) 14.4 million, 4.3%
- Partial restrictions on business (bars, restaurants): 5 States (IA, ND^, NE, UT*, WY^) 9.7 million, 2.9%
- School closure only: 2 States (AR^, SD*) 3.9 million, 1.2%
- No mandatory restrictions: NONE
*some local areas under lockdowns
^restrictions on or quarantine of travelers from out of State

There have been no meaningful changes in the past day.
US States with “test, trace, and quarantine” programs
- Under development: 4 States: CT, MA, NJ, NY
Summary for April 8
Almost every public health authority who has weighed in has advocated the “Sledgehammer, then Scalpel” approach of a temporary total lockdown, during which time, as the infection rate of growth hopefully moves to flat, the production and distribution of necessary medical equipment is surged. Once enough is in place, a regimen of “test, trace, and quarantine” can be put in place as the lockdown is lifted.
Here’s how we stand:
- Almost 95% of the total US population is under total lockdown.
- Mandatory lockdowns, first implemented on Statewide bases 19 days ago, appear to be paying off, as the daily rate of increase in new cases has steadily declining and is now in single digits. The peak in new daily infections might only be about 10 days away - and may possibly have already happened on April 4.
- The number of daily tests appears to have stalled again at about 140-150,000, and is far short of of what is necessary. As a result, we may be missing an increasing number of actual new infections.
- The Trump Administration has still not mandated a nationwide lockdown.
- The Trump Administration has taken no meaningful steps to mandate mass production of necessary medical equipment.
- The Trump Administration has taken no steps towards a nationwide “test, trace, and quarantine” plan that will be needed to lift lockdowns, or to assist States to do so.
- California’s governor has announced a plan for the States to coordinate in making purchases of the necessary equipment.
- Massachusetts has begun to develop its own “test, trace, and quarantine” plan. The governor of Connecticut announced yesterday that it, NY and NJ will also work on a regional plan.
- Until States or the federal government implement a regimen of “test, trace, and quarantine,” lockdowns cannot be lifted.
- Contrarily, in States with no lockdowns, Iowas’s governor called for a day of prayer; and North Dakota implemented a quarantine of travelers from Minnesota.
Tuesday, April 7, 2020
Coronavirus dashboard for April 7: lockdowns appear to be working
- by New Deal democrat
Here is the update through yesterday (April 6)
I’ve changed the format, moving the “just the facts, ma’am” data to the top, and comments to the end.
The four most important metrics are starred (***) below.
Number and rate of increase of Reported Infections (from Johns Hopkins via arcgis.com)
- Number: up +30,516 to 368,449 (vs. +25,688 on April 4)
- ***Rate of increase: day/day: 9% (vs. 12% for the past week, and 8% on April 4)
The exponential growth rate began to fall from 35% on March 24. It now looks like in the past week or so it is in a new, decelerating trend, declining by about -1%/day. Voluntary social distancing was clearly not enough, but the State lockdowns appear to be working.
Ben Engebreth is tracking coronvirus infection and testing numbers for each State, with graphs, here. Also, there is an awesome interactive tool to measure infections and other data for various countries and US States at 91-divoc.com.
Number of deaths and infections and rate of increase of testing (from COVID Tracking Project)
- ***Number of deaths: Total 10,680, up +1,182 day/day
- Rate: increase of 12% day/day vs. average of 16% in past week
- Number of tests: 155,063, up +16,838 vs. 138,225 on April 5 day/day
- Rate: increase +12% vs. number of tests previous day
- Tests pending result: 17,292 vs. 17,307 on April 5 day/day
Comparison of rates of increase in documented infections vs. testing
- Infections +9% vs. Tests +12% day/day
Result: The rate of testing is catching up a little bit to the spread of the virus. Nevertheless, it remains far below what is needed, which is probably now at least 250,000/day. Note this target number increases as the number of new infections increases.
Ratio of tests to positives for infection (from COVID Tracking Project)
- Number: 155,063 new tests vs. 29,023 new diagnosed infections
- ***Ratio: 5.3:1
In South Korea, where aggressive testing has led to a near-total disappearance of new cases, the inflection point where the number of new daily cases plateaued was reached when the ratio of tests to new cases found reached 15:1. Any ratio less than that suggests that not enough testing is being done. Yesterday’s ratio of 5.3:1 is still far behind.
US States and population in total lockdown, business lockdown, and partial restrictions
- ***Total lockdown: (SC joined yesterday - not shown on map below) 43 States, 306.7 million, 92.4%
- ***Business lockdown: 2 States (KY, MA) 14.4 million, 4.3%
- Partial restrictions on business (bars, restaurants): 5 States (IA, ND, NE, UT*, WY^) 9.7 million, 2.9%
- School closure only: 2 States (AR^, SD*) 3.9 million, 1.2%
- No mandatory restrictions: NONE
*some local areas under lockdowns
^restrictions on or quarantine of travelers from out of State
US States with “test, trace, and quarantine” programs
- Under development: 1 State: MA
Summary for April 7
Almost every public health authority who has weighed in has advocated the “Sledgehammer, then Scalpel” approach of a temporary total lockdown, during which time, as the infection rate of growth hopefully moves to flat, the production and distribution of necessary medical equipment is surged. Once enough is in place, a regimen of “test, trace, and quarantine” can be put in place as the lockdown is lifted.
Here’s how we stand:
- South Carolina finally went to Statewide lockdown yesterday.
- Almost 95% of the total US population is under total lockdown.
- Mandatory lockdowns, first implemented on Statewide bases 18 days ago, appear to be paying off, as the daily rate of increase in new cases has steadily declining and is now in single digits. The peak in new daily infections might only be about 10 days away.
- The number of daily tests has continued to improve, but is still far short of of what is necessary.
- The Trump Administration has still not mandated a nationwide lockdown.
- The Trump Administration has taken no meaningful steps to mandate mass production of necessary medical equipment.
- The Trump Administration has taken no steps towards a nationwide “test, trace, and quarantine” plan that will be needed to lift lockdowns, or to assist States to do so.
- Massachusetts has begun to develop its own “test, trace, and quarantine” plan. Hopefully this will be adopted by other States quickly.
- California’s governor has announced a plan for the States to coordinate in making purchases of the necessary equipment.
- Until States or the federal government implement a regimen of “test, trace, and quarantine,” lockdowns cannot be lifted.
The “second order chaotic system” of human behavior at work: previous horrific projections have changed behavior enough that the peak in infections might only be 10 days away
- by New Deal democrat
Forecasting of human behavior is a “second order chaotic system.” If humans know you are observing them, they observe right back. The conclusions of your study go into a feedback loop causing the humans to change their behavior to what they hope to be a more desirable result for them.
Put another way, it helps to think of humans as incredibly crafty chimpanzees. Put an obstacle in their way, and they will find a way around it.
So it is with the modeling of coronavirus outcomes. Based on the uncontrolled growth of the virus to date, in mid-March the Imperial College in London put out the following graph of the expected trajectory and deaths in both the UK and the US:
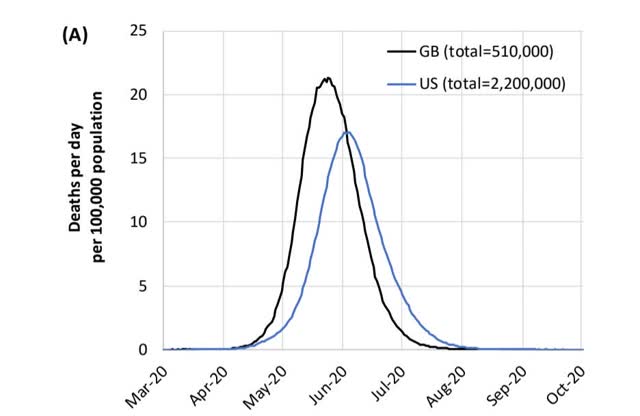
This death rate accompanied over 20 million infections at the peak alone in early summer:
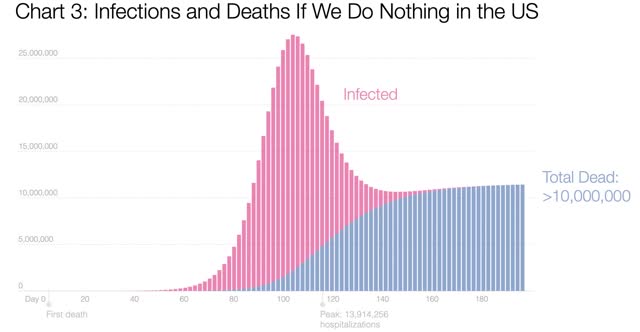
These graphs were so scary that both countries changed their approaches. In the case of the US, most importantly States started to enact emergency “stay at home” measures. Now that those measures have been in place long enough, they have had a pronounced effect on the expected growth in infections.
Back on March 23, when Trump was indicating that he would decide about removing “social distancing” restrictions 15 days later - on April 5 - I wrote up a projection of the then-current rate of 34.6% day/day exponential growth in coronavirus infections.
The daily projections I came up with are reproduced below, together with the actual number of new cases and more importantly, the daily rate of growth on the right:
Mar 22: 36,001 35,224 +32%
Mar 23: 48,458. 46,450 +32%
Mar 24: 65,224. 55,225 +19%
Mar 25: 87,792. 69,197 +25%
Mar 26: 118,168. 86,012 +24%
Mar 27: 159,054. 104,837 +22%
Mar 28: 232,219. 124,686 +19%
Mar 29: 312,567. 143,055 +15%
Mar 30: 420,715. 164,610 +15%
Mar 31: 566,283. 189,633 +15%
Apr 1: 762,217. 216,722 +14%
Apr 2: 1,025,944. 245,722 +13%
Apr 3: 1,380,920. 278,601 +13%
Apr 4: 1,858,719. 312,245 +12%
Apr 5: 2,501,836. 337,933 +8%
Beginning March 23 for the next week, the rate of daily growth on average declined by -2%. Since about March 30 it has declined by -1%. At the current rate of deceleration, about 11 days later (i.e., April 16) there will be no net growth in cases, with a total of about 525,000 cases at that time.
Had the previous rate of growth continued, by April 5 there would have been about 50,000 deaths “baked in the cake.” Instead we crossed the line to over 10,000 yesterday, with a daily rate of growth that has slowed over the past two weeks from over 30% past 24% and about 20% in the past few days. If this rate of decrease likewise were to continue, in two weeks there might only have been about 25,000 deaths from the virus.
As a result, the latest model from the University of Washington shows a peak in hospital use on April 15:
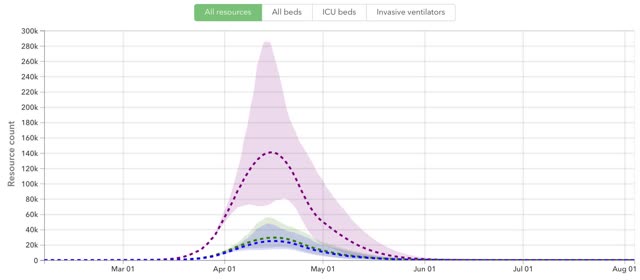
It also shows total deaths through summer between 50,000 and 140,000, with a median likelihood of 80,000:
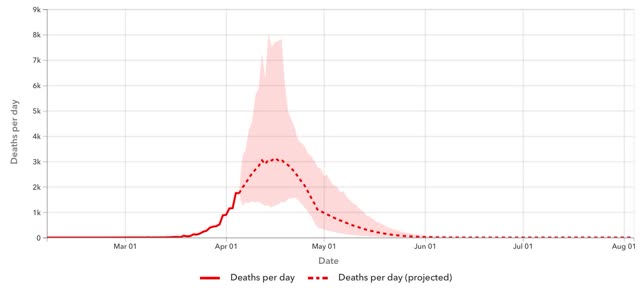
This is a second order chaotic system at work. In that regard, it is important to note that this projection depends on lockdowns continuing as long as necessary. But if the optimistic scenario holds, expect humans to want to jump the gun and declare victory, and decrease social distancing.
We really need to see a mass increase in the supplies and tech necessary to implement a nationwide “test, trace, and quarantine” regimen that will allow lockdowns to be at least partially relaxed.
Monday, April 6, 2020
Revisiting a prediction of exponential growth
- by New Deal democrat
A few weeks ago, I mentioned that:
“Looking back over my private correspondence, I see where I first voiced the likely impact back on February 27. Here’s what I wrote then:
——-
“The CDC only has 250 working test kits. They have *none* to spare to check for community spread. Thus the virus will spread for several weeks undetected until tests are administered among the first very sick. By then it will be too late.
....
“In short, malpractice by the Buffoon in chief could easily lead to tens of thousands of unnecessary deaths.”
——
——
Today, April 6, 2020, the US has surpassed 10,000 coronavirus deaths.
By way of contrast, South Korea, which recorded its first coronavirus case on the same day as the US, has only 186 deaths.
Trump has the blood of 10,000 unnecessary US deaths on his hands. And we’re still nowhere near the midpoint of this virus.
Lockdowns work II
- by New Deal democrat
Several weeks ago Italy was the poster child for an out-of-control pandemic. It implemented a strict nationwide lockdown. Here are its daily number of new infections:
Next came Spain, which overtook Italy in the total number of infections. It also implemented a nationwide lockdown. Here are its daily number of new infections:
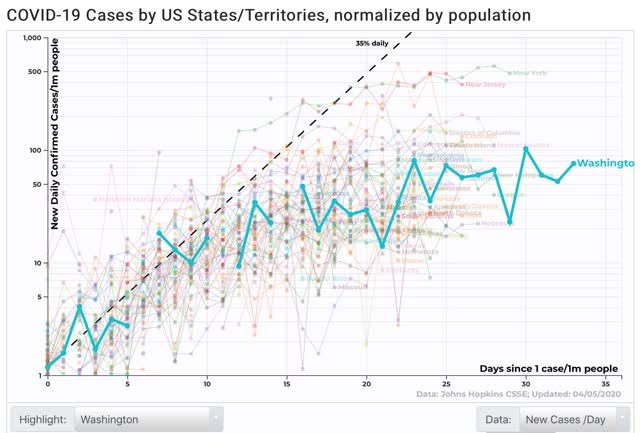
Within the US, Washington State started a local lockdown almost immediately, and was among the first to start a Statewide lockdown. Here are its daily number of new infections, which have plateaued at about 75 per 1 million per capita:
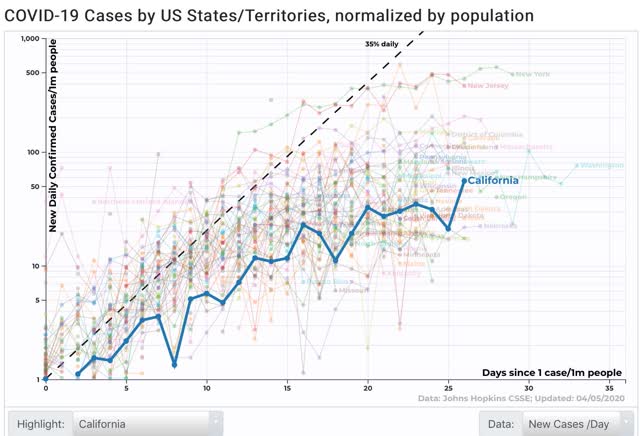
The State of California as a whole was one of the first three States to go to a Statewide lockdown 16 days ago. Here are its daily number of new infections, which plateaued at about 35 per 1 million population (the spike on the last day is probably due to clearance of a huge backlog in. Testing):
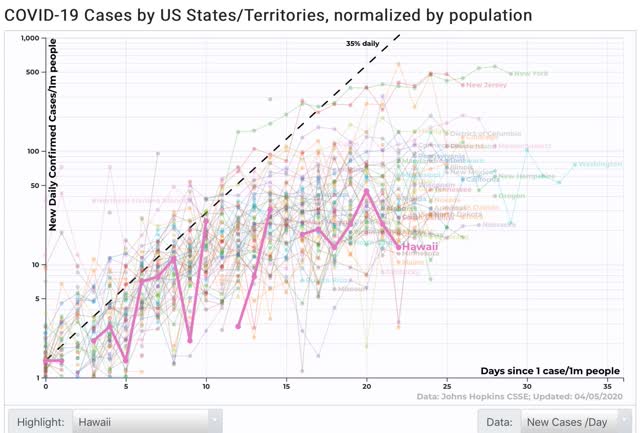
Hawaii, besides lockdowns, being islands, started a ban/quarantine on incoming visitors. Here are its daily number of new infections:
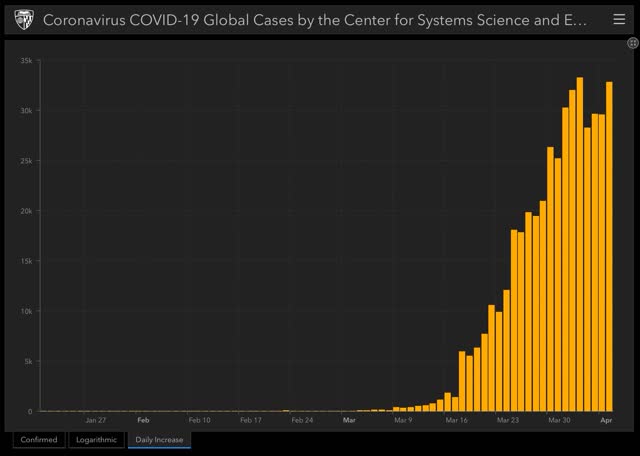
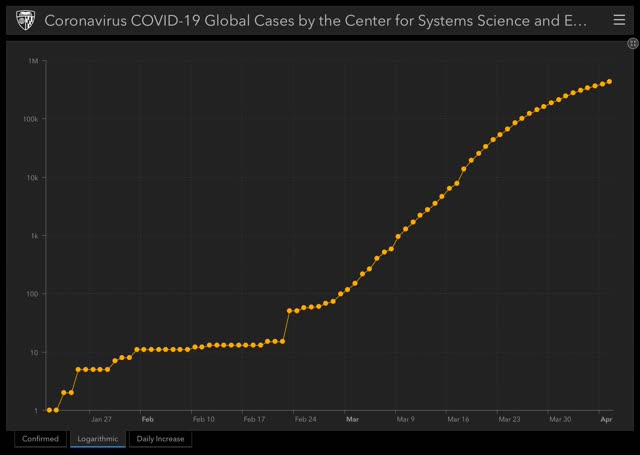
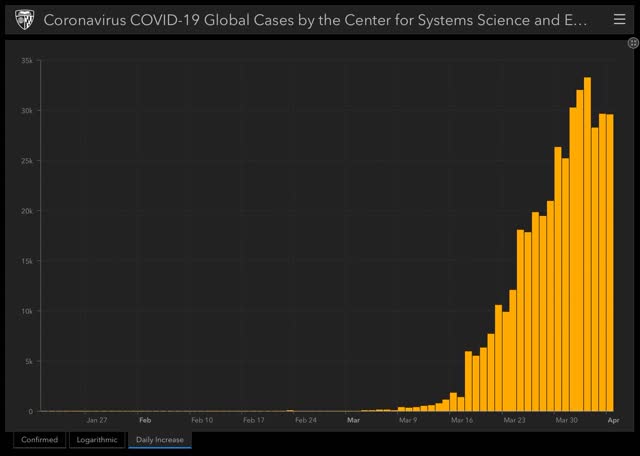
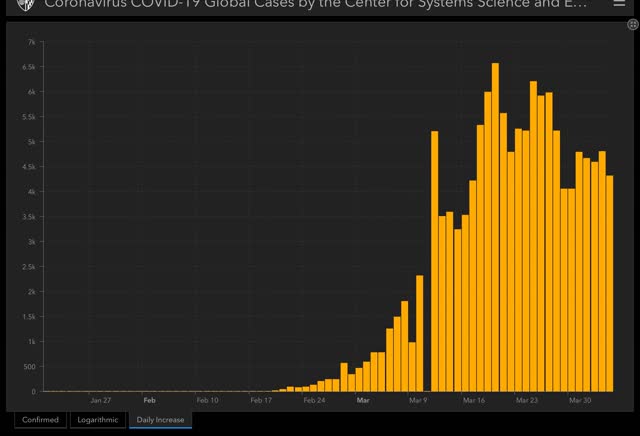
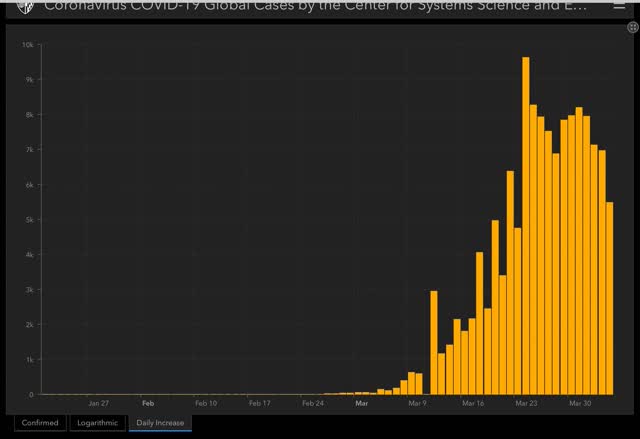
Finally, here is the US as a whole. As more and more State lockdowns take effect, the increase in the number of new cases has been slowing:
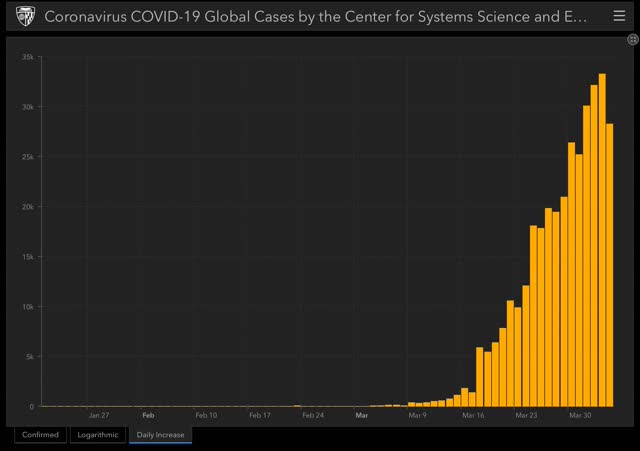
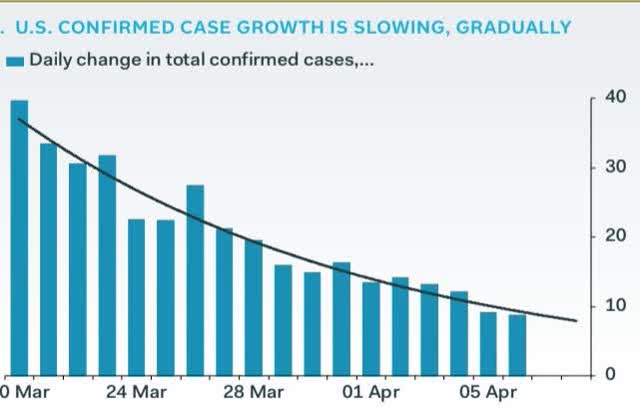
Here is a graph from Kevin Drum showing the daily rate of increase of new infections for the US:
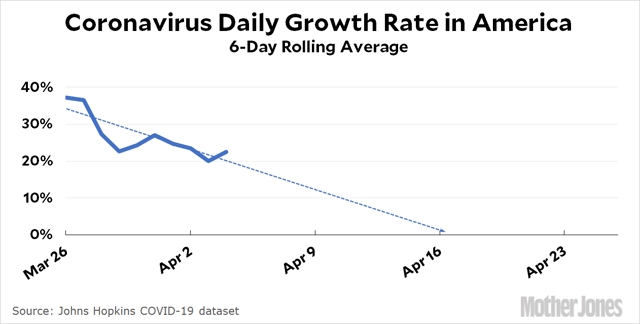
Obviously they aren’t the only answer, because aggressive testing, tracing, and quarantine of those in contact with new cases must be implemented for a successful regimen, but the fact is, lockdowns work. The sooner they are implemented, the sooner the daily number of new infections peak.
Subscribe to:
Posts (Atom)