Saturday, March 14, 2020

Weekly Indicators for March 9 - 13 at Seeking Alpha


 - by New Deal democrat

My Weekly Indicators post is up at Seeking Alpha.

There is no clear evidence yet of a drop-off in consumer spending due to the coronavirus in the series I have been tracking, although there is evidence on the producer side.

After I posted, I ran across this chart of daily reservations made at OpenTable for various metro areas:


There has clearly been a big decline that began about March 2nd.

As usual, clicking through and reading will help bring you up to date, and rewards me a little bit for my efforts.

Friday, March 13, 2020

Three related metrics of coronavirus


 - by New Deal democrat

Here are three different but ultimately related updates about the coronavirus pandemic.

1. It is 100x more lethal than the 2009 H1N1 swine flu

The latest right-wing disinformation is that Obama waited 6 months to declare the 2009 swine flu an emergency, and 1000 people died. As others have pointed out, his Secretary of Health and Human Services did so only 11 days into the US outbreak.

So why don’t we remember a big health emergency in 2009? Because the swine flu was 100x less lethal than coronavirus. According to the CDC’s final estimates:
from April 12, 2009 to April 10, 2010 approximately 60.8 million cases (range: 43.3-89.3 million), 274,304 hospitalizations (195,086-402,719), and 12,469 deaths (8868-18,306) occurred in the United States [were] due to pH1N1.
That is a mortality rate of 0.02%, or 2 in 10,000. The total number of deaths, spread out over a year, were 10% of average seasonal influenza deaths.

By contrast, coronavirus appears to have a 2% (some estimates are coming in more like 3%) mortality rate. If 60.8 million Americans were to contract coronavirus, that would mean about 1,200,000 deaths.

2. Exponential projections of the spread of the virus are holding up so far.

Two days ago, Jim Bianco of Bianco Research posted the following linear projection of coronavirus infections for the next 10 days if they continued to increase at an exponential rate:


For the first two days of that projection, his numbers have not only been close to accurate, they have actually been slightly low:

March 11 projection: 1246  actual: 1300+
March 12 projection: 1676  actual: 1700+

At the current rate, we will have more than 10,000 cases only 4 days from now.

3. The stock market’s big declines can be seen as reactions to rational projections of exponentially increasing impacts with each passing day.

Take Bianco’s graph above, and project 7 days in advance, as in each passing day the federal government fails to do what is necessary to get in front of the pandemic. Each such day means not just an increased impact, but an increasing *rate* of those economic impacts.

Since the date of Donald Trump’s inauguration, as of this morning the market is only up 9.2%:


This does not mean that the market will continue to fall in a straight line, or ad infinitum
.
But if I had to guess, it would be that the ultimate bottom will take place once the market senses that adequate steps have been taken to contain the outbreak, even if that means the entire economy shuts down for 2 or 3 weeks.  

Thursday, March 12, 2020

Coronavirus:Donald Trump::The Terminator:Sarah Conner


 - by New Deal democrat

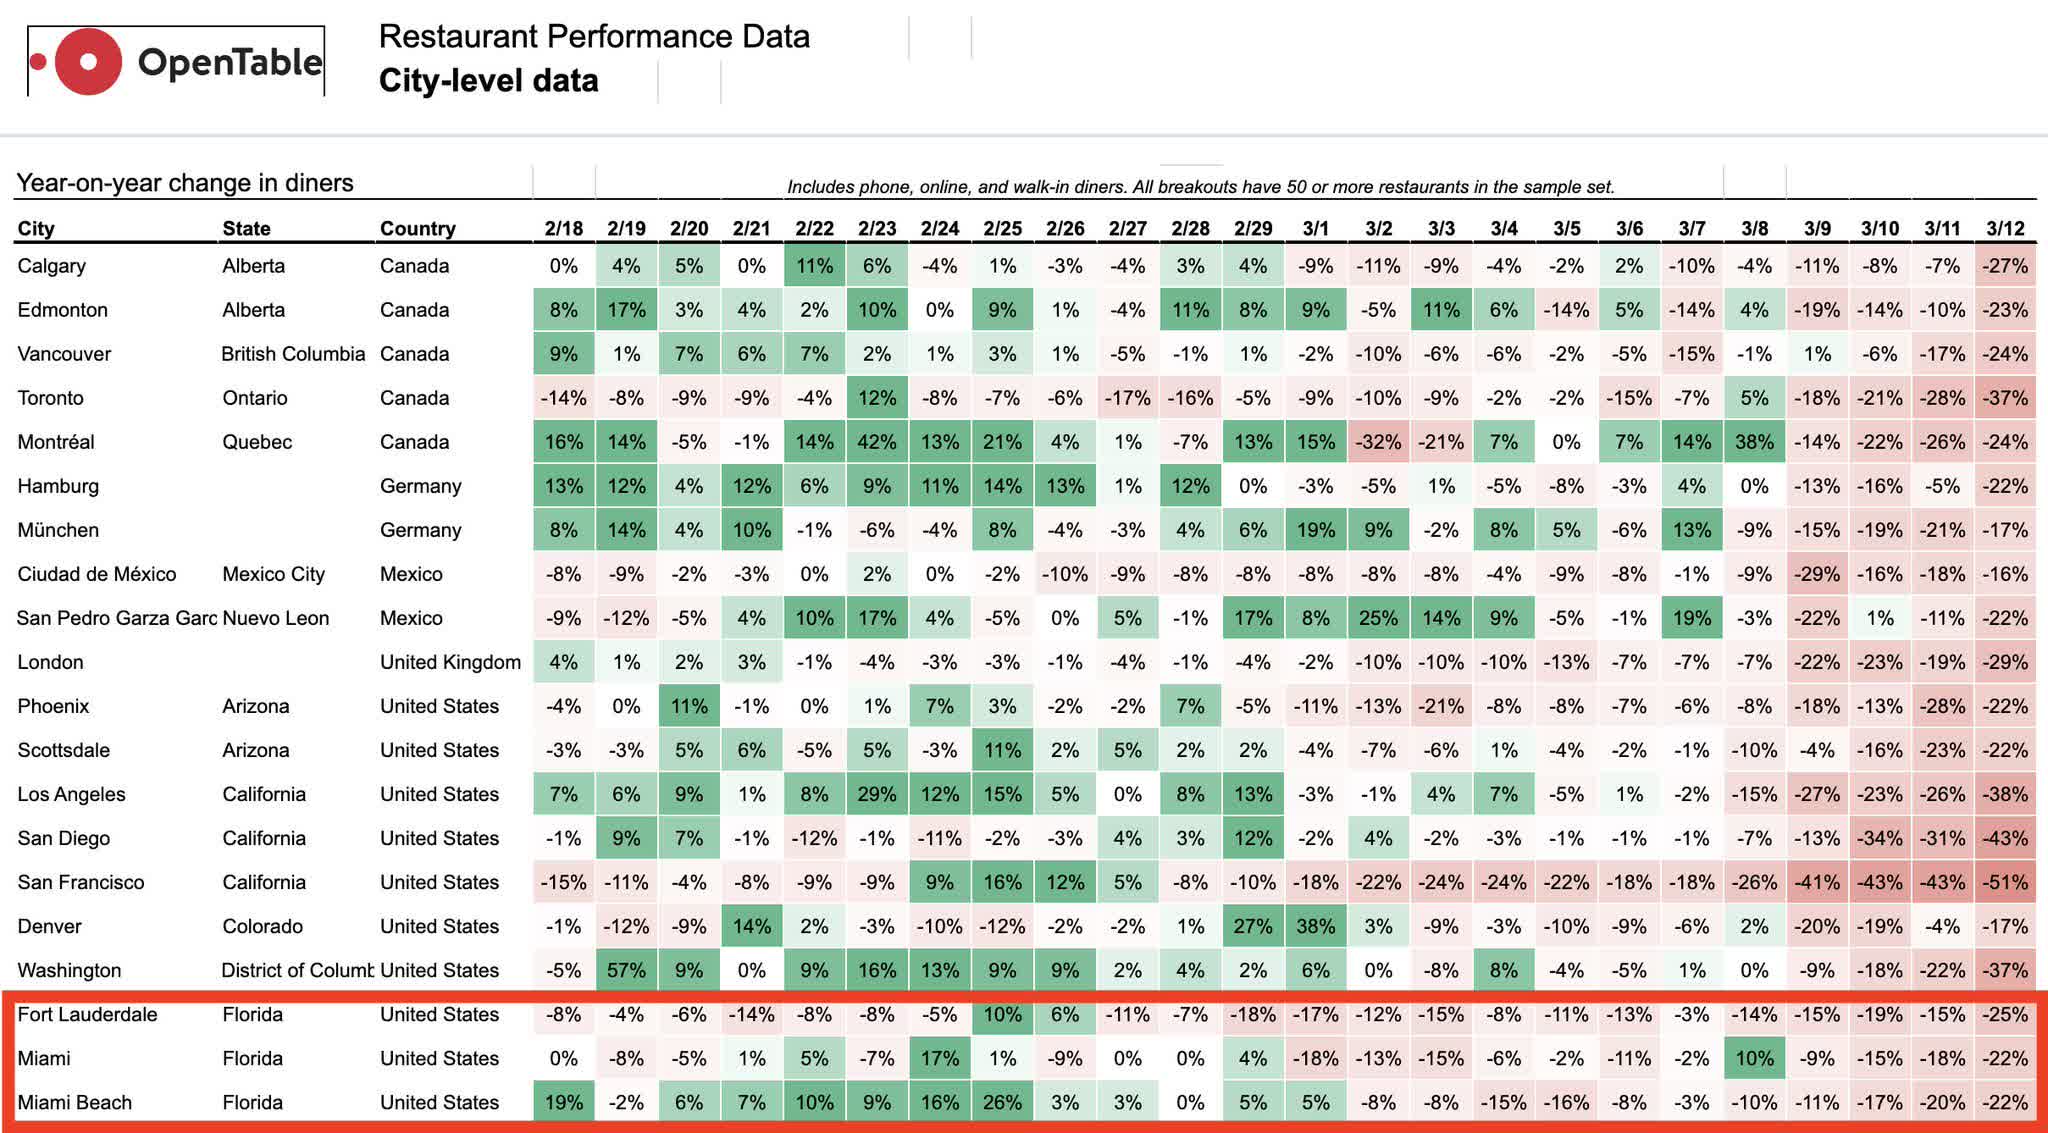
For the past few weeks I have said that, when it came to coronavirus, the news would outrun the data. The last 24 hours seem to have been a watershed moment for that news. 

Both an NBA player and a major Hollywood star have tested positive for the virus. The entire NBA season has been shut down. Many universities are suspending classes and sending their students home. Large public activities, like St. Patrick’s Day parades in major cities, have been canceled. 

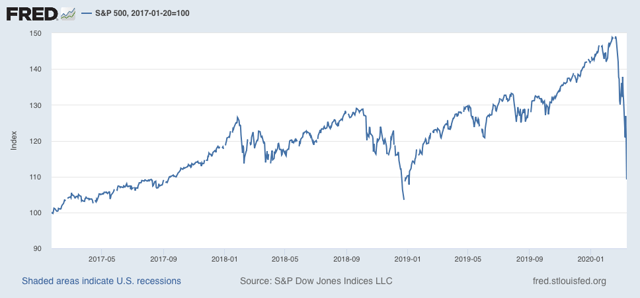
Meanwhile, as I write this, stocks on Wall Street look set to open over 5% down, after having fallen over 20% in just the past 3 weeks - the fastest descent from all-time highs to a bear market in history (yes, even faster than in 1929).

This is what exponential growth looks like. Everything seems normal until all of a sudden, it isn’t.

The renewed crash in stocks this morning is a thunderous lack of confidence in Donald Trump. Wall Street may not be “the economy,” but in the aggregate traders are pretty shrewd. What happened last night is that Trump gave an ill-thought-out, slapdash major speech in which he said among other things, that he was effectively halting all commerce with Europe. That would be nearly catastrophic for the economy. The fact that his surrogates have since “corrected” his error does not help at all - it simply reinforces that he is completely winging it.

In terms of Trump winging it, the allegory that comes to mind is

Coronavirus:Trump::The Terminator: Sarah Conner

Trump is trying to BS his way through a pandemic, like (to mix metaphors) the guy from Die Hard tries to schmooze Hans Gruber, while, to go back and quote from the Terminator: “It can't be bargained with. It can't be reasoned with. It doesn't feel pity, or remorse, or fear! And it absolutely will not stop, ever....”

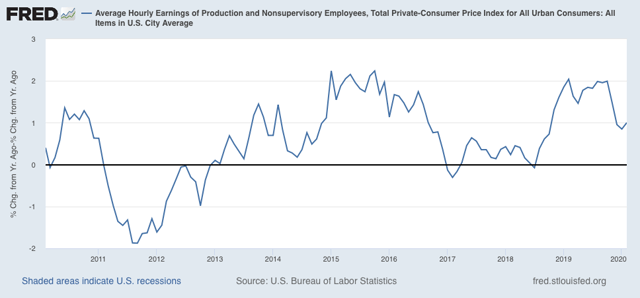
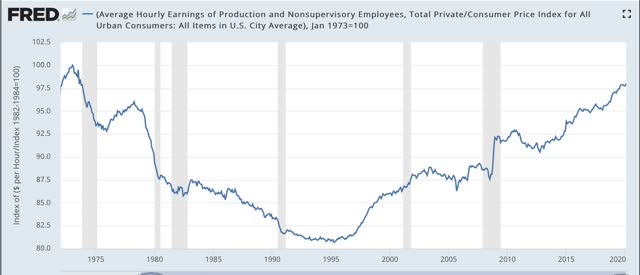
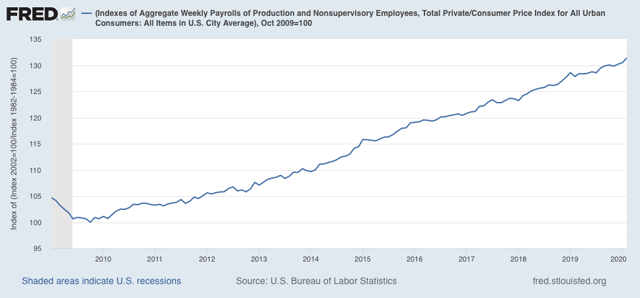
Meanwhile, even the high-frequency economic data is one week old, which may as well be an eternity. Initial jobless claims, at 211,000, are nearer the *low* end of their two year range. Rail cars ex-intermodal units and coal actually *increased* over a year ago. Only intermodal rail units continued their accelerated decline, down -14.1% YoY.

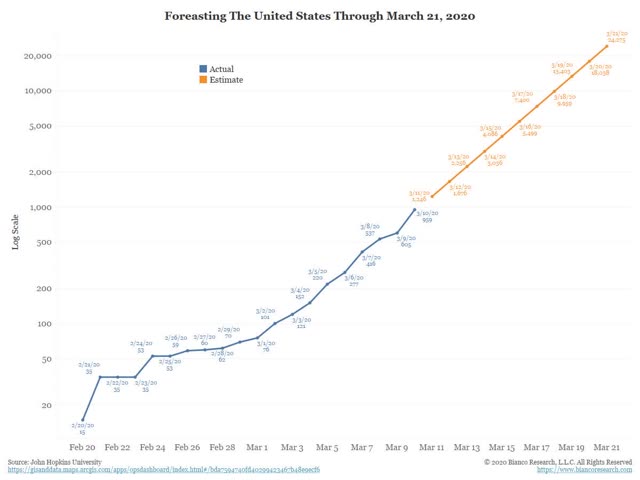
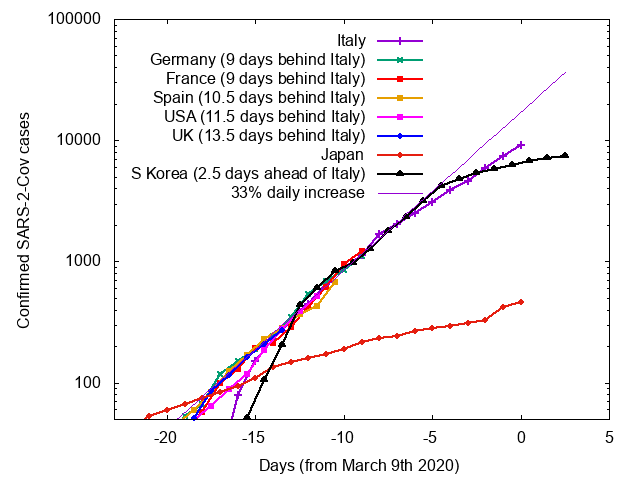
Finally, a bunch of graphs demonstrating the exponential growth rate of coronavirus in the US have come out in the past several days. 

First, here’s Jim Bianco of Bianco research:


If the present growth rate continues, he expects to see 25,000 cases by March 21.

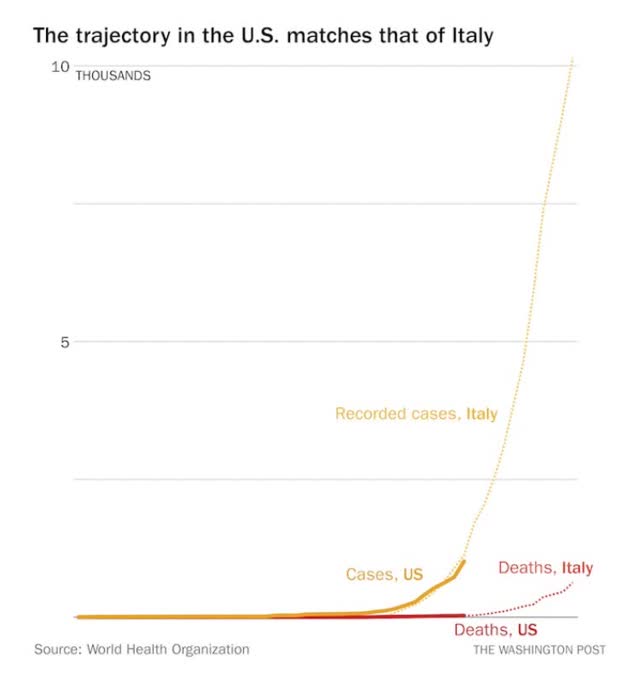
And this is from the WHO:


By way of hope, I can only offer two things: (1) since the federal government under Trump is going to be useless or worse, some States may seize the initiative and run competent containment programs; and (2) the most important things you can do are completely within your own power - wash your hands, don’t touch your face, avoid public gatherings, practice social distancing.

But in the aggregate, expect exponential growth - meaning sudden worsening by orders of intensity - to continue.

Wednesday, March 11, 2020

Real average and aggregate earnings for February 2020


 - by New Deal democrat

Let me take a little break from discussing how one of the four horsemen of the Apocalypse is riding into town, to the quaint business of how middle and working class wages are doing through February.

Consumer inflation for February only rose 0.1%. Since wages rose 0.3% nominally in February, that means real average wages for non-supervisory workers rose 0.2%. YoY the gains rose to 1.0%:


Real average hourly earnings have risen to 98.1% of their January 1973 peak:


Because total hours worked rose significantly in February, real aggregate earnings - i.e., the total buying power of the middle and working class - also rose to 31.4% above its October 2009 low:


Below is a chart I haven’t shown in a long time, comparing real aggregate earnings in past expansions over the past 50+ years. At 31.4%, this expansion now only trails the 1990s for the total improvement in average workers’ real incomes:


On a monthly basis, however, dividing that 31.4% by the 124 months since the bottom gives us a little over .25% real average earnings growth per month. That’s ahead of the 2000s and just slightly below the 1980s, but well behind all other periods, and shows the weakness in labor’s bargaining power.

Because CPI is normally all about gas prices, and they have cratered in the past week, it’s a fair bet that March will show actual DEflation, and the YoY measures will decline substantially. This would be good for consumers, except that normally consumers don’t want to take the risk of dying by going out in public to consume. Which means I expect layoffs to be in full swing by April.

Tuesday, March 10, 2020

This is what exponential growth looks like


 - by New Deal democrat

I’ve placed an added emphasis on high frequency indicators, as they will be the first to show the impact of coronavirus on the economy.

This morning chain store sales for last week were reported. They were:

 - Redbook +6.0% YoY
 - Retail Economist unchanged w/w, +0.9% YoY

Needless to say, there was no impact at all on the Redbook number. While the Retail Economist number was definitely weak, there have been other, similar weak weeks earlier this year, so that number is equivocal. I suspect that this situation will change in no more than two weeks.

Meanwhile, here is a graph of the number of coronavirus cases in a number of countries including the US, compared with Italy, the epicenter of the outbreak in Europe (via Mark Handley, a Professor of Networked Systems in the UK):

Notice that the graph is in log scale, where exponential growth is shown as a straight line. South Korea and Japan, both of which have taken very aggressive testing and quarantine measures, show a slow spread, and in South Korea the number of *new* cases has actually declined in the past few days, leading to the total number shown above to level out. The US, by contrast, is on track to have the same number of cases Italy has now in about a week and a half.
This is what exponential growth looks like. The spread of the disease looks manageable, until all of a sudden it very much is not. This is why, even if the disease abates with warmer weather, exactly *how* warm the weather has to be makes an important idfference between a contained and a calamitous  outbreak. 


Monday, March 9, 2020

Whatever will I write about on a no-data Monday? I won- WTF?????


 - by New Deal democrat

Yesterday I was wondering what I might write about today, as there is absolutely *no* data being released. And then I woke up and turned on the intertoobs . . . .

OK. Deep breaths. For those of you who wonder what the h#/! Is going on, here’s my take.

1. Until resolute government action is taken, the coronavirus situation is going to continue to worsen. As of yesterday, we passed 500 known cases. There were probably about 5000 other people walking around the US last week infecting others. As I wrote yesterday, as a working model I expect all metrics to double roughly each week - or, add a digit before the decimal point about once every 25 days. 

China and now South Korea have shown that intensive testing, treatment, and mandatory social distancing can beat back the virus. We have Trump. Based on that, if you were trying to measure what might happen to business sales and profits over the next 3 months, how would you act as every day passes without the necessary action?

2. Putin - ever cold-bloodedly shrewd - has chosen this moment when he senses his adversaries have enhanced vulnerability to make a power play in the oil market. His targets are (1) the Saudis, who he wants to see invest $$$ in Russia, and bend to Russia’s Middle East ambitions, and (2) the US fracking industry, that he would like to weaken and maybe have his oligarchs take a big stake in.

As in 2016, this will benefit US consumers in the aggregate even as it delivers pain to the Oil Patch. If it continues, paradoxically it will help defeat Trump, for the same reason that the weak economy helped him in 2016.

Because the oil move is a contest between two actors - Putin and Muhammad bin Salman - its outcome, and the timing of that outcome, depends on how they behave. They could make peace tomorrow. Or next week. Or next month. Or next year. Or not at all.

3. Even in the worst case scenarios, both of the two issues above are temporary moves. How temporary, and how bad it gets in the meantime, it is impossible to say.  As I’ve been writing for the past few weeks, I expect the news to outrun the data. Every rational scenario strongly indicates we are probably heading into a recession right now. But the data does not show that yet.

That being said, the move in stocks and bonds is obviously very emotional, and could reverse at any time. Emotional moves like this tend to be close to a bottom. It is driven by short term traders rather than long term investors. People whose investment horizons are longer than a couple of years should not panic.

Sunday, March 8, 2020

The BSing of the Red Death: and a K.I.S.S. model for the coronavirus pandemic


 - by New Deal democrat

A Reuters/Ipsos poll this past week found that only 2 in 10 Republicans, vs. 4 in 10 Democrats, say the coronavirus poses an imminent threat to the United States. In keeping with that lack of concern, fewer republicans are taking any steps to prepare, such as washing their hands more frequently.

Anecdotally, from several GOPers in my neighborhood as well as from the proverbial table of old white men at the coffeeshop in the morning, I have overheard conversations all but trumpeting that “coronavirus is a hoax.” I think it was Chris Hayes who has said that Trump is trying to “BS his way through a pandemic.”

This derisive lack of concern reminded me Edgar Allen Poe’s story “The Masque of the Red Death.” In case you’ve forgotten your high school reading, in the story, during a plague known as the Red Death, a masquerade ball is thrown by Prince Prospero for numerous wealthy nobles, as they all hide in an abbey.  Despite this, during the revelry, a mysterious figure - presumably a personification of the Red Death itself - enters and all of the revelers die.

So, how many people might die as a result of Trump’s treating the coronavirus outbreak as a PR and re-election campaign issue, rather than a public health emergency, and when will it likely happen?  Just to give myself some markers, I did what I normally do: try to game this out.    

So far, it seems that serious coronavirus cases have been increasing 10-fold every three or four weeks. Put another way, doubling about once a week. If there are currently 10,000 such cases worldwide, including 200 in the US right now (the latter being Pence’s most recent number), how quickly does this spread?

Further, let me use 3 possible scenarios: one where warm or hot weather does not drive the virus into hibernation, and two where it does, using April 1 and Memorial Day weekend as bookends. Here are the dates of 10-fold increases:

March 6: 200 serious US cases
March 28: 2,000
April 17: 20,000
May 7: 200,000
May 27: 2,000,000
June 16: 20,000,000
July 6: 200,000,000 

Under the no-hibernation model, if we figure that there are 4 non-serious infections for every serious infection, that would mean that by the 4th of July, virtually everyone in the US will have been infected. I won’t even tally how ghastly a 2% fatality rate would be.

Under the Memorial Day hot hibernation model, about 1 in 30 in the US population will have been infected, two million seriously so, and there will be about 200,000 deaths at a 2% mortality rate. That’s twice the normal seasonal flu fatality count. 

Under the April Fools Day warm hibernation model, there will only be about 3,000 serious US infections of 15,000 total infections, with 300 deaths.

Given the extreme difference in outcomes from the three different hirbernation models, tracking the outbreak in tropical regions and also the global south - where it has been summer - will give us important information.

I am cautiously encouraged by the fact that two developing countries in the tropics close to China - Vietnam and the Philippines, respectively - have only reported 18 and 2 cases, respectively. Neither has recorded any deaths. Neither have any local community clusters. The majority in the Philippines have been travelers from China. On the other side of the globe, Brazil has eight cases, with one case with local transmission. The rest are travelers who returned from China or Europe.

Meanwhile in the global south, where summer is just ending, Australia has 53 cases, most of which were travelers from overseas. South Africa has only two cases, both of which are travelers who returned from Italy. Chile has three cases, all of whom recently returned from Europe. Argentina has eight cases, all of whom also recently returned from Europe.

In fact the only tropical or southern country that has reported over 100 cases is Singapore, according to the latest Johns Hopkins interactive chart.

I don’t mean to give false hope, and assume that hotter weather will help. But it’s a possibility worth exploring. All of these could simply represent the immediate onset of a pandemic and/or underreporting. Within two to three weeks, we ought to have enough information to make a better guess which of the three hibernation models is closer to the truth.

And keep in mind, even in the most benign warm hibernation model, coronavirus returns next winter. This is what happened with the Spanish Flu a century ago. It took three years for the disease to infect virtually every person on the globe, ultimately killing 2% of the entire world population.