Saturday, February 16, 2019
Weekly Indicators for February 11 - 15 at Seeking Alpha
- by New Deal democrat
My Weekly Indicators post is up at Seeking Alpha.
There was some widespread deterioration among both the short leading and coincident weekly data, as well as the monthly data.
This is similar to what happened during the 2011 “debt ceiling debacle,” which makes me think that the government shutdown had a more pronounced (but hopefully transient) impact on the economy.
Friday, February 15, 2019
Industrial production face-plants, but hold the DOOOM for now
- by New Deal democrat
For the second day in a row, a major piece of economic data face-planted. Industrial production for the month of January declined -0.6%. Worse, almost all of the decline was in manufacturing.
This kind of decline is most consistent with the onset of a recession, or at very least a significant slowdown, as shown in these two long-term graphs covering the last 50+ years, which have been normed so that only a monthly decline in excess of -0.5% shows as negative:
1961-82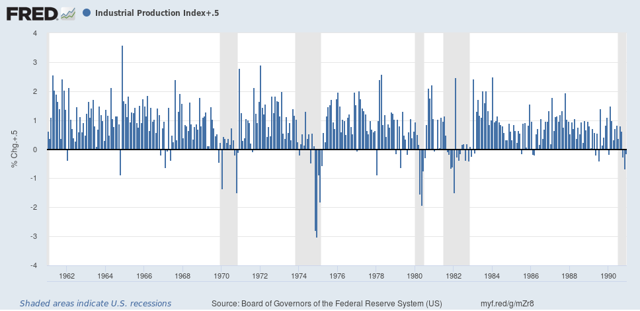
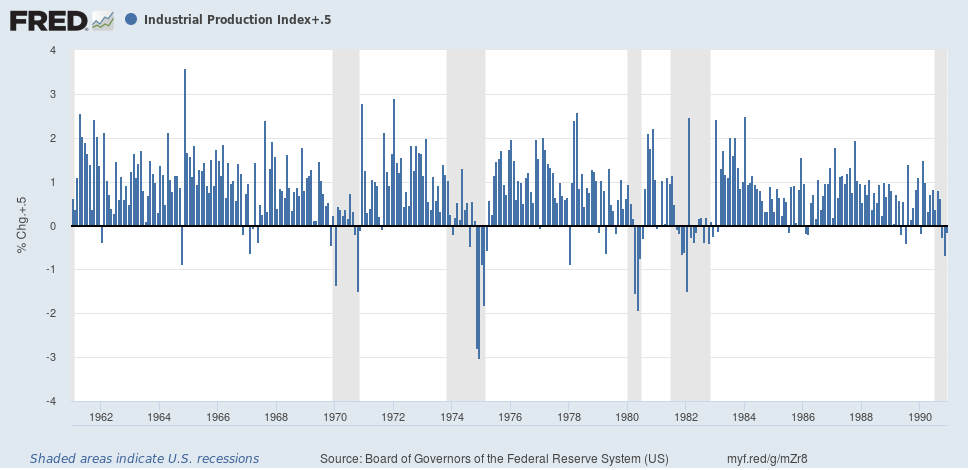
1982- present
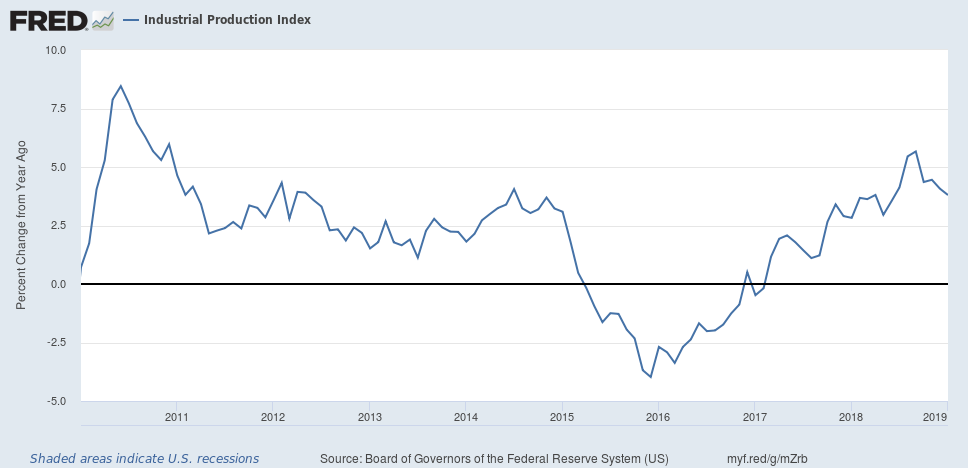
Zooming in on this expansion, the YoY% change in industrial production, at 3.8%, while certainly backing off from its “boom” readings of half a year ago, is still in the high range of average:
While the combination of yesterday’s retail sales number for December and today’s January industrial production number are pretty awful, I recommend treating each with caution, for two reasons.
First, the government shutdown - which started in late December - may have had a bigger effect on production and consumption than earlier believed. If so, I would expect the situation to reverse in the next month or two.
Second, at least in the case of January, the worst cold snap in the last 30 years hitting the industrial heartland almost certainly had some effect on production. The typical rejoinder to this is that winter comes every year. But winter weather is particularly variable from year to year, and waxes and wanes over its three month length at differing times from year to year as well.
So: definitely not good. Definitely consistent with a slowdown at least. But we need to see all of the data caught up through February before we can really judge if it is temporary or not.
Thursday, February 14, 2019
More signs of a slowdown: initial claims and real retail sales
- by New Deal democrat
This morning we got two negative data points. One is cause for concern; the other - not quite yet.
Let me start with the “not yet” first. Initial jobless claims rose 4,000 to 239,000. That means that the 4 week moving average rose to 231,750:
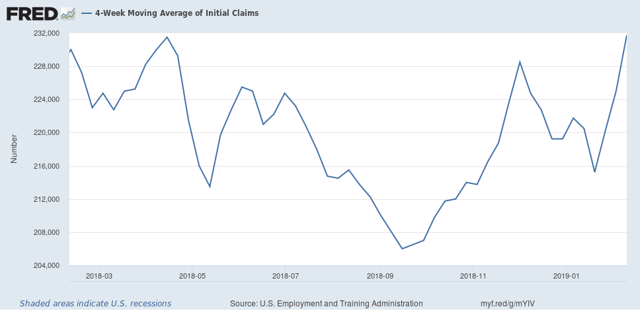
This means that the number is both higher YoY, and 12.5% above its 206,000 low in September.
Ordinarily that would be cause for concern. BUT, the biggest factor in the increase is the week of 253,000 claims two weeks ago, which was almost certainly due to the government shutdown. That week, in turn, was immediately preceded by the week of 200,000 claims, which was the lowest in nearly 50 years.
The bottom line is, although the trend is clearly higher since September, I would prefer to wait two more weeks for both of those outliers to pass out of the 4 week moving average before hoisting a yellow flag on jobless claims.
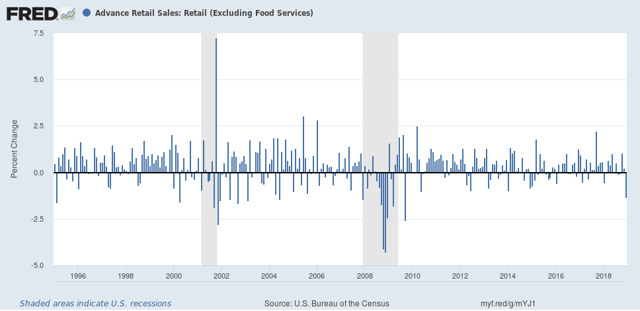
Now let me turn to the number that *is* a cause for concern now: real retail sales, which cratered by -1.2% in December. That is the worst monthly reading since just after the Great Recession, and consistent with readings in the year before both of the last two recessions, so unless this reading is revised away, it is a definite sign of a slowdown. On the other hand, in the longer view monthly readings of -1% or more aren’t that uncommon during expansions:
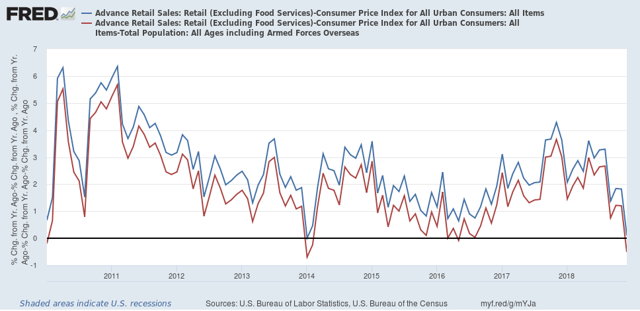
What this does do is bring YoY real retail sales down to a meager +0.1%(!), the second lowest of the entire expansion. Real retail sales per capita (red in the graph below) actually turned negative YoY:
Let me start with the “not yet” first. Initial jobless claims rose 4,000 to 239,000. That means that the 4 week moving average rose to 231,750:
This means that the number is both higher YoY, and 12.5% above its 206,000 low in September.
Ordinarily that would be cause for concern. BUT, the biggest factor in the increase is the week of 253,000 claims two weeks ago, which was almost certainly due to the government shutdown. That week, in turn, was immediately preceded by the week of 200,000 claims, which was the lowest in nearly 50 years.
The bottom line is, although the trend is clearly higher since September, I would prefer to wait two more weeks for both of those outliers to pass out of the 4 week moving average before hoisting a yellow flag on jobless claims.
Now let me turn to the number that *is* a cause for concern now: real retail sales, which cratered by -1.2% in December. That is the worst monthly reading since just after the Great Recession, and consistent with readings in the year before both of the last two recessions, so unless this reading is revised away, it is a definite sign of a slowdown. On the other hand, in the longer view monthly readings of -1% or more aren’t that uncommon during expansions:
What this does do is bring YoY real retail sales down to a meager +0.1%(!), the second lowest of the entire expansion. Real retail sales per capita (red in the graph below) actually turned negative YoY:
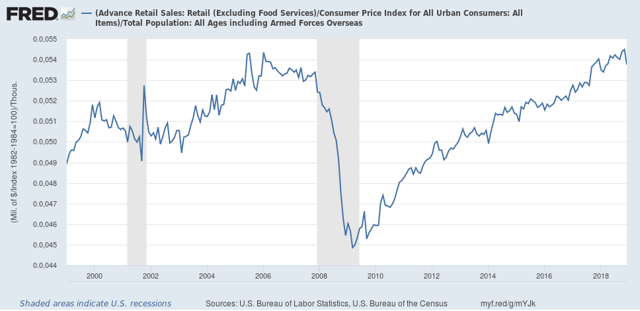
In absolute terms, real retail sales per capita still made an expansion high only one month ago, so I am not ready yet to move this signal from positive to neutral yet:
Finally, real retail sales are a good if noisy leading indicator for YoY employment, shown in red in the graph below (note: real retail sales averaged quarterly to cut down on noise):
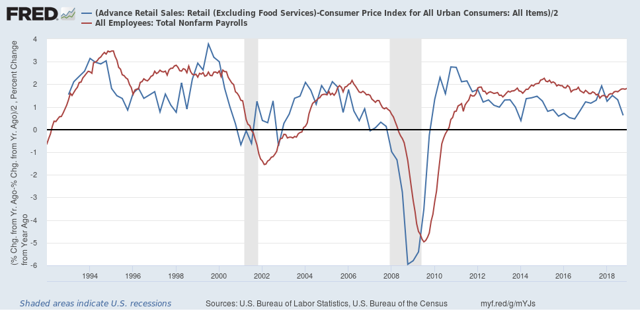
If the poor December number isn’t revised away, or reversed by a big gain in the next months’ report, this portends a significant deceleration in jobs growth in the monthly employment reports over about the next 6 months.
Wednesday, February 13, 2019
The 2017 GOP tax scam may hurt the economy this spring
- by New Deal democrat
It turns out that part of the GOP tax scam of 2017 might hurt the economy this year. That’s because the total decline in the amount of tax refunds going to tax filers this looks like it is going to be enough to affect consumer spending significantly this spring.
This post is up at Seeking Alpha.
Special bonus: a few RW commenters there really don’t seem to like it!
Tuesday, February 12, 2019
December JOLTS report: mixed but with strong positive revisions
- by New Deal democrat
The JOLTS report on labor is noteworthy and helpful because it breaks down the jobs market into a more granular look at hiring, firing, and voluntary quits. Its drawback is that the data only goes back less than 20 years, so from the point of view of looking at the economic cycle, it has to be taken with a large dose of salt.
With that disclaimer out of the way, Tuesday’s JOLTS report for December was mixed, and for the second month in a row was soft relative to the strength of the overall jobs gain for that month. With the exception of one new high, the other series are off their best levels, and two continued to decline, with the good news being that there were generally positive revisions in the previous month’s data:
- Quits declined for the 4th month in a row, and are about 5% off peak.
- Hires rose and are only 0.3% off their peak set two months ago.
- Total separations declined and are off 4% from August.
- Job openings made a new all time high.
- Layoffs and Discharges declined (a good thing), but remain up about 10% from their recent low last March.
Let's update where the report might tell us we are in the cycle.
First, below is a graph, averaged quarterly through the fourth quarter, of the *rates* of hiring, quits, layoffs, and openings as a percentage of the labor force since the inception of the series (layoffs and discharges are inverted at the 3% level, so that higher readings show fewer layoffs than normal, and lower readings show more):
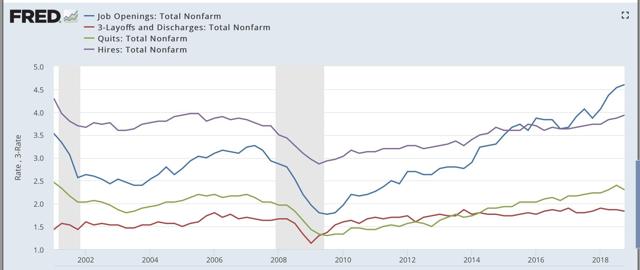
During the 2000s expansion:
- Hires peaked first, from December 2004 through September 2005
- Quits peaked next, in September 2005
- Layoffs and Discharges peaked next, from October 2005 through September 2006
- Openings peaked last, in Spril 2007
By contrast during and after the last recession:
- Layoffs and Discharges troughed first, from January through April 2009
- Hiring troughed next, in March and June 2009
- Openings troughed next, in August 2009
- Quits troughed last, in August 2009 and again in February 2010
Now here's what the four metrics look like on a monthly basis for the last five years:
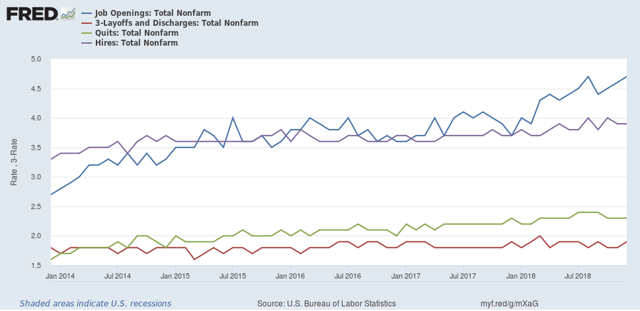
As indicated above, job openings, quits, and hires all surged higher through August of this year. While openings have continued to rise, hires have gone sideways, and quits have deteriorated.
.
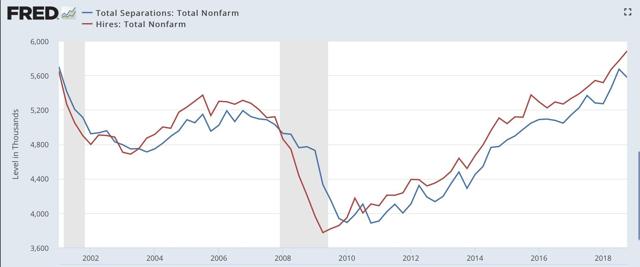
Next, here's an update to the simple metric of "hiring leads firing," (actually, "total separations"). Here's the long term relationship since 2000 through Q4 of 2018:
Here is the monthly update for the past fiv e years:
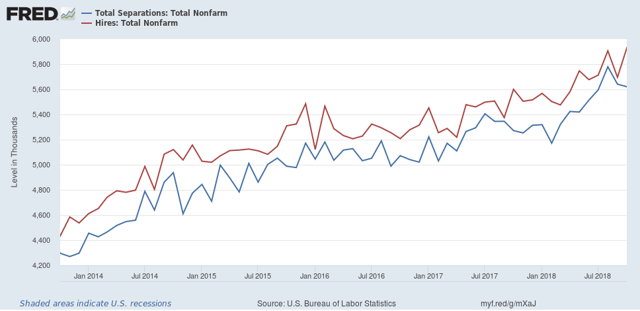
In the 2000s business cycle, hiring and then firing both turned down well in advance of the recession. With the positive revisions, there is no significant downturn shown here.
Finally, let's compare job openings with actual hires and quits. As you probably recall, I am not a fan of job openings as "hard data." They can reflect trolling for resumes, and presumably reflect a desire to hire at the wage the employer prefers. In the below graph, the *rate* of each activity is normed to 100 at its August 2018 value:
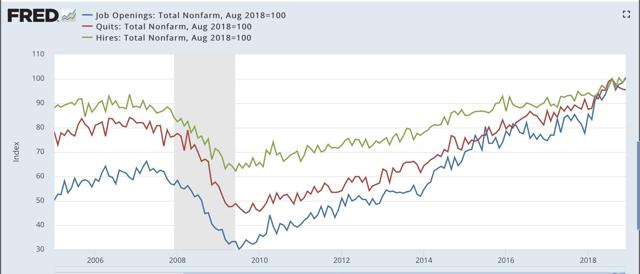
Now, here is a close-up of the last two years:
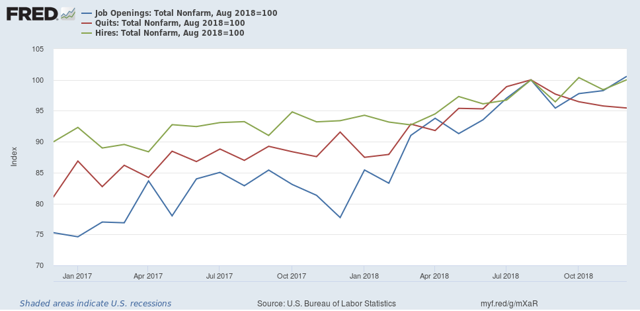
When I first presented this graph, I noted that while the rate of job openings was at an all time high, but the rate of actual hires has only just reached its normal rate during the several best years of the 2000s expansion, and was below its rate at the end of the 1990s expansion. With the positive revisions, that story has completely changed, as all three rates are better than their best rates in the 2000s expansion.
In 2018, both hires and quits accelerated, with hiring decisively above its level from the last expansion. My take has been that employees have reacted to the employer taboo against raising wages by quitting at high rates to seek better jobs elsewhere. Last month I wrote, “If the dam is finally breaking, we should see the hiring rate increase, and quit rate level off.” Although similar, instead hires have leveled off, while quits have declined.
In summary, the December JOLTS report was generally strong. As I expected it to be given the headline jobs number, but had soft spots. My expectation remains that this will start to cool down during the first six months of this year as a slowdown begins to take hold. but this won’t happen as long as the headline numbers remain so strong, as they were agiain in January.
Monday, February 11, 2019
A decelerating Staffing Index suggests that weakening temporary jobs in the monthly employment report is not just noise
- by New Deal democrat
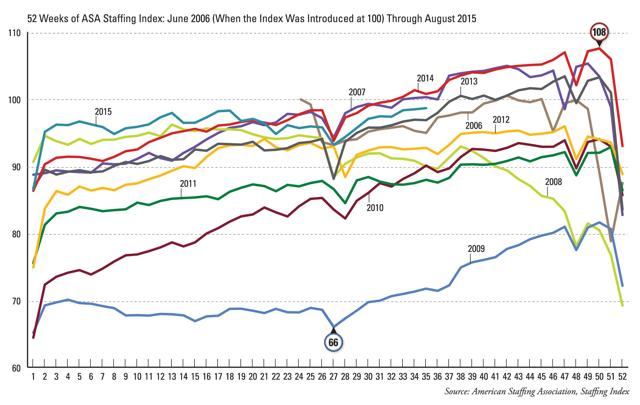
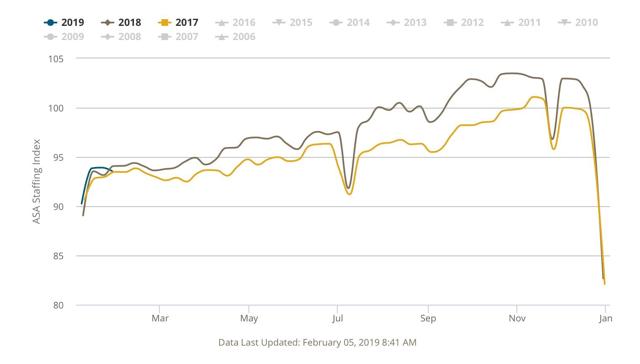
Every week I report the YoY 4 week rolling average of American Staffing Association’s Index. It’s been decelerating recently, and last week was up only +0.5% YoY. On a single week basis, though, it went negative.
Because I have written several posts in the last couple of months emphasizing the leading aspect of temporary jobs in the monthly employment report, I thought I would compare the Staffing Index against it.
Here’s what I found: since the Staffing Index isn’t seasonally adjusted, you really have to compare each on a YoY basis. And while the two don’t turn positive or negative at the same time or for the same duration, they do correlate well on YoY direction; i.e., acceleration or deceleration in the YoY comparison.
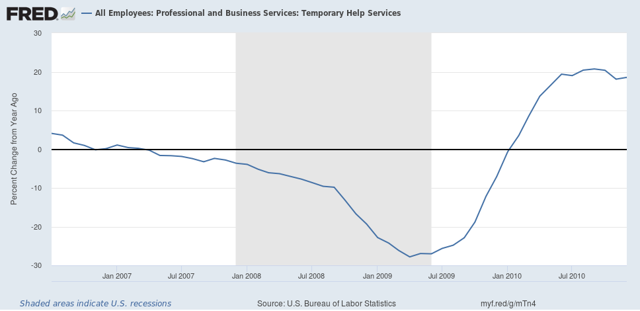
The Staffing Index only began to be published in 2004. Since then, there have only been two periods when staffing turned negative YoY: the Great Recession and the 2015-16 energy patch downturn.
As the first two graphs below show, at the time of the Staffing Index lagged the monthly jobs report by half a year in 2007, and led it by one month at the end of 2009:
Because I have written several posts in the last couple of months emphasizing the leading aspect of temporary jobs in the monthly employment report, I thought I would compare the Staffing Index against it.
Here’s what I found: since the Staffing Index isn’t seasonally adjusted, you really have to compare each on a YoY basis. And while the two don’t turn positive or negative at the same time or for the same duration, they do correlate well on YoY direction; i.e., acceleration or deceleration in the YoY comparison.
The Staffing Index only began to be published in 2004. Since then, there have only been two periods when staffing turned negative YoY: the Great Recession and the 2015-16 energy patch downturn.
As the first two graphs below show, at the time of the Staffing Index lagged the monthly jobs report by half a year in 2007, and led it by one month at the end of 2009:
At the time of the energy patch downturn, the Index turned negative YoY in May 2015:
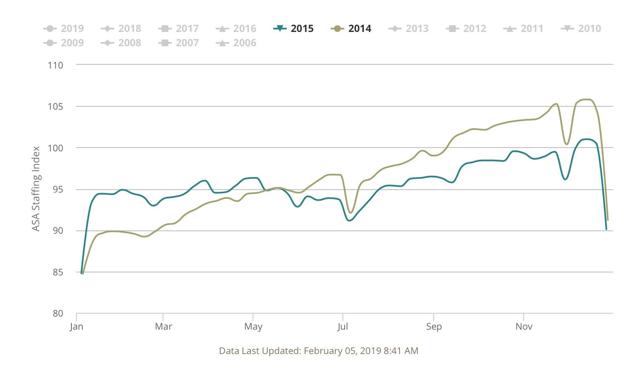
And continued negative until June 2017:
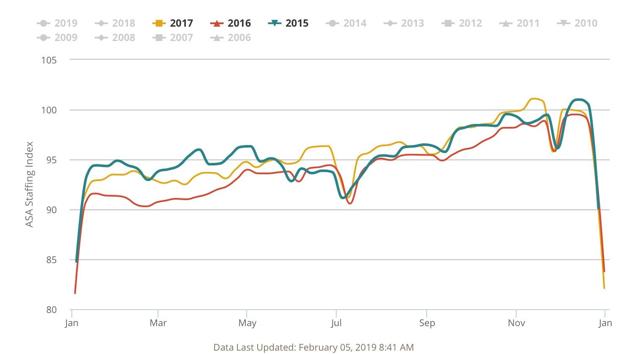
Meanwhile,monthly temp jobs number did not turn negative except most of the last 9 months of 2016 — although it started its rapid deceleration almost exactly when the Index went negative:
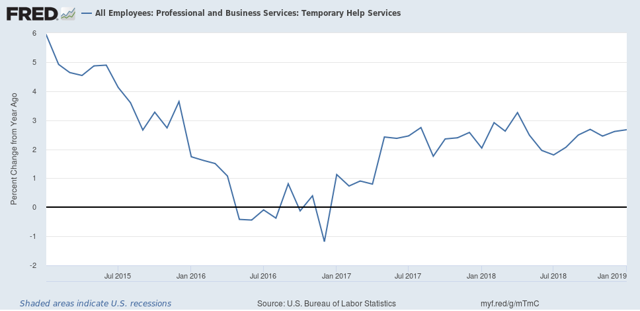
Note that decelation in the YoY number corresponded with the Staffing Index’s turning negative in 2015, and continued to improve until mid-2017.
Most recently, the YoY comparisons started to deteriorate in the Staffing Index in November, and have been barely positive so far this year.
All of which makes me think that the deceleration of temp jobs in the monthly report for the last three months, as shown in the final graph below:
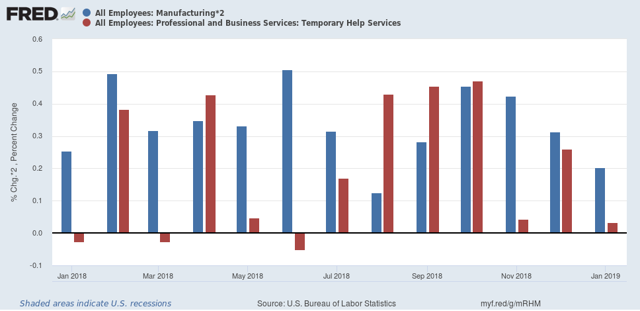
hasn’t just been noise, but - while still positive - is demonstrative of real weakness.
Subscribe to:
Posts (Atom)