Global losses from mortgage and other credit problems will likely top $600 billion, UBS said. That's four times higher than the $150 billion or so that financial companies have marked down since the subprime debacle unfolded.
A separate study presented at a University of Chicago event forecast losses will hit $400 billion.
.....
AIG said Friday that the subprime housing debacle had thrown it into "uncharted waters" that were likely to remain choppy through 2008.
The insurance giant lost a surprise $5.29 billion in the fourth quarter, AIG said late Thursday. It also wrote down $11.1 billion worth of credit swaps.
.....
Huge losses from home loan finance giants Fannie Mae (FNM) and Freddie Mac (FRE) earlier in the week added to concerns, says Stanley.
.....
Rescue plans have been floated for MBIA (MBI) and Ambac Financial (ABK) amid fears they'll be unable to pay claims on subprime-related debt.
Loss estimates for the financial sector have been between roughly $300 - $500 billion. Now UBS is projecting a heftier amount of losses. This is in line with the news that commercial real estate may be the next shoe to drop:
After suffering a beating from their exposure to home loans, banks and securities firms are about to take their lumps from office towers, hotels and other commercial real estate. And the losses could last longer than those from the subprime shakeout.
As the economy wobbles and financing costs rise because of the credit crunch, commercial-real-estate values are starting to slide, with analysts at Goldman Sachs Group Inc. projecting a decline of 21% to 26% in the next two years. That means misery for securities firms with exposure to commercial-real-estate loans and commercial- mortgage-backed securities.
William Tanona, a Goldman analyst, expects total write-downs of $7.2 billion by Bear Stearns Cos., Citigroup Inc., J.P. Morgan Chase & Co., Lehman Brothers Holdings Inc., Merrill Lynch & Co. and Morgan Stanley in the first quarter. Those firms had combined commercial-real-estate exposure of $141 billion at the end of the fourth quarter.
The news for the financial sector has been terrible for the last 9 months. It started with Bear Stearns announcing two hedge funds lost $6 billion and simply progressed from there. This seems like a good time to take a closer look at the XLFs -- the financial sector tracking stock.

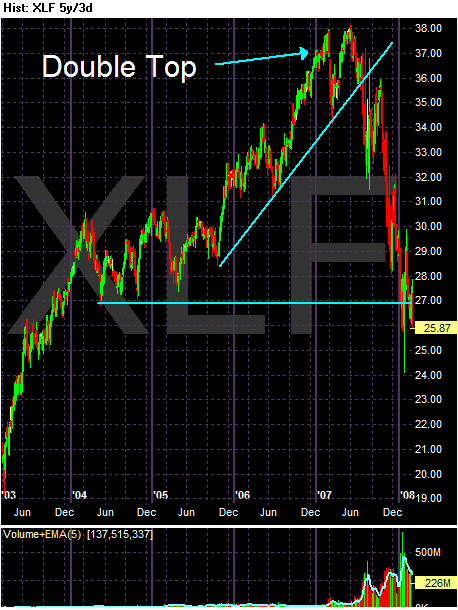
The 5-year chart shows the following:
-- The index formed a clear double top in early and mid-2007.
-- The index clearly broke this trend in mid-3Q 2007.
-- The index has dropped about 27% since then.
-- The drop occurred on extremely heavy volume.

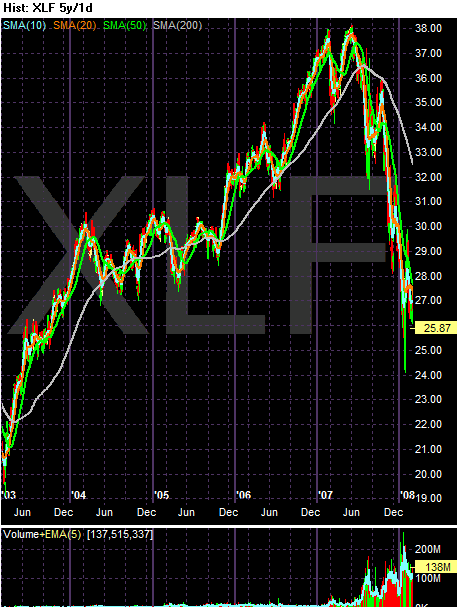
Above is the same chart with the daily SMAs. Notice prices are clearly below the 200 day SMA by about 20%. That is a serious bear market.

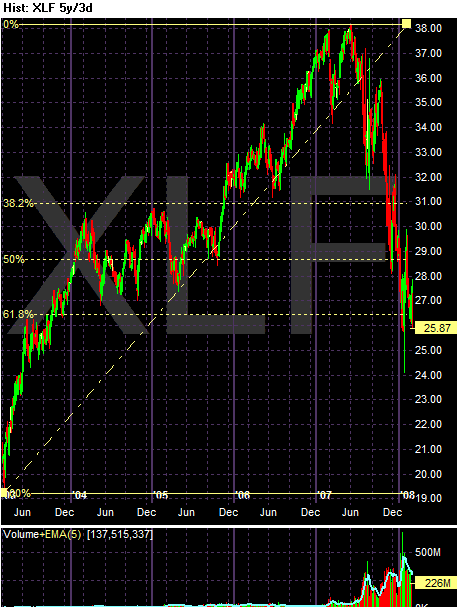
Assuming the last 5 years comprise one long rally, here are the Fibonacci levels. Notice we are trading right at the lowest level.

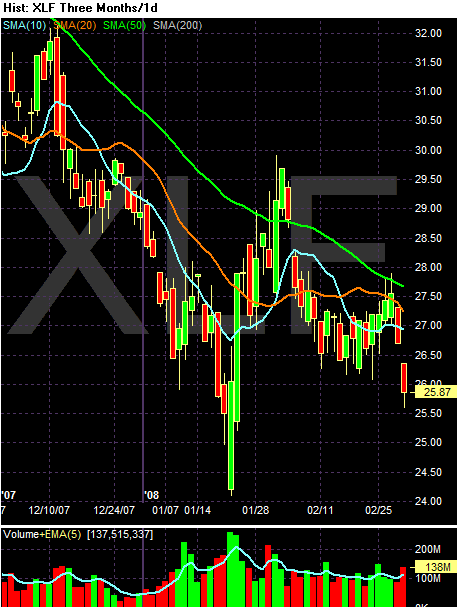
Above is a three month daily chart to see the SMAs close-up. Notice:
-- Prices are below the 200 day SMA (see above)
-- The shorter SMAs are below the longer SMAs
-- The 200 and 50 day SMA are both headed lower.
-- The 10 and 20 day SMA are neutral as both are heading sideways right now.
The bottom line is this chart looks terrible. There are plenty of technical and fundamental reasons to stay away for the foreseeable future.