Below is a table of "The 10 Stocks for the Next Decade" that appeared in Smart Money magazine in December 1999. I found the article while cleaning out some papers today.
Some of the companies are actually still in business, but most, regrettably, are not. The basket as a whole must be down some 90% or more; I'm actually trying to have someone do that calculation for me, and will report back if/when I get the numbers.
In addition to being among the worst possible baskets one could have put together a decade ago, some of the commentary is similarly priceless, like the reference to Elaine Garzarelli (she of the one good call in her career) saying that tech was "undervalued" in late 1999. And the dismissal of Sandy Weill's critics for their continued harping about how he was making Citi "too big, too diverse, [and] too unwieldy to manage effectively."
It's just a classic from beginning to end and, if I do say so myself, argues very strongly in favor of having a good financial adviser on whom you can rely. What possesses investors to believe what they read from people who are journalists first and foremost is beyond me.
The Consumer Price Index for All Urban Consumers (CPI-U) decreased 0.2 percent in July before seasonal adjustment, the Bureau of Labor Statistics of the U.S. Department of Labor reported today. Over the last 12 months the index has fallen 2.1 percent, as a 28.1 percent decline in the energy index since its July 2008 peak has more than offset increases of 0.9 percent in the food index and 1.5 percent in the index for all items less food and energy.
On a seasonally adjusted basis, the CPI-U was unchanged in July following a 0.7 percent increase in June. Small declines in the food and energy indexes offset a small increase in the index for all items less food and energy. The food index declined 0.3 percent in July with all six major grocery store food groups posting declines. The energy index, which rose 7.4 percent in June, fell 0.4 percent in July. Decreases in the indexes for gasoline, fuel oil, and electricity more than offset an increase in the index for natural gas.
Here is the month to month increase/decrease chart of CPI:
Look back at the month to month chart and notice it goes back through 2007-2008 when we had a massive commodity spike. The peak level for that time was right around 5%. This is not a great level, but it is not fatal either. In addition, had the economy not been approaching/in a recession during this time the Fed had the weapon of interest rates to start dealing with the problem.
Now, let's look at two points in the current situation from the perspective of demand pull and cost push inflation. Demand pull inflation occurs when the number of buyers of a good increase relative to the quantity supplied. Or in less "eco-geek" speak there are more buyers than sellers. In that case the price of a good increases. However, consider where we are in the unemployment picture right now -- 9.4%. Incomes are dropping. Retail sales have bottomed and are moving sideways. In short, there is no information out there that indicates we are approaching a situation where people are going to start a large amount of buying. That pretty much eliminates demand pull inflation.
Cost push inflation occurs when commodity prices/input prices increase to the point where industry has to start increasing the prices it charges for goods. However, there is a tremendous amount of excess capacity in the system right now. Capacity utilization is at/near a 40 year low. That means that an input price increase can be dealth with through an increase in capacity. Also note that one of the biggest input costs -- labor prices -- is in no position to ask for an increase in wages. In short, cost push inflation is not an issue either.
Then there is the possibity of an increase in monetary supply. However, that makes several assumptions which aren't valid. First, it assumes the Fed will not mop up excess liquidity in a timely fashion. I find that argument highly unlikely. So far Bernake has done a good job of dealing with this situation. Secondly, consumer loan demand is droppping and loan terms are becoming stricter. This lowers the possibility of an increase in loans which would expand the monetary base. Third, monetary velocity is low right now and given weak consumer demand it is difficult to see where it would increase.
Bottom line -- I simply don't see inflation being an issue for the foreseeable future.
I’ve made the case before that Real Retail and Food Services Sales were flatlining, about the best that could be said for the metrics that matter to the NBER. With this week’s release, here’s an update:
Verdict: Still flatlining. The headline print was down 0.1 percent, but ex-autos it was down a hefty 0.6 percent, much worse than expected.
HOWEVER, if we look at Year-Over-Year (YoY) percent change ex-autos, we see a bit of a different story:
The Cash for Clunkers program, aside from pulling forward sales from future quarters, may have also had the unintended consequence of sapping consumer spending that might have gone elsewhere. Not sure we could quantify that, but it’s a possibility.
In any event, I am still not sold on this recession’s end, much as I’d like to be. We will get (or may have already gotten, depending on when this post goes up) some additional economic data today. Here’s hoping for the best, but certainly not expecting it.
This morning the BLS reported that consumer inflation remained unchanged (seasonally adjusted) in June, declining -0.2% NSA. Year-over-year prices have fallen - 2.1% into deflation. YoY consumer deflation is only surpassed by 1949's -2.9% in the post-Depression era.
The 2009 first half inflation data unfolded in accord with the optimistic scenario I laid out in January:
In the Optimistic scenario, the fiscal and monetary stimuli, together with intelligent new political leadership in Washington, halt the meltdown perhaps by mid-year, and wage reductions remain the exception. In the Pessimistic scenario, the stimuli fail, and wage reductions spread, leading to a wage-price deflationary spiral.
In the Optimistic scenario, monthly inflation remains positive, but perhaps at 1/3 to 1/2 the level of last year. By the end of June, first half 2009 inflation will be in the 1.4%-2.2% range. Year over year, however, as the 2008 numbers are replaced, DEflation will be realized, falling to (-2.0%) - (-2.7%) range....
In the Pessimistic scenario, monthly inflation remains near 0%-1% in the first half, and is firmly negative, though less than 2008 in the second half. By mid-year, YoY DEflation will be somewhere in the (-3%) - (-4.5%) range....
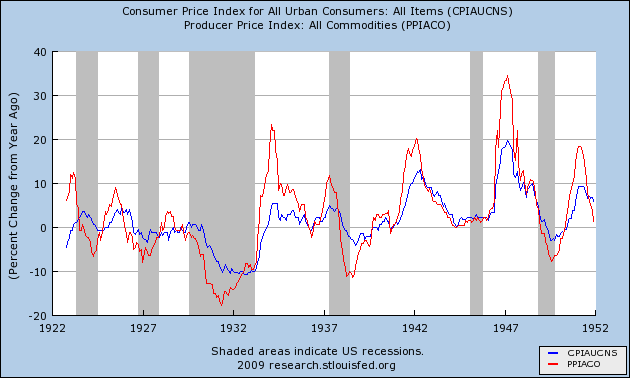
In the pre-World War 2 era of deflationary busts, including the Great Depression, PPI for commodities bottomed and turned around either before or simultaneously with CPI. when YoY CPI bottomed, the bust ended. Such a bottom coincided with increased demand. Here is the consumer and commodity inflation data during the deflationary 1920-1950 era demonstrating this point: Note that commodities (in red) almost always turned up before the economy as a whole did. Typically CPI (in blue) bottomed on a year-over-year basis at the end of deflationary recessions, including the Great Depression.
In June, for the first time, YoY commodity deflation may have bottomed, rising from -13.4% to -13.2% YoY. This month's CPI is almost certainly the bottom for that metric. That the deflation in both YoY and CPI has bottomed is likely to be confirmed next month, when the comparisons will be to August 2008 when CPI was -0.4% NSA. It is noteworthy that as of this morning, 3 of the 5 coincident indicators known to be used by members of the NBER to date the end of recessions -- real retail sales, aggregate hours worked, and industrial production -- all appear to have bottomed, consistent with the pre-WW2 deflationary bust scenario outlined above.
This morning Industrial production was reported up 0.5%, as was capacity utilization.
For 4 months I have been highlighting the surge in Leading Economic Indicators. As of this morning, 3 of the 5 known metrics relied upon to date the end of recessions -- real retail sales, aggregate hours worked, and industrial production -- all have stopped declining, and two have affirmatively turned back up.
The remaining two are nonfarm payrolls, which if current trend continues, will turn up in 2-4 months, and wages which remain a real and structural problem.
In summary, the recession has bottomed, but we can't say any meaningful "recovery" has yet begun.
The weekly chart shows a clear downtrend. The MACD and RSI are both moving lower. Prices are moving lower and have consolidated losses in at least on triangle. All the EMAs are moving lower, the shorter EMAs are below the longer EMAs and prices are below all the EMAs.
The daily chart shows a move lower but notice that the technical indicators are weakly indicating a lower move. The trajectory -- the steepness of the RSI and MACD -- aren't that severe right now.
The main issue with the SPYs is they are moving in a sideways consolidation move. This is the best possible situation the bulls could hope for right now. The market is oversold and needs a sell-off to shake out some trades. A sideways move allows traders to get comfortable with current levels without the pain.
The U.S. Census Bureau announced today that advance estimates of U.S. retail and food services sales for July, adjusted for seasonal variation and holiday and trading-day differences, but not for price changes, were $342.3 billion, a decrease of 0.1 percent (±0.5%)* from the previous month and 8.3 percent (±0.7%) below July 2008. Total sales for the May through July 2009 period were down 9.0 percent (±0.5%) from the same period a year ago. The May to June 2009 percent change was revised from +0.6 percent (±0.5%) to +0.8 percent (±0.2%).
Retail trade sales were down 0.1 percent (±0.7%)* from June 2009 and 9.4 percent (±0.7%) below last year. Gasoline stations sales were down 32.5 percent (±1.5%) from July 2008 and building material and garden equipment and supplies dealers were down 14.7 percent (±2.0%) from last year.
I have no idea why this number seems to be generating so much buzz. Retail sales dropped .1%. If you look at the chart you'll notice two things:
1.) In the last 7 months we've had 4 increases and three decreases. Two of those decreases have been small.
2.) The year over year number still shows a bottoming trend in place.
While no one likes a decline, this one is small. And the fact that it missed analysts projections falls under the "I don't care" category.
The National Federation of Independent Business (NFIB), the “voice” of small business in America, issues a monthly Economic Trends report on the second Tuesday of every month, meaning we got one this week. The news was not good. I was going to dissect it myself, but David Rosenberg has spared me that effort, commenting on it in Wednesday’s research piece:
The National Federation of Independent Business releases a small business sentiment index every month that works somewhat like the ISM index — and it fell in July to 86.5 from 87.8 in June and 88.9 in May; and now at its lowest level since March (curiously enough, when the market was making its lows). Not only that, but it was the fifth weakest reading in the past 30 years! Recall that this index led the peak in the ISM during that failed rally in early 2002 by a good three months.
Other interesting results from the July NFIB report : • The job openings subindex fell to 9 from 11 in June • The net percent of firms expecting the economy to improve swung from +7% to -3% • The index measuring corporate profit growth from the prior quarter eroded to -45 from -42. So companies may be beating their low-balled estimates made back on July 1st, but profits are still in decline. • The net percent saying inventories are too low barely budged, to -4 from -5; the net share saying they have been adding to inventories stayed at a record low -27 in July; and the index measuring plans to boost inventories went to -5 from -6. Where exactly is this supposed big inventory build? We know that the economics community sees the 1.7% plunge in June wholesale inventories as a bright spot since it makes the 3Q inventory “bounce” that much more of an appealing story; however, it may be the case that companies have no intentions of bolstering their stockpiles and are quite content leaving them at their current “tight” levels relative to sales. • Job hiring intentions slipped to -3 from -1 • Pricing power is non-existent; the net share of firms raising prices slipped to -19% from -17%. • As a result, top-line revenues are still deflating; the net share reporting improved sales over the prior quarter stayed at a record-low -34. • Credit spreads may have gone from Armageddon levels to just plain old recession levels, but small businesses are still having a tough time accessing credit. The index measuring credit being harder to get actually rose to 15 from 14 and is still near an all-time high. • In terms of the most important problems facing small businesses today, 32% said “poor sales” (by far the greatest concern), 22% said taxes, 12% said government regulation. Only 3% cited inflation and 4% mentioned labour costs as their top concern.
The main question with the oil market right now is this: is the market forming a double top? Clearly the price is currently at/near its previous peak. In addition, the RSI has printed a lower top (so far) and the the MACD's level is close to the level of the first peak. Prices are just above the 50 week EMA -- a level which they failed to hold a few months ago before the summer driving season.
The daily chart adds more credence to the double top theory. Notice that prices are about the same level as the first peak. But notice that both the RSI and MACD are at far lower levels then the previous peak. That is very interesting from a technical level as it indicates the second peak is technically weaker than the first peak.
Information received since the Federal Open Market Committee met in June suggests that economic activity is leveling out. Conditions in financial markets have improved further in recent weeks. Household spending has continued to show signs of stabilizing but remains constrained by ongoing job losses, sluggish income growth, lower housing wealth, and tight credit. Businesses are still cutting back on fixed investment and staffing but are making progress in bringing inventory stocks into better alignment with sales. Although economic activity is likely to remain weak for a time, the Committee continues to anticipate that policy actions to stabilize financial markets and institutions, fiscal and monetary stimulus, and market forces will contribute to a gradual resumption of sustainable economic growth in a context of price stability.
Recovery from the worst recession since the 1930s has begun as President Barack Obama’s fiscal stimulus -- derided as insufficient and budget-busting months ago -- takes effect, a survey of economists indicated.
The economy will expand 2 percent or more in four straight quarters through June, the first such streak in more than four years, according to the median of 53 forecasts in the monthly Bloomberg News survey. Analysts lifted their estimate for the third quarter by 1.2 percentage points compared with July, the biggest such boost in surveys dating from May 2003.
“We’ve averted the worst, and there are clear signs the stimulus is working,” said Kenneth Goldstein, an economist at the Conference Board in New York.
The new projections, following better-than-anticipated reports on manufacturing, employment and home construction, echo gains in investor confidence that have propelled the Standard & Poor’s 500 Stock Index to its high for the year. A rebound may help cushion declines in Obama’s approval ratings, political analysts said.
“The fact that people for the first time in over a year are starting to look at some glimmers of hope plays to the prospect of some strength in the stimulus,” said Susan Molinari, a Republican strategist in Washington who advised Rudy Giuliani during his presidential nomination campaign in 2008.
A few months ago the possibility of falling into the abyss seemed all too real. The financial panic of late 2008 was as severe, in some ways, as the banking panic of the early 1930s, and for a while key economic indicators — world trade, world industrial production, even stock prices — were falling as fast as or faster than they did in 1929-30.
But in the 1930s the trend lines just kept heading down. This time, the plunge appears to be ending after just one terrible year.
So what saved us from a full replay of the Great Depression? The answer, almost surely, lies in the very different role played by government.
Probably the most important aspect of the government’s role in this crisis isn’t what it has done, but what it hasn’t done: unlike the private sector, the federal government hasn’t slashed spending as its income has fallen. (State and local governments are a different story.) Tax receipts are way down, but Social Security checks are still going out; Medicare is still covering hospital bills; federal employees, from judges to park rangers to soldiers, are still being paid.
Confidence in the world economy surged to a 22-month high in August on signs the worst global recession since World War II is coming to an end, a Bloomberg survey of users on six continents showed.
The Bloomberg Professional Global Confidence Index jumped to 58.12 this month from 39.13 in July. It is the first time the reading exceeded 50, which means optimists outnumber pessimists. A measure of U.S. participants’ confidence in the world’s largest economy rose to 47.3 from 29.5, the survey showed.
“It’s clear the recession is over and some kind of recovery is underway,” said Nick Kounis, chief European economist at Fortis Bank Nederland Holding NV in Amsterdam, and a regular survey participant. “We have the biggest monetary and fiscal stimulus policy in history, globally, and we’re starting to see it work. Probably the next debate will be about how strong and sustainable the recovery is.”
The MSCI World Index has increased 12 percent in the past month and President Barack Obama said last week’s unexpected drop in the U.S. unemployment rate indicates the worst may be over. Nobel Prize-winner Paul Krugman said Aug. 10 that the world, now in a “rough stabilization” mode, has averted another Great Depression.
I pretty much agree with these statements. First, I think the economy is clearly bottoming. Here are some relevant charts to that matter:
Initial unemployment claims are still dropping
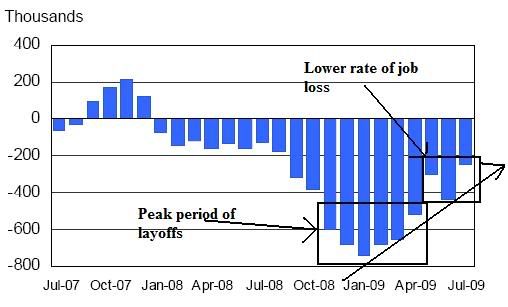
The rate of job losses are decreasing
ISM manufacturing is increasing
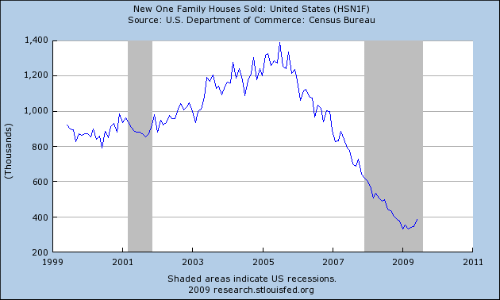
New homes sales have bottomed
Existing home sales have bottomed
The New York and Philly Fed are increasing
Retail sales have bottomed
Real PCEs have bottomed
2.) I think an interventionist government is a primary reason for the fact that we are not in the abyss. The Fed's actions -- while controversial -- saved the financial system from collapsing. They also helped to steady the credit markets. The government stimulus also helped to pump money into the economy, adding some much needed momentum to the economic situation.
The market is currently at the 38.2% Fibonacci retracement level from the 2007 peak. Also remember we're at an important fundamental time -- we're waiting for the Fed to issue it's policy statement. Funny how things line up like that, isn't it?
On the industrial metals weekly chart, notice the MACD and RSI are still rising. All the EMAs are moving higher, the 10 week EMA is about to cross over the 50 week EMA and the 20 week EMA is about to follow. Prices have been moving higher since the first quarter and they have been consolidating gains along the way.
The daily chart better shows the price action. Notice the rally is not too steep. Instead, it is fairly gentle. In addition we can better see how prices have consolidated gains as they have moved higher. Finally, notice the position of the EMAs -- the shorter EMAs are above the longer EMAs, all the EMAs are rising and prices are above the EMAs.
Agricultural prices are also in an uptrend, but a far less strong one. Instead of a solid move higher, prices are more or less in the middle of an upward sloping channel. The MACD and RSI are also giving mixed signals. Finally, the EMAs are jumbled instead of having a clear direction. In short, this is a chart looking for a direction.
The main issue with the daily chart is that prices have jumped higher but have failed to to anything since the move. The MACD and RSI are signaling strength. In addition, the shorter EMAs are moving higher and the 10 day EMA is about to cross over the 50 day EMA. But frankly, the chart just doesn't feel bullish to me.
I wish I was good enough at music editing so I could put the phrase "waitin' on the Fed" to ZZ Tops Waitin' on the Bus. Because that's what the market is really doing. While prices have dropped we're still clearly in a Fibonacci are.
As for support levels, consider the daily chart:
My primary concern with the chart is the Fibonacci levels -- they are pretty low right now. But, a sell-off would be helpful right now in the long run.
Norwalk, Conn.-based Priceline (PCLN) said it earned $2.02 a share, excluding special items such as stock-based compensation, in the second quarter. That's up 30% from the year-earlier quarter and way above the $1.75 consensus estimate of 15 analysts polled by Thomson Reuters.
.....
Rivals Orbitz (OWW) and Expedia (EXPE) recently reported second-quarter earnings that shattered analyst views by 16 cents and 7 cents, respectively, but their results continue to lag Priceline's. Orbitz saw its sales fall 19% from a year earlier, while Expedia's sales fell 3% and profit fell 5%.
Part of the reason why these companies are successful is they are generally pretty good at delivering low prices. However, people are buying from these companies. I find that point very interesting given the current environment.
More than $1.03 billion has already been paid out to cover the 245,384 vehicles traded-in under the program designed to replace gas guzzlers with more fuel-efficient vehicles, according to the U.S. Department of Transportation. Another $2 billion is now being funneled into the program, which is slated to run through November.
Starting last year, the Big Three U.S. auto makers began to cut back production to cope with swelling inventories as consumers skipped purchases amid the recession. During the bankruptcies of GM and Chrysler, both auto makers idled their plants, further reducing supply. Heading into July, it appeared auto makers finally had control of their inventories.
That changed as the government's clunkers program set off a flurry of buying. Even consumers who didn't qualify for the program made purchases. Under the program, formally known as the Car Allowance Rebate System, a customer who trades in a vehicle rated at 18 miles per gallon or less qualifies for a government voucher of $3,500 or $4,500 to buy a new car rated at 22 mpg or more. The allowance goes to the dealer, who must scrap the old vehicle.
With that story in mind, consider this chart:
The depth of the inventory correction is very deep. As a result inventories are incredibly lean. Any meaningful bump in consumption will possibly lead to shortages as producers ramp up production. I don't know how much this is going to be part of the recovery story. I do however think it will play a part.
The treasury market has three big problems: a rallying stock market, massive supply and an increased risk appetite. All of these are adding to the downward pressure on the Treasury market.
Prices are currently in a downward sloping channel with a decreasing RSI and MACD. Also note the very bearish orientation of the EMAs -- the shorter EMAs are below the longer EMAs and all the EMAs are moving lower.
Also note the riskier parts of the bond market are rising.
Click for a larger image
The investment grade bond market is rallying, as is
The junk bond market
Given the supply coming onto the market, I would not expect a rally in the Treasury market.
Not much in the way of price action today. Prices were down .18% on the SPYs. As the daily chart below shows, notice that prices opened lower, rallied, fell and then wound up back where they started.
Click for a larger image.
The main action today came in conservative/defensive areas. The TLTs were up 1.25%, the XLVs were up .8% and the IEFs were up .64%. My guess is traders are playing it safe until the Fed releases the minutes on Wednesday. Ultimately this is good for the bulls as it allows the market to cool off right now; the market is pretty over-extended and it needs to let some profits get taken -- or at least move sideways for a bit. Notice how the RSI is peaking right now:
Also note how the MACD is approaching a sell signal:
So we got a “green shoot” on Friday in the form of “only” a -247,000 print on the nonfarm payrolls and a drop in the employment rate to 9.4% (mostly due to folks just leaving the labor force). When we got a -223,000 (initial) print for April in May 2001, and the unemployment rate was 4.5%, we got commentary like this (via the NY Times): ''These numbers mean that the economy is right now at about zero growth,'' said Peter Hooper, chief domestic economist for Deutsche Bank North America. ''I don't see much of anything positive in this report.'' But that was in the days when -200k (or more) NFP print was considered unacceptable, I guess. Now it’s a cause for celebration. Here’s the employment situation updated through Friday relative to previous recessions:
(Source: St. Louis Fed)
Maybe it’s just me, but that chart doesn’t exactly make me feel like dancing a jig, even knowing it’s a lagging indicator.Still not liking the glide path, especially given the fact that we’re now some 20 months removed from the recession’s starting point (December 2007).
But let’s move on and talk about what sort of recovery we might eventually see.Bonddad and I recently wrote about why the consumer will probably not be leading the economy out of recession (forgive me for saying so, but I think it was a really good piece).
To add to that file, I’ve replicated below a chart published last week by former ML Chief Economist David Rosenberg, who continues to do stellar work at his new shop, Gluskin Sheff:
Various US GDP Components:Average Contribution to Change in The First Year of Economic Recovery
(percentage points)
(Source: BEA.gov.Average of four quarters following quarter in which NBER determined recessions ended.)
In other words, the consumer – through Personal Consumption Expenditures (PCE) – contributes 3.2 percentage points to GDP in the first (usually fairly strong) year of post-trough economic recovery.
That’s simply not going to happen this time around, in my opinion, and here’s another vivid illustration to make that point.PCE are running well below even the worst previous recession of the post-war era:
PCE should be on a decent uptrend by now – just look above at the “average” and “highest” performance.They’re not (uptrending), and it’s simply too important (and too big) a component of recovery to think we’re going to get very far without it.This is why I worry that Q3 is going to be a one-hit wonder.
Among the reasons PCE aren’t on the upswing is this:We know that there’s no organic income growth:
(Source: BEA.gov)
Further, the American consumer is shedding credit like never before.In another – but much less publicized – report released last Friday, we saw that consumer credit, on a year-over-year basis, has contracted by a record $71 billion dollars:
(Source: Federal Reserve)
Given that credit was responsible for fueling much of our recent economic growth, its decline continues to signal a frugal future.
If there was a “green shoot” to be found in Friday’s report it was in Aggregate Weekly Hours, though it was so small as to be almost imperceptible.I’ll highlight it for you below:
NBER Business Cycle Dating Committee member professor Jeffrey Frankel watches this metric very closely, and this is what he had to say:“The latest numbers show that the length of the workweek has begun to rebound from its record low of two months ago. As a result, the BLS reports that total hours worked in the economy did not decline at all in July, for the first time since the financial meltdown of last September.One never wants to read too much into a single report, especially one subject to revision. But when today’s labor news is combined with a variety of other data, it looks likely that the economy is finally at or near the turning point.”
To say that whatever it is the economy’s doing right now is “fragile” is, I think, to understate the case.I continue to look for a driver of growth going forward, and as yet have not found it.When the aforementioned David Rosenberg left Merrill Lynch, he penned some rules to remember.Among the most important, in my opinion, is #12:“Get the US consumer right and everything else will take care of itself.”That is why I remain steadfastly focused on the U.S consumer, who is 70% of U.S. GDP and about 20% of GDP worldwide – because no one drives business like the U.S. consumer.And until the U.S. consumer is back on his feet, it’s hard to imagine an environment that will produce any more than subpar growth.
On an unrelated note, the also aforementioned professor Jeffrey Frankel had this to say about the work Obama has done to address the economic disaster he inherited:“In any case, in light of the difficult circumstances, I think Obama has done amazingly well. […]In my view, overall, Obama has gotten far more things right than wrong. He has bravely proposed things that most sensible economists — whether Republican or Democrat — have long favored. Proposing is not always the same as enacting; there is the matter of Congress. But he has tried to get them passed, and has tried to do it in a bipartisan way.”
The market has rallied 15.5% since the mid-July. Also note how steep the line is -- line's of that amplitude don't last. Prices have already broken through the upward sloping trend line and are moving sideways. For the bulls, an ideal situation this week is for sideways movement or a fall to a natural support level like the 10 day EMA or SMA. To that end, we have the Fed this week which usually provides a natural slowing down as markets wait for the Fed's decision. While it's doubtful we'll see any move on interest rates (and probably won't for some time) the statement's tone is very important.