- by New Deal democrat
This week's big number, without doubt, was the drop in initial jobless claims to 407,000, the lowest reading in two and a half years. At long last layoffs have broken to the downside from this year's stagnation, boding well for nonfarm payrolls. In other news in a truncated week, personal income and spending both rose nicely in October, as did PCE's (see Calculated Risk for a nice trend graph). New and existing home sales declined to their summer levels. This really just shows bottom bouncing since April - certainly not good, but not doom either. Durable goods declined over 3% in October, but only with September's data revised upward to over +5%. In other words, October's durable goods orders were only the second best reading in two years. The upward trend is firmly intact.
As you let your turkey and dressing slowly digest, let's take a look at this week's high frequency data:
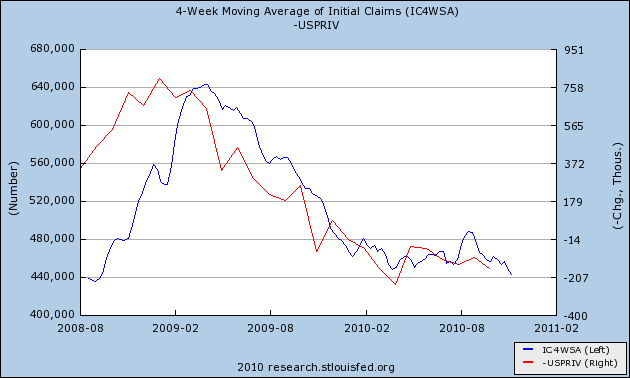
As I indicated above,BLS reported 407,000 new claims. The 4 week moving average fell to 436,000. Next week could easily see this average fall under 430,000 (because a reading from 3 weeks ago of 459,000 will be replaced).
Gas at the pump declined one entire penny to $2.88 a gallon. A barrel of Oil increased to $83 this week. While the trend has been upward in the last several months, we have declined from a couple of weeks ago and did not cross the $90 threshold (that we did cross in April). Gasoline usage reamins lower than last year, 8.829 B gallons vs. 9.092 a year ago. Gasoline stocks are back into their normal range for this time of year. Over the longer term, gasoline usage has remained about 5% below its rate from the first half of the past decade.
The Mortgage Bankers' Association reported that its seasonally adjusted Purchase Index increased 14.4% last week, rising to a new post-April high, and only 7.4% less than a year ago. Meanwhile, the Refinance Index decreased 1.0%, the lowest since June, due to increased mortgage rates (to which this index is, not surrisingly, very sensitive).
The ICSC reported same store sales for the week ending November 20 decreased -0.6% week over week, but were up 2.8% YoY, down from +3.4% the last two weeks. Shoppertrak once again failed to report this week.
Railfax for the third week in a row showed a decline in the advance over last year's loads for all sectors, although this week's decline was mild.
The American Staffing Association reported for the week ending November 13 a very slightly decline of 0.04%, remaining at 100.0. This is typical for this time of year. In the next few weeks this index will decline substantially, but the question will be how far in comparison with last year.
M1 and M2 were not updated this week due to the holiday.
Weekly BAA commercial bond rates increased 0.08% last week to 6.03%. This compares with yields on 10 year bonds up +0.21%. This does not indicate any stress on corporate bonds.
The Daily Treasury Statement showed $112.1 B in receipts vs. $103.1 B a year ago, a gain of 8.95% for the first 16 days of November. For the last 20 days, receipts are up $130.1 B vs. $120.2 B a year ago, a gain of about 8.2%. Since the absolute recession bottom in withholding taxes was no later than October 2009, this month marks the first YoY advance over an advancing underlying real number.
With the exception of Railfax, which is probably showing the same industrial pause we saw with durable goods this week and industrial production last week - an inventory correction telegraphed by the ISM data in the LEI over the summer and early autumn - the rest of the high frequency data is showing continued economic advance.
In the coming week we get our first look at November, including payrolls. Will the good news in initial jobless claims show up there? We'll see.
Friday, November 26, 2010
Wednesday, November 24, 2010
Happy Thanksgiving
With the exception of weekly indicators on Friday, we'll be back on Monday. Have a good and safe weekend.
Initial Jobless Claims GREAT: Durable Goods Numbers Very Bad
From Bloomberg:
Applications for unemployment benefits in the U.S. fell more than forecast last week to the lowest level since July 2008, reinforcing evidence the labor market is healing.
Jobless claims declined by 34,000 to 407,000 in the week ended Nov. 20, Labor Department figures showed today in Washington. The median projection of economists surveyed by Bloomberg News called for a drop to 435,000. The total number of people receiving unemployment insurance decreased to the lowest in two years, and those on extended payments also fell.
Fewer firings lay the groundwork for a pickup in job creation that will generate incomes and spur consumer spending, which accounts for 70 percent of the economy. Even with companies firing fewer workers, unemployment will be slow to decline, according to the Federal Reserve’s latest forecast in which policy makers also lowered their growth projections.
This is -- without a doubt -- the best data point I've seen in some time. This number has been stuck in the 450,000 range for the better part of this year. While the length of this elevated number has been consistent with the last two recoveries, their elevated level has been an extremely concerning number. However -- this number is really good and the best print all year. While this is only one data point, it's a really good one.
Orders for U.S.-made durable goods fell 3.3% in October -- the largest decline since January of 2009 -- as transportation orders fell, the Commerce Department reported Wednesday. Economists polled by MarketWatch had expected a decline of 0.2%. Excluding transportation, new orders fell 2.7% in October - the largest decline since March of 2009. Core durable-goods orders, which are orders for capital goods excluding defense and aircraft, fell 4.5% in October after a 1.9% rise in September.
This number was bad across the board; most sub areas of the report showed a decline. The slowdown in the manufacturing sector continues.
Personal Savings & Spending as precursors to Economic Expansion & Job Growth
- by New Deal democrat
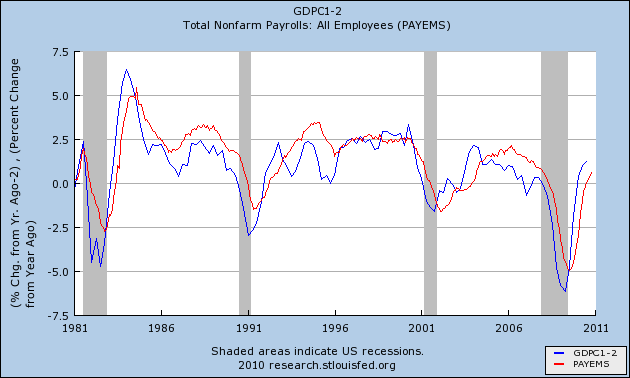
One of the best short-term precursors to job growth (besides real retail sales) is GDP growth. Generally it takes 2% YoY GDP growth to generate job growth, so normalizing for that, there is a very clear relationship:
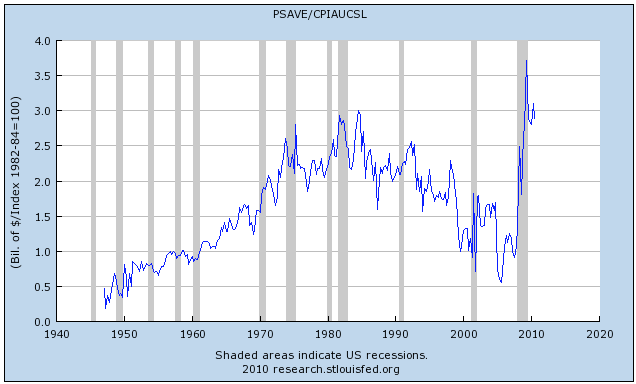
Among the best longer-term precursors, as I explained back in July, is the "real personal savings rate." To update this overview, first let's look at real, i.e., inflation-adjusted, saving. As you can see from this first graph, it is at the highest level in at least half a century:
Now let's take this same data and translate it into the real, inflation-adjusted, savings rate.
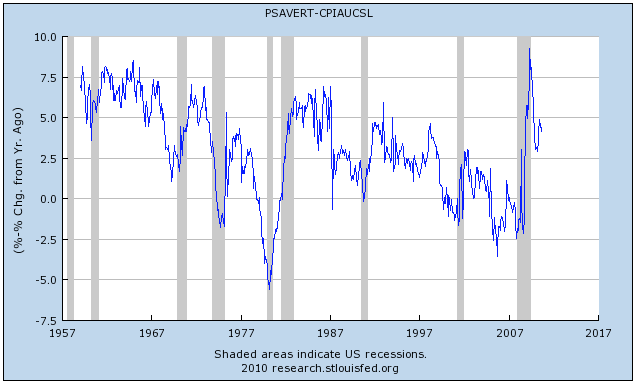
This too briefly was at half-century highs at the very bottom of the recession. Since then the savings rate has declined, but is still in the higher range for the last several decades.
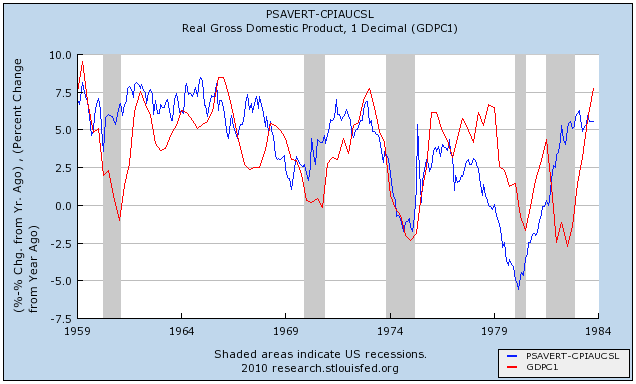
Now let's take the real personal savings rate (blue) and compare it with real GDP (red). Here is the relationship between 1959 and 1984:
and here is the same relationship from 1984 to the present (note: this is before this morning's data):
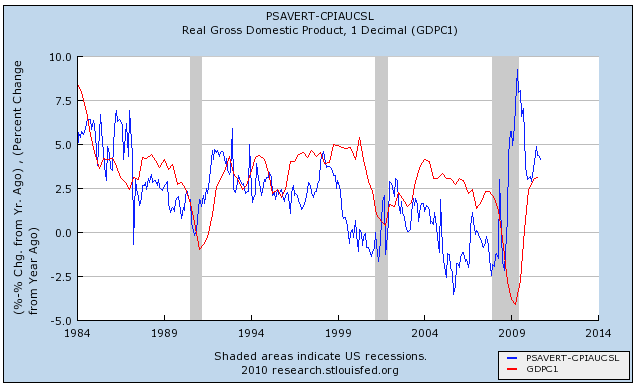
The relationship isn't perfect, but the lagged correlation is clear. A substantial change in the real personal savings rate is mirrored by a similar substantial change in real GDP about 6 to 18 months later. The logic of this isn't hard to follow: increased savings serve as the "tinder" that ignites subsequent spending. Once the spending starts, an economic boom begins. When the savings rate declines substantially, the fuel available for subsequent spending declines, and so does spending itself, with a lag.
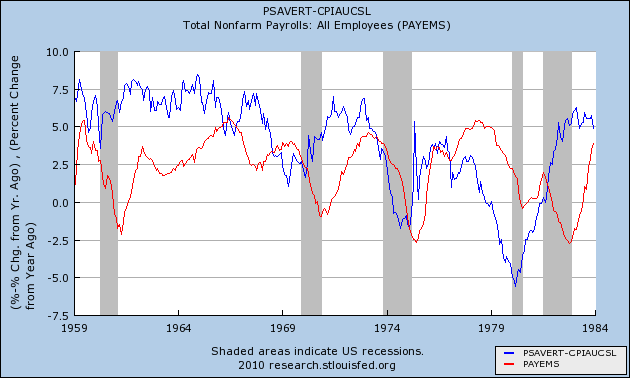
Since (1) the real personal savings rate leads real GDP; and (2) real GDP leads employment; let's put those two together and show the real personal savings rate (blue) and employment (red).
First, here is 1959 to 1984:
and here is 1984 to the present:
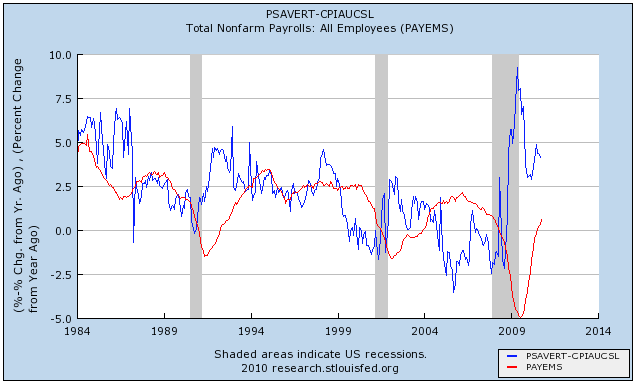
In summary, the real personal savings rate is a very good precursor for employment in a range of 18 to 30 months later. We are now 17 months past the June 2009 peak. This relationship predicts further increases in YoY job growth beginning about now and continuing in 2011.
Needless to say, I am very encouraged by this morning's drop in initial jobless claims to 407,000, and the decline in the 4 week average to 436,000. Here is the trendline I drew on Monday comparing initial jobless claims with employment in the recoveries from the last two severe recessions:
Between real retail sales, declining jobless claims, a positive surprise in GDP, and a wellspring of fuel in the real personal savings rate, almost all engines are "GO" for a takeoff in robust job growth. Let's hope this is the beginning.
One of the best short-term precursors to job growth (besides real retail sales) is GDP growth. Generally it takes 2% YoY GDP growth to generate job growth, so normalizing for that, there is a very clear relationship:
Among the best longer-term precursors, as I explained back in July, is the "real personal savings rate." To update this overview, first let's look at real, i.e., inflation-adjusted, saving. As you can see from this first graph, it is at the highest level in at least half a century:
Now let's take this same data and translate it into the real, inflation-adjusted, savings rate.
This too briefly was at half-century highs at the very bottom of the recession. Since then the savings rate has declined, but is still in the higher range for the last several decades.
Now let's take the real personal savings rate (blue) and compare it with real GDP (red). Here is the relationship between 1959 and 1984:
and here is the same relationship from 1984 to the present (note: this is before this morning's data):
The relationship isn't perfect, but the lagged correlation is clear. A substantial change in the real personal savings rate is mirrored by a similar substantial change in real GDP about 6 to 18 months later. The logic of this isn't hard to follow: increased savings serve as the "tinder" that ignites subsequent spending. Once the spending starts, an economic boom begins. When the savings rate declines substantially, the fuel available for subsequent spending declines, and so does spending itself, with a lag.
Since (1) the real personal savings rate leads real GDP; and (2) real GDP leads employment; let's put those two together and show the real personal savings rate (blue) and employment (red).
First, here is 1959 to 1984:
and here is 1984 to the present:
In summary, the real personal savings rate is a very good precursor for employment in a range of 18 to 30 months later. We are now 17 months past the June 2009 peak. This relationship predicts further increases in YoY job growth beginning about now and continuing in 2011.
Needless to say, I am very encouraged by this morning's drop in initial jobless claims to 407,000, and the decline in the 4 week average to 436,000. Here is the trendline I drew on Monday comparing initial jobless claims with employment in the recoveries from the last two severe recessions:
Between real retail sales, declining jobless claims, a positive surprise in GDP, and a wellspring of fuel in the real personal savings rate, almost all engines are "GO" for a takeoff in robust job growth. Let's hope this is the beginning.
Productivity Increases Slowing Employment Growth
From Bloomberg:
Not far from where Federal Reserve Chairman Ben S. Bernanke grew up, a revolution inside a Campbell Soup Co. plant explains why U.S. corporations are piling up profits -- with little need to hire more people.
Workers such as “Big John” Filmore, a 28-year Campbell veteran, huddle every day with management in situation rooms before their shifts to find ways to save money for the company. Rising productivity is helping boost profit margins here in Maxton, North Carolina, where 858 workers turn out a billion meals a year, and at most of the 243 non-financial companies in the Standard & Poor’s 500 Index with rising profit margins.
Companies slashed 8.5 million jobs during the worst recession since the Great Depression, while also slowing capital investment plans. Campbell, the world’s largest soup maker, DuPont Co., the third-biggest U.S. chemical maker, and United Parcel Service Inc., the world’s largest package-delivery business, are asking workers to help save cash by working smarter with existing technology. A potential cost: Efficiency gains reduce the chances recession-casualty jobs will come back.
“When the productivity growth comes, then watch out because that is when companies start not needing so much labor,” Edmund Phelps, a Columbia University economist and Nobel laureate, said in an interview.
Some 142 non-financial companies in the S&P 500 had improvements in operating margins of three percentage points or more from the final three months of 2007, when the previous expansion peaked, compared with the most recent quarter, according to data compiled by Bloomberg as of yesterday.
GDP Increases 2.5%
Note -- I'm traveling with an old computer, so the daily charts won't be up until I return home next Monday.
From the BEA:
First, note there is a breadth of help for GDP: people are spending money, exports are increasing and the inventory investment cycle continues. This is a good smattering of the various economic sectors that can contribute to growth, indicating we're not as bad off as some pundits claim. Additionally, the negative whack from imports decreased.
PCEs accounting for 1.97 of the 2.5% increase, which places them on pace with their traditional role as the 70% driver of the economy. Overall fixed investment added 1.51, with non-residential adding .96 while residential subtracted .75. Expect some harping on the 1.31 contribution from inventory stocking (which for some unexplained reason has become an invalid economic activity). However, I personally don't think this is bad at all. Net exports took 1.76 off growth, indicating the trade balance is once again an issue going forward for the economy.
I'm particularly impressed with the continued improvement in PCEs, which were up 2.8% from the preceding quarter. Service expenditures were up 2.5% and durable goods purchases were up 7.4%. Consumer are still spending money, although at a slower pace than in previous expansions when PCE month to month growth was usually above 3%. Gross investment increased 12.4%, which is a decrease from the 26.2% pace of the previous quarter. This deceleration is to be expected, as the previous pace of expansion was unsustainable. Imports increased 16.8% and exports increased 6.3%. While the pace of import increases decreased, they are still increasing at a far faster pace than exports -- a trend which needs to change.
Overall, this is an encouraging report going forward. While it's not a barn burner, the upward revision is a good and welcome development.
From the BEA:
Real gross domestic product -- the output of goods and services produced by labor and property located in the United States -- increased at an annual rate of 2.5 percent in the third quarter of 2010, (that is, from the second quarter to the third quarter), according to the "second" estimate released by the Bureau of Economic Analysis. In the second quarter, real GDP increased 1.7 percent.
The GDP estimates released today are based on more complete source data than were available for the advance estimate issued last month. In the advance estimate, the increase in real GDP was 2.0 percent (see "Revisions" on page 3).
The increase in real GDP in the third quarter primarily reflected positive contributions from personal consumption expenditures (PCE), private inventory investment, nonresidential fixed investment, exports, and federal government spending that were partly offset by a negative contribution from residential fixed investment. Imports, which are a subtraction in the calculation of GDP, increased.
The acceleration in real GDP in the third quarter primarily reflected a sharp deceleration in imports and accelerations in private inventory investment and in PCE that were partly offset by a downturn in residential fixed investment and decelerations in nonresidential fixed investment and in exports.
First, note there is a breadth of help for GDP: people are spending money, exports are increasing and the inventory investment cycle continues. This is a good smattering of the various economic sectors that can contribute to growth, indicating we're not as bad off as some pundits claim. Additionally, the negative whack from imports decreased.
PCEs accounting for 1.97 of the 2.5% increase, which places them on pace with their traditional role as the 70% driver of the economy. Overall fixed investment added 1.51, with non-residential adding .96 while residential subtracted .75. Expect some harping on the 1.31 contribution from inventory stocking (which for some unexplained reason has become an invalid economic activity). However, I personally don't think this is bad at all. Net exports took 1.76 off growth, indicating the trade balance is once again an issue going forward for the economy.
I'm particularly impressed with the continued improvement in PCEs, which were up 2.8% from the preceding quarter. Service expenditures were up 2.5% and durable goods purchases were up 7.4%. Consumer are still spending money, although at a slower pace than in previous expansions when PCE month to month growth was usually above 3%. Gross investment increased 12.4%, which is a decrease from the 26.2% pace of the previous quarter. This deceleration is to be expected, as the previous pace of expansion was unsustainable. Imports increased 16.8% and exports increased 6.3%. While the pace of import increases decreased, they are still increasing at a far faster pace than exports -- a trend which needs to change.
Overall, this is an encouraging report going forward. While it's not a barn burner, the upward revision is a good and welcome development.
Tuesday, November 23, 2010
US Agriculture Leading Exports
From Bloomberg:
The unemployment rate in North Dakota is 3.7 percent, and “if it wasn’t for cable news, we probably wouldn’t have any idea that the rest of the country was any different,” said Doug Johnson, co-owner of crop insurer TCI Insurance in West Fargo, who added six new employees this year.
As businesses across the U.S. struggle to recover from the deepest recession since World War II and the national jobless rate remains stuck at 9.6 percent, Johnson has benefited from his location in the northern Great Plains, where a boom in commodities, such as wheat and soybeans, is helping to create jobs, lift farmers’ incomes and fuel demand for goods ranging from Deere & Co. tractors and Agco Corp. combines to dinners at local restaurants.
The agricultural Midwest -- particularly North and South Dakota, Kansas and Nebraska -- has been leading the U.S. economic recovery as its banks, businesses and households avoided the worst of the housing bubble’s collapse and the financial crisis that followed. Now the region is getting a further boost from record exports of commodities, driven by demand in China and Russia and a declining dollar. U.S. farm shipments next year may surpass the 2008 record of $115.3 billion, Joe Glauber, the U.S. Department of Agriculture’s chief economist, said last month.
“This has been the brightest spot in the U.S. economy throughout the recession, the only part of the country that has held up reasonably well,” said Mark Zandi, chief economist at Moody’s Analytics Inc. in West Chester, Pennsylvania.
This is a very interesting development -- and something I'll be looking into more over the next few weeks.
The Story you're *not* reading about here
- by New Deal democrat
This blog has been totally silent on the "Foreclosuregate" crisis - and after this post, likely will continue to be. That isn't an oversight or a blind spot on our part. It is intentional, and for a very good reason -- there's no public data available to back up an objective assessment. Bonddad recently added a tagline from Jon Stewart to this blog's title. For my part, I'd choose "The Data, the Whole Data, and Nothing But the Data." In short, we have made a conscious decision (that we are constantly revisiting!) to keep this blog focused on data, and in the case of foreclosuregate, there is virtually none.
Broadly speaking, foreclosuregate occurs right at the intersection of law and the economy. On the one hand, it is a matter of due process, of access to and alleged wholesale fraud upon the courts -- and the remedies and punishments for violations. On the other hand, there are massive amounts of financial transactions and wealth potentially at issue. But the two parts of foreclosuregate are generally separate.
The legal issue -- of "robosigners," of incidents where the wrong bank may have foreclosed on a property, of foreclosing where homeowners rightfully or wrongfully believed they had negotiated forebearance through HAMP, and even one or two cases where a homeowner had no mortgage whatsoever but had foreclosure proceedings initiated against them anywhay -- has been ably and throughly covered by Barry Ritholtz at The Big Picture, with the appropriate sense of outrage. I am in full agreement with those feelings and have nothing significant to add.
But the legal issue has little effect on the economy. Virtually all of the due process concerns are that while the homeowner is in arrears on their mortgage, the plaintiff has failed to proceed in accordance with the law, and may have committed fraud or something close to it in order to hurry the proceedings. In other words, in the vast, vast majority of cases, the ultimate legal outcome would be the same -- the house would be foreclosed upon. In those situations where a homeowner was current on their mortgage, or had no mortgage at all, the bare minimum of judicial competence will resolve the issue in the homeowner's favor. While the homeowner may have had to hire a lawyer (although homeowners appearing on their own in this circumstance are likely to be given a great deal of deference by judges), but aside from that there is no economic harm. And of course, if a house without a mortgage or a current mortgage were foreclosed upon, you can expect that the media would be only too happy to publicize the case, with predictable immediate results.
In short, the legal issue, while potentially large in the judicial and possibly even criminal sense, is almost certainly not going to have a significant economic impact.
The second portion of Foreclosuregate are the economic issues. Generally, there are two parts to this impact. The first is whether there will be clouds upon the title of thousands if not milions of properties, because of the possibility that the wrong party plaintiff foreclosed upon the property. The second issue is that of "putbacks" -- where, because the originator failed to live up to its covenants when it sold and securitized the mortgages, ginormous amounts of bazillions of dollars in transactions are "put back" to the originator, which is frequently a large Wall Street entity, which means it is insolvent and so Wall Street is insolvent and We're All DOO ... !!!
(Oh, sorry, sometimes I get ahead of myself in all the excitement.)
Let's look at each of these in turn.
The "cloud upon title" issue simplifies to this: Bank A was the rightful owner of the mortgage note, but Bank B erroneously or fraudulently foreclosed on the property. Innocent Buyer C thinks they own the property free and clear when along comes Bank A who says, not so. Faced with perhaps tens if not hundreds of thousands of properties falling into this category, the title insurance system freezes up, and nobody will buy a foreclosed property.
Except it is not unreasonable for a legislature or a court to ask Bank A, "Did you record your mortgage note at the courthouse? You didn't??? Well then, if you couldn't be bothered, we can't be bothered either. You have no rights against Innocent Buyer C, but only a cause of action against Bank B." This solution is so obvious that I have to think courts and legislatures will immediately adopt it if and when the "cloud upon title" issue ever becomes significant.
The "putback" issue is potentially much more serious. If originators in wholesale fashion violated their conenant with the buyers of mortgage backed securities to ensure that the securities were as represented, then the possibility exists of tens or hundreds of billions of dollars worth of securities being forced down the gullet of some very big and very vulnerable banks.
But again, this is subject to legislative action and judicial interpretation. For example, Judges can impute a duty of "due diligence" to the allegedly sophisticated buyers, and refuse putbacks if they failed to verify the status of the goods they were buying. Legislatures or the Judiciary could also by law or decision impute a Statute of Limitation or Doctrine of Laches to putback covenants. For example, if Congress were to pass a law interposing a 4 year Statute of Limitations for private lawsuits to enforce putback covenants (meaning that, if you failed to assert your rights within 4 years of the execution of the contract, your right has expired and no longer exists), then no covenants from 2006 or before would be at risk (although in my example criminal actions, and actions by the state and federal governments could still be undertaken). Even without legislative action, a court could accomplish the same thing via the equitable doctrine of Laches (simply put, you slept on your rights).
Even without any legislative or judicial action, you can expect that both sides to any putback action will arm themselves with batteries of lawyers and accountants, and ultimately make a dollars-and-cents decision about settlement, potentially after years of litigation. In other words, there are an awful lot of factors militating against the worst case scenario.
Finally, for the worst case scenario to unfold, Congresscritters and Presidential candidates who have scored $$$ Millions in grift - er, donations - from the financial industry would have to decide to, figuratively speaking, "let it burn," regardless of the impact on the economy. Now, it is one thing to accuse them as being dumb as toast or even malicious - as they have already proven a number of times this year - but it is another thing entirely to expect them to act to destroy their campaign contributors.
In summary, Foreclosuregate has the potential to be a financial catastrophe - but only if a lot of poor choices, chiefly political and judicial, are made. Or it could have the economic impact of a mild nuisance. Or somewhere in between. There is no data, only opinions, and as the saying goes, just like a*******, everybody has 'em.
How will it turn out? I don't know. And neither do the people loudly and hysterically proclaiming DOOM!
Industrial Production Unchanged
I didn't get to this last week, but wanted to go into detail now while I've got time:
From the Federal Reserve:
Let's look at some smaller components of the index:
First, notice there were big increases in the consumer non-durables number, and that increase was due to large increased in auto and housing related appliance production. In addition, consumer non-durable goods also saw increase, which were masked by the fall in energy production.
Let's look at this data from another perspective:
From the Federal Reserve:
Industrial production was unchanged in October after having fallen 0.2 percent in September. For the manufacturing sector, output gained 0.5 percent in October after having risen 0.1 percent in September. Factory production in September was initially reported to have decreased 0.2 percent, but incoming data on steel, fabricated metal products, machinery, and chemicals helped boost the index. The output of utilities dropped 3.4 percent in October, as unseasonably warm temperatures reduced demand for heating. Production at mines fell 0.1 percent. At 93.4 percent of its 2007 average, total industrial production in October was 5.3 percent above its year-earlier level. The capacity utilization rate for total industry was flat at 74.8 percent, a rate 6.6 percentage points above the low in June 2009 and 5.8 percentage points below its average from 1972 to 2009.Notice that a big reason for the neutral was a a 3.4% drop in utilities, caused by warm weather. Also note that manufacturing increased .5% and September's number had stronger inputs from other manufacturing components.
Let's look at some smaller components of the index:
The output of consumer goods was unchanged in October. The production of consumer durables rose 0.8 percent. Within durables, the indexes for automotive products and for appliances, furniture, and carpeting each increased 1.1 percent. Gains in the production of miscellaneous goods and of home electronics were smaller, at 0.2 percent and 0.3 percent, respectively. The production of nondurable consumer goods declined 0.2 percent; a fall of 3.2 percent for the energy category, which primarily resulted from a decrease in the index for residential utilities, more than offset an increase of 0.7 percent for the non-energy category. Within non-energy nondurables, the index for clothing advanced 2.0 percent, and the indexes for foods and tobacco and for chemical products moved up at lesser rates; the index for paper products moved down.
First, notice there were big increases in the consumer non-durables number, and that increase was due to large increased in auto and housing related appliance production. In addition, consumer non-durable goods also saw increase, which were masked by the fall in energy production.
Let's look at this data from another perspective:
Production in manufacturing rose 0.5 percent in October, and the factory operating rate moved up to 72.7 percent, a rate 6.5 percentage points below its average from 1972 to 2009. The output of durable goods increased 0.9 percent, with increases in most major categories. After having declined the previous four months, the output of wood products jumped 2.5 percent; the indexes for nonmetallic mineral products and for electrical equipment, appliances, and components also increased by 2.0 percent or more. Within durable manufacturing, only the index for primary metals fell, at a rate of 0.4 percent.The production of nondurable goods moved up 0.2 percent in October after having risen 0.4 percent in September. The output of apparel and leather increased by the largest proportion, and the production of food, beverage, and tobacco products, of paper, and of plastics and rubber products also rose. The indexes for printing, for petroleum and coal products, and for chemicals declined. The index for other manufacturing (non-NAICS), which consists of publishing and logging, was unchanged after having declined in the previous four months.
Mining production edged down 0.1 percent in October, and its utilization rate fell to 87.9 percent, a rate 0.5 percentage point above its average from 1972 to 2009. The index for utilities dropped 3.4 percent; the output of electric utilities declined for a third consecutive month, while the output of natural gas utilities fell for a second month in a row. The operating rate for utilities decreased 2.8 percentage points, to 76.6 percent.
Notice again the large number on increases that exist in the index -- and both durable and non-durable manufacturing increased overall. The main drawback was a drop in utilities production and not goods.
China is Holding Up Loan Growth
A quick note: I'm traveling this week, and the computer I brought has now taken one trip to many. Keeping multiple programs open at the same time (like Firefox and Quote Tracker) is a bit dicey. So, for the next two days, there won't be a Yesterday's Market piece. That will be back on Monday.
From Bloomberg:
From Bloomberg:
China’s biggest banks are close to reaching annual lending quotas and plan to stop expanding their loan books to avoid exceeding the limits, according to four people with knowledge of the matter.Industrial & Commercial Bank of China Ltd., Bank of China Ltd. and Agricultural Bank of China Ltd. are only extending new loans as existing ones get repaid, the people said, speaking on condition of anonymity. Lenders are also cutting holdings of discounted bills to make room for longer-term debt, they said.
Regulators are monitoring banks’ loan balances on a daily basis to ensure the official target of 7.5 trillion yuan ($1.1 trillion) in new lending for 2010 isn’t exceeded, the people said. China’s government in the past month stepped up a campaign to limit credit expansion after inflation quickened and property prices surged.
The Chinese central bank has been very good at using various monetary tools at its disposal. They have been especially good at using various bank policies -- reserve requirements, loan quotas, etc. -- as a way of targeting smaller segments of the economy without slowing down the rest of the economy too much.
This has important implications for the U.S. as China is basically the driver of the world economy now; the U.S. is essentially the caboose. Also note the Chinese market is now a leading indicator of U.S. economic and market activity.
Monday, November 22, 2010
Ireland Gets Bailed Out
From Bloomberg:
There are a few points that should be made here.
1.) Ireland tried austerity. I've linked (several times) to the NY Times article on the topic. What's illustrative is that austerity is a essentially cutting off your nose to spite your economic face. Government spending is part of the GDP equation (which is C+I+X+G). You can't lower a part of the equation and expect to get growth; it simply violates the basic concepts of additive math.
But most importantly, government spending can help the economy grow with expenditures like infrastructure, education and social safety net expenditures (which have a high multiple). The idea behind government spending in a downtrend is to 1.) limit the downside damage, and 2.) provide investment to enable the economy to start growing sooner and preferably at a faster pace. Ideally, the government spends appropriately and in a manner that allows the economy to grow its way out of the debt. BTW -- corporations do this all the time.
2.) Despite the politicking involved with this (will they take the deal, won't they take the deal, what will the deal look like) it should come as no surprise that Ireland eventually asked for help and it was eventually given. Allowing a sovereign to declare bankruptcy or fall apart would have catastrophic implications for the economy going forward.
3.) This should be euro positive and dollar negative.
Ireland applied for a bailout to help fund itself and save its banks, becoming the second euro member to seek a rescue from the European Union and the International Monetary Fund.
Irish Prime Minister Brian Cowen said he expects talks on the package to be completed in the “next few weeks.” Finance Minister Brian Lenihan said the loan will be less than 100 billion euros ($137 billion), though he refused to give any further details at a press conference in Dublin today.
“A small sovereign like Ireland faced with an outsized problem that we have in our banking sector, cannot on its own address all those problems,” Lenihan said. Ireland may not draw down on the entire loan, he said.
There are a few points that should be made here.
1.) Ireland tried austerity. I've linked (several times) to the NY Times article on the topic. What's illustrative is that austerity is a essentially cutting off your nose to spite your economic face. Government spending is part of the GDP equation (which is C+I+X+G). You can't lower a part of the equation and expect to get growth; it simply violates the basic concepts of additive math.
But most importantly, government spending can help the economy grow with expenditures like infrastructure, education and social safety net expenditures (which have a high multiple). The idea behind government spending in a downtrend is to 1.) limit the downside damage, and 2.) provide investment to enable the economy to start growing sooner and preferably at a faster pace. Ideally, the government spends appropriately and in a manner that allows the economy to grow its way out of the debt. BTW -- corporations do this all the time.
2.) Despite the politicking involved with this (will they take the deal, won't they take the deal, what will the deal look like) it should come as no surprise that Ireland eventually asked for help and it was eventually given. Allowing a sovereign to declare bankruptcy or fall apart would have catastrophic implications for the economy going forward.
3.) This should be euro positive and dollar negative.
Initial Jobless Claims vs. Payrolls -- where to next?
- by New Deal democrat
Fourteen months ago, I wrote that
With initial claims finally falling below 440,000 in three of the last four weeks, on Friday I posted this graph, showing initial jobless claims in blue, left scale, and private nonfarm payrolls, inverted, in red, right scale :
Over the weekend, I decided to take a little more sophisticated look at what might be in store if jobless claims are truly breaking out to the downside, and continue to decline to 400,000 or even less, which seems increasingly likely as real retail sales in the last four months have grown at a rate of 10% annualized.
Exactly as I did in my analysis last year, I am comparing this jobs recovery against the job recoveries from the two least severe recessions (1974 and 1982) and using that as the template.
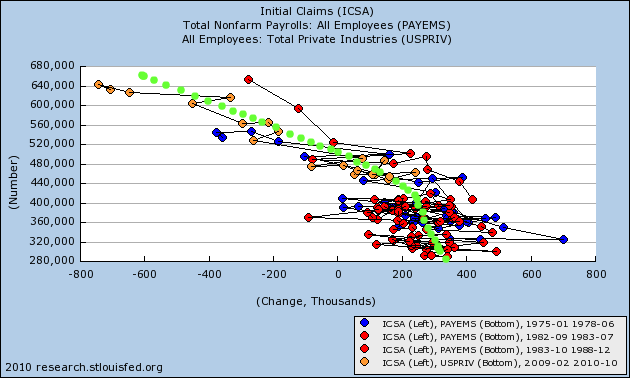
Here is a scatter graph comparing the decline in initial jobless claims from peak to trough (y axis) following the 1974 recession with nonfarm payrolls (x axis):

Here is the same scatter graph for the jobs recovery from the peak of the 1982 recession (note I have deleted two months in 1983 where a strike caused a loss of 1 million jobs in one month and a similar gain the next when the strike ended):

Here is the same graph for our jobs recovery so far (note I am using private jobs only to eliminate distortions due to the census):

Putting the three jobs recoveries together, here is the scatter graph we get:

Focusing on that part of the graph that only shows the correlation of payrolls for jobless claims under 450,000 gives us this:

While I don't have the software to do this scientifically, the trend line averaging the data from the three jobs recoveries is probably very close to the curved trend line I have drawn in light green:
This suggests that at a monthly average of 440,000 initial jobless claims a week, the average monthly payrolls gain is about 175,000 to 200,000, and gradually increases as initial jobless claims decrease. But there is an awful lot of variance, so that - as the graph immediately above the last one shows - at until such time as jobless claims drop below 360,000, even excepting a few outliers, any given month may give a number as low as ~75,000 or as high as ~350,000.
Fourteen months ago, I wrote that
Some time ago, Prof. Brad DeLong of Berkeley, thinking aloud with graph, drew a line across the 1991 and 2001 recessions and recoveries, making a "note to self" that it appeared that Initial Jobless Claims post those recessions had to decline to 400,000 or less before payroll jobs were added. Thus, mused Prof. DeLong, it must be so as well, post this "Great Recession." This "note to self" was subsequently repeated by Bill McBride at Calculated Risk, from which it has now been picked up and repeated at Prof. James Hamilton's site, Econbrowser....Well, we know how that turned out, enabling me to do a little victory dance in March.
IT IS WRONG.
....
I am utterly confident that there will be job growth long before jobless claims fall to 400,000.
With initial claims finally falling below 440,000 in three of the last four weeks, on Friday I posted this graph, showing initial jobless claims in blue, left scale, and private nonfarm payrolls, inverted, in red, right scale :
Over the weekend, I decided to take a little more sophisticated look at what might be in store if jobless claims are truly breaking out to the downside, and continue to decline to 400,000 or even less, which seems increasingly likely as real retail sales in the last four months have grown at a rate of 10% annualized.
Exactly as I did in my analysis last year, I am comparing this jobs recovery against the job recoveries from the two least severe recessions (1974 and 1982) and using that as the template.
Here is a scatter graph comparing the decline in initial jobless claims from peak to trough (y axis) following the 1974 recession with nonfarm payrolls (x axis):
Here is the same scatter graph for the jobs recovery from the peak of the 1982 recession (note I have deleted two months in 1983 where a strike caused a loss of 1 million jobs in one month and a similar gain the next when the strike ended):
Here is the same graph for our jobs recovery so far (note I am using private jobs only to eliminate distortions due to the census):
Putting the three jobs recoveries together, here is the scatter graph we get:
Focusing on that part of the graph that only shows the correlation of payrolls for jobless claims under 450,000 gives us this:
While I don't have the software to do this scientifically, the trend line averaging the data from the three jobs recoveries is probably very close to the curved trend line I have drawn in light green:
This suggests that at a monthly average of 440,000 initial jobless claims a week, the average monthly payrolls gain is about 175,000 to 200,000, and gradually increases as initial jobless claims decrease. But there is an awful lot of variance, so that - as the graph immediately above the last one shows - at until such time as jobless claims drop below 360,000, even excepting a few outliers, any given month may give a number as low as ~75,000 or as high as ~350,000.
Yesterday's Market

There are two important trend lines in the short term market: (a) -- which prices have clearly broken and (b), which prices have also broken.

Over the last approximately one week, notice that prices have printed mostly down days (a) with several gaps lower. While prices have broken the downtrend (b), they have done so on fairly weak volume (c).

On Friday, prices dropped at the open (a), found support at previous lows (b) but rallied from those lows and moved higher for the rest of the day (c). Also notice that prices printed some strong gains at the end of trading on increasing volume.
However, the daily chart still looks like prices are going to consolidate for the next bit of time.

The Treasury market has also had a big sell-off over the last 10 days. Notice the three strong bars lower and two gaps lower. This is indicative of investors dumping shares.

Also note that prices have broken support line (a).

The dollar -- which caught a safety bid from the EU situation -- broke its uptrend on Thursday. With the news that Ireland will accept a bailout, this trend should continue.
Subscribe to:
Posts (Atom)