Saturday, June 18, 2016
Weekly Indicators for June 13 - 17 at XE.com
- by New Deal democrat
My Weekly Indicators post is up at XE.com. A few things deteriorated slightly this weei, and several improved slightly.
Friday, June 17, 2016
The consumer is still all right
- by New Deal democrat
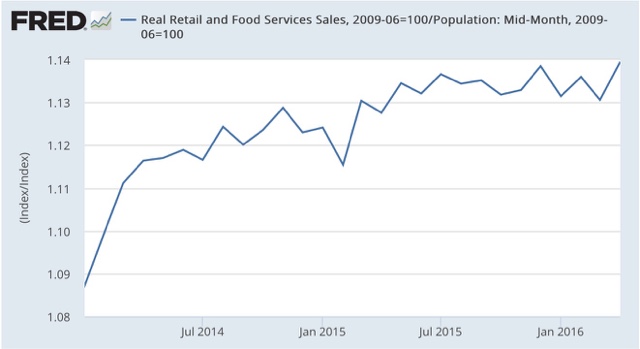
With May's CPI reported, I can now update real retail sales and real retail sales per capita. The former is a short leading indicator, the latter a longer leading indicator. To cut to the chase, here they are:

Both have set new highs.
While there are lots of production-side metrics that are consistent with recession, like industrial production, manufacturer's sales, and the inventory to sales ratio, the consumer side of the economy continues to be doing OK.
Wednesday, June 15, 2016
Whither the shallow industrial recession?
- by New Deal democrat
I have a new post up at XE.com, examining yesterday and today's manufacturing and production data. The bad news is, industrial production manufacturing stunk. The good news is, it is still above March's low, and every other piece of data is pointing the shallow industrial recessioin ending.
Tuesday, June 14, 2016
Final business and retail sales add to evidence suggesting shallow industrial recession has bottomed
- by New Deal democrat
Today began a 3 day blizzard of manufacturing and sales data spanning April to June. This morning we got total business sales for April and retail sales for May. Tomorrow we get May industrial production and the June Empire State Index. On Thursday the June Philly Fed Index will be reported.
I'll just briefly note that we need to wait for tomorrow's inflation report before we know what May real retail sales were. *If* the CPI is in line with +0.3% expectations, then real retail sales for May will set another record -- another indication that the consumer economy is OK and we are not on the cusp of any recession. Here are real retail sales per capita through April:
I'll just briefly note that we need to wait for tomorrow's inflation report before we know what May real retail sales were. *If* the CPI is in line with +0.3% expectations, then real retail sales for May will set another record -- another indication that the consumer economy is OK and we are not on the cusp of any recession. Here are real retail sales per capita through April:
This morning's April business sales report showed that total Business inventories rose +0.1%, but sales grew a strong 0.9%. Sales at all levels -- Retail, wholesale and manufacturing -- grew, and only wholesale inventories increased, while retail and manufacturing inventories shrank, as shown in the table below:

As a result, the total business inventory to sales ratio declined:

This pattern of increased sales and decreasing inventories is what happens just after a recovery from a recession starts. It adds to the evidence that March was the bottom of the shallow industrial recession. But the acid test will be the industrial production report tomorrow.
Bonddad Tuesday Linkfest
The Yield Curve Spread Points to Slow Growth
The 30-2 year spread is Near a 5-Year Low

The 10-2 year spread is Near a 5 Year Low

The productivity slowdown has often been called a “puzzle”, because it has coincided with a period of rapid technological change in the internet sector. I am not sure that this is really a “puzzle”. Many of the obvious benefits of the internet revolution appear to increase human welfare without leading to increases in market transactions and nominal GDP [1]. Furthermore, there are several other plausible reasons for the productivity slowdown, including low business investment and a loss of economic dynamism since the financial crash [2].

Monday, June 13, 2016
A note on personal withholding taxes
- by New Deal democrat
Last Friday I wrote a piece dissecting the latest graph in Doomer porn, which purported to show that personal withholding taxes paid had fallen to a meager +0.1% YoY. Since both the Daily and Monthly Treasury Reports are public and online, it didn't take long to debunk that claim.
But just to be sure, I asked Matt Trivisonno, who at his blog Daily Jobs Update has tracked withholding tax payments for the last decade, to double-check my work.
Normally, Matt charges for a subscription to the most current reports, but in this case he didn't simply verify my calculations, he sent me a graph that is completely up to date, and gave me permission to post it. So here it is:

Measured on a rolling basis YoY, withholding taxes paid over a 3 month period have generally decelerated since midyear 2015, but have remained relentlessly positive -- and have rebounded to 4.11% by Matt's calculation as of last week.
I can only assume -- since the source of the graph, Evercore, hasn't published any links to or descriptions of their data -- that somewhere in the Monthly Treasury Report is some series that is only up +0.1% YoY. But what I can say with great confidence that it isn't personal withholding taxes paid.
Bonddad Monday Linkfest
I don't remember the source, but several years ago I remember reading that a Chinese official stated he only looked at the growth of Chinese electricity demand to determine the country's "real" growth rate. Assuming that's an accurate statement, then China's growing far slower than the official statistics suggest:


Subscribe to:
Posts (Atom)