- by New Deal democrat
May monthly data reported this past week was dominated by yet another tepid jobs report of +175,000 with a slight increase in the unemployment rate due to more people entering the labor force. Average hourly earnings barely increased, so real earnings probably fell slightly for the month. The ISM reported that manufacturing contracted slightly, which services expanded at slightly better rate. Auto sales increased slightly for the month, but have been flat over a 6 month period. April factory orders also increased, but have also been flat for a 6 month period. Consumer credit increased. In the rear view mirrow, in the first quarter productivity increased, and unit labor costs fell sharply but only partially reversing a huge spike in the fourth quarter due to income being shifted forward into that quarter.
Let's start this week's look at the high frequency weekly indicators by focusing on employment metrics, which have become decidedly mixed:
Employment metrics
American Staffing Association Index
- 92 down -2 w/w, down -0.5% YoY
- 346,000 down -8,000
- 4 week average 352,500 up 5,500
- $147.5 B for the last 20 reporting days vs. $138.8 B last year, up $8.7 B or +6.3%
Transport
Railroad transport from the AAR
- +4300 or +1.6% carloads YoY
- -3300 or -2.0% carloads ex-coal
- +5800 or +3.7% intermodal units
- +12,000 or +2.5% YoY total loads
- Harpex up 3 to 401
- Baltic Dry Index up 3 to 812
Consumer spending
- ICSC +1.9% w/w +4.3% YoY
- Johnson Redbook +2.9% YoY
- Gallup daily consumer spending 14 day average at $92 up $19 YoY
Housing metrics
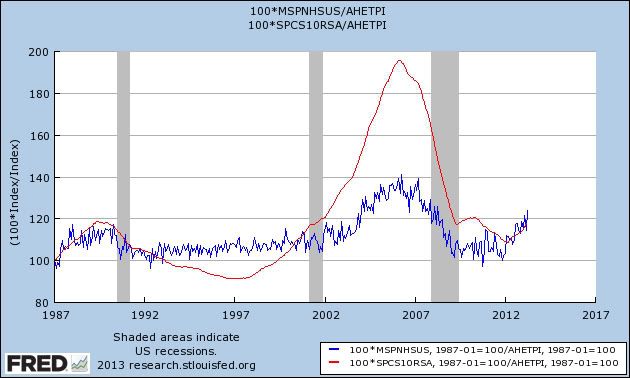
Housing prices
- YoY this week +6.9%
Real estate loans, from the FRB H8 report:
- unchanged w/w
- up +0.6% YoY
- +2.2% from its bottom
Mortgage applications from the Mortgage Bankers Association:
- -2% w/w purchase applications
- +14% YoY purchase applications
- -15% w/w refinance applications
Interest rates and credit spreads
- 4.90% BAA corporate bonds up +0.12%
- 2.14% 10 year treasury bonds up +0.15%
- 2.76% credit spread between corporates and treasuries down -.03%
Money supply
M1
- +0.4% w/w
- -1.2% m/m
- +13.3% YoY Real M1
M2
- +0.1% w/w
- +0.3% m/m
- +5.7% YoY Real M2
Oil prices and usage
- Oil $96.03 up $4.06 w/w
- Gas $3.65 up +$0.01 w/w
- Usage 4 week average YoY -0.8%
Bank lending rates
- 0.24 TED spread down -.01 w/w
- 0.192 LIBOR down -0.002% w/w
JoC ECRI Commodity prices
- down -0.02 to 124.82 w/w
- +7.37 YoY
Temp staffing is becoming a larger concern as it declined again and remains below last year's rate. Also negative this week were mortgage refinancing and treasury bonds, reflecting the bond selloff. Real estate loans, commodities, and shipping were neutral. Gas usage remains negative but may continue to reflect increased efficiency. Gas prices increased sharply but we haven't moved into a constrictive price range yet. After having their best week in months last week, this week tax withholding had its worst comparison in months. Averaged out the two weeks are lukewarm.
The biggest positive remains very strong consumer spending. Positives included house prices, YoY purchase mortgage applications, money supply, and overnight bank rates. The spread between corporate and treasury bonds contracted. Weekly jobless claims improved. Rail had a very good week. It has been decidedly mixed over the last few months.
Last week I said that for me to be sold that the data is actually rolling over, I would want to see a sustained increase in jobless claims and a sustained deterioration in consumer spending. That wasn't happening as of last week, and it certainly didn't happen this week either. The economy still seems to be moving forward - but in first gear.
Have a nice weekend.


