Saturday, May 8, 2021

Weekly Indicators for May 3 - 7 at Seeking Alpha


 - by New Deal democrat

My Weekly Indicators post is up at Seeking Alpha.

YoY comparisons remain ridiculous, so seasonally adjusted data, plus comparisons with 2019 where available are more informative.

That being said, all of the coincident and short leading indicators point towards continued strong expansion. The longer leading forecast is much murkier, partly because of some sharp movements in interest rates, and partly because the pandemic, the provision of enhanced unemployment benefits, and filling in jobs lost during the pandemic are in a race with one another.

As usual, clicking over and reading will bring you up to the virtual moment as to what is happening in the economy, and bring me lunch money for school.

Friday, May 7, 2021

April jobs report: well, that was a big miss .... but look at the composition


 - by New Deal democrat

HEADLINES:
  • +266,000 million jobs added: 218,000 private sector plus 48,000 government. The alternate, and more volatile measure in the household report indicated a gain of 328,000 jobs, which factors into the unemployment and underemployment rates below.
  • U3 unemployment rate rose 0.1% to 6.1%, compared with the January 2020 low of 3.5%.
  • U6 underemployment rate declined 0.3% to 10.4%, compared with the January 2020 low of 6.9%.
  • Those on temporary layoff increased 88,000 to 2,114,000.
  • Permanent job losers increased 97,000 to 3,529,000.
  • February was revised upward by 68,000, while March was revised downward by 146,000, for a net loss of 78,000 jobs compared with previous reports.
Leading employment indicators of a slowdown or recession

I am still highlighting these because of their leading nature for the economy overall.  These were almost uniformly negative, their worst performance in a year: 
  • the average manufacturing workweek was unchanged at 41.6 hours. This is one of the 10 components of the LEI.
  • Manufacturing jobs declined 18,000. Since the beginning of the pandemic, manufacturing has still lost -515,000, or 4.0% of the total.
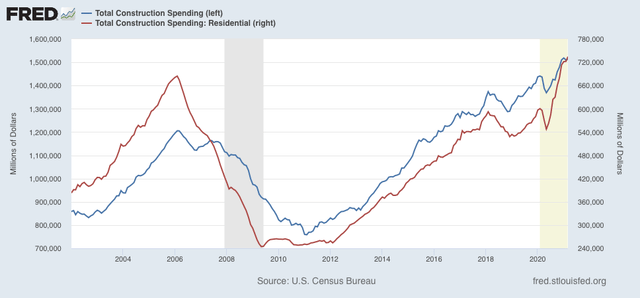
  • Construction jobs were unchanged. Since the beginning of the pandemic,  -14,000 construction jobs have been lost, or 0.2% of the total.
  • Residential construction jobs, which are even more leading, declined by 1,300. Since the beginning of the pandemic, there have still been almost 30,000 in gains in this sector.
  • temporary jobs decreased by 111,400. Since the beginning of the pandemic, there have still been 184,800 jobs lost, or 6.3% of all temporary jobs.
  • the number of people unemployed for 5 weeks or less rose fell by 79,000 to 2.414 million, 332,000 more than just before the pandemic hit.
  • Professional and business employment declined by 79,000, which is still 685,000, or about 3.2%, below its pre-pandemic peak.

Wages of non-managerial workers
  • Average Hourly Earnings for Production and Nonsupervisory Personnel: rose $0.20 to $25.45, which is a 1.2% YoY gain***WHICH IS THE LOWEST YOY GAIN IN THE ENTIRE NEARLY 60 YEAR HISTORY OF THIS SERIES.*** This is a huge reversal of the 5%+ YoY gains recently seen, and reflects the rehiring of low-wage workers in sectors like food and beverage serving. 

Aggregate hours and wages:
  • the index of aggregate hours worked for non-managerial workers was unchanged, which is a  loss of -3.6% since just before the pandemic.
  •  the index of aggregate payrolls for non-managerial workers rose by 0.7%, which is a gain of 1.4% since just before the pandemic.

Other significant data:
  • Full time jobs gained 935,000 in the household report.
  • Part time jobs declined 54,000 in the household report.
  • The number of job holders who were part time for economic reasons decreased by 583,000 to 5.243 million, which is an increase of 845,000 since before the pandemic began.

SUMMARY

Needless to say, this was a very disappointing report compared with all of the employment-related indicators we have seen in the past few weeks. My main thoughts are that (1) this was compositional; and (2) there is likely to be a substantial revision.

Usually when there is one report that sticks out like a sore thumb compared with other related data, it gets revised significantly. This is particularly so when one looks at the composition of the gains and losses in this report. Consider the following two points:

- there were job gains in food and drinking establishments of 187,000, over 2/3’s of the entire month’s improvements.
- the entire goods-producing sector of the US economy - which has been at very least red hot in the past few months - *lost* 16,000 jobs! This includes job losses in residential construction (housing), which has been going through the roof in recent months.

Another anomaly is that those unemployed less than 5 weeks, which usually correlates fairly closely with initial jobless claims, *increased* by 237,000; plus, both permanent and temporary layoffs *increased*  - a direct contradiction to the big decline in new jobless claims in the past 6 weeks.

Another big compositional change was the big decline in temporary jobs, paired with a huge increase in full time employment. This suggests that previous temps were converted to permanent hires.

Finally, note that the YoY% increase in average wages completely reversed, and made an all-time series low (although still positive).

So, basically, either (1) bottlenecks in supplies caused a complete halt in the goods producing sector including both manufacturing and construction; plus there was an anomalous contraction in professional and business services; or (2) there will be substantial upward revisions to those aspects of the report. I am more inclined to believe that #2 is the primary driver of this relatively poor report than #1.

Thursday, May 6, 2021

New jobless claims: 1st target achieved!


 - by New Deal democrat

New jobless claims continue to be the most important weekly economic datapoint, as increasing numbers of vaccinated people and outdoor activities have led to an abatement of the pandemic - new infections are the lowest in 9 months, and deaths are at their lowest point in a year. 

Eight weeks ago I set a few objective targets for new claims: to be under 500,000 by Memorial Day, and below 400,000 by Labor Day. Subject to revisions, this week we hit the first target, as seasonally adjusted claims declined 92,000 to 498,000. 

On a unadjusted basis, new jobless claims declined 107,390 to 504,670. The 4 week average of claims also declined by 61,000 to 560,000. All of these were new pandemic lows.


Here is the trend since last August: 


To put these in perspective, last year in March and April we were seeing news claims on the order of 6 million to 7 million per week! On the other hand, the current level of claims was typical of recessions in the 50 years prior to the pandemic:


Continuing claims, which are reported with a one week lag, and lag the trend of intitial claims typically by a few weeks to several months, rose slightly off last week’s pandemic lows. On an unadjusted basis, they rose 2,533 to 3,786,096, while after seasonal adjustment they increased 37,000 to 3,690,000:


The long term perspective again shows that these are equivalent to the worst levels of most previous recessions:


Tomorrow I expect the April jobs report to show a gain of well over 1,000,000 jobs, and possibly closer to 2,000,000. And because this week’s jobless report will be part of May’s reference period for jobs, it bodes well as a starting point for next month as well.

Wednesday, May 5, 2021

The long leading indicator of credit conditions has just been updated by the Fed


 - by New Deal democrat

The easing or tightening of credit conditions has a good track record as a long leading indicator, giving us information about whether the economy will be expanding or contracting in 12+ months.

The Fed just updated its Senior Loan Officer Survey for Q1, which covers both the easing or tightening of credit supply on the one hand, and demand for credit on the other. I have a report on this over at Seeking Alpha, discussing its implications for the next year.

As usual, clicking over and reading brings you valuable new information, and rewards me just a little bit for my efforts.

Tuesday, May 4, 2021

Coronavirus dashboard for May 4: Keep the faith; vaccinations work!


 - by New Deal democrat

While there has been some renewed DOOOMishness in the press about whether the US will ever reach “herd immunity” or not, I remain more sanguine.


Here’s the overall picture of cases and deaths from the past 12 weeks (note: the wintertime peaks no longer show in this close-up):


The incipient “4th wave” has already receded, and deaths have continued to very slowly decline. Both cases and deaths are now 80% below their peaks.

Both cases and deaths have also all but vanished among the heavily vaccinated senior citizens:


COVID is now, relatively speaking, a young person’s disease. The one item of real concern is the decided increase in cases among those aged 14-17, suggesting that reopening schools in the face of new variants that transmit much more easily and are more infectious to young people was a terrible mistake. Hopefully approval of the vaccines for teenagers, apparently to happen shortly, together with summer vacation, will take care of this issue before fall classes begin.

As a percentage of the total population, people partially and fully vaccinated continue to increase:


This probably had much to do with the fizzling of the “4th wave.”

Keep in mind that we *know* that 10% of the US population has had *confirmed* COVID infections. Estimates of how high the true number of infections is, run as high as 33% of the entire population. If this group is randomly distributed between those vaccinated and those not vaccinated, then the total % of the US population with resistance to COVID is probably about 2/3’s - in short, getting pretty close to the threshold where “herd immunity” might come into play.

In other words, if a relatively small percentage of vaccine “resistors” change their minds (and there is evidence for some of that happening), and the disease continues to spread for a short while among the unvaccinated, those two occurrences alone might push us over the “herd immunity” threshold in several months.

Keep the faith!

Monday, May 3, 2021

ISM manufacturing, construction spending show modest declines, but the Boom is still ongoing


 - by New Deal democrat

It’s the first of the month, which means we get our first look at April data in the form of the ISM manufacturing index, as well as March construction spending.


Manufacturing has been running not just red hot, but white hot in the past few months. Although it pulled back a little in April, it is still in the range of historic highs:


The leading new orders index is just below 65, which is slightly below its best levels of the past year, but above every other level but 5 months in every other year going back to 2005.

The manufacturing Boom is still ongoing.

Nominally both total and residential construction spending in March made new all-time highs:


But when we deflate by the cost of construction materials, spending has actually declined since the beginning of the year:


It is still running hot compared with the last 10 years, however.

Bottom line: modest declines in both of these very leading sectors, but nothing to be concerned about at this point.