Saturday, August 27, 2011

Weekly Indicators: on the verge of a self-reinforcing downturn edition

- by New Deal democrat

Monthly data was mixed. New home sales were down slightly, but essentially have been flat all year. Durable goods orders were up by the most in 4 months, and new orders ex-defense - one of the 10 Leading Indicators - were up. This series continues to signal at least weak expansion. Final consumer confidence in July was largely unchanged from earlier in the month, but down sharply from the month before, and indeed was right back at readings not seen since the depth of the 2009 recession. The outlook for the future - another of the 10 Leading Indicators - was also sharply down. GDP for the second quarter was revised down to 1.0%, although the alternative measure of gross domestic income held up well.

The high frequency weekly indicators reflected that the emotional reaction in to the debt debacle, continuing uncertainty about the viability of the Euro, and the recent stock market plunge are on the verge of becoming self-reinforcing, and appear to be at a crossroads where any further deterioration will signal outright contraction.

This week let's begin by looking at the two items which had the biggest moves. Both continued the trend from last week and smell of panic:

Money supply -a leading indicator - continued to surge. M1 was down -0.5%, but increased 5.8% m/m, and 20.2% YoY, so Real M1 was up 16.6%. M2 increased 0.1% w/w, and also increased 2.6% m/m, and 10.1% YoY, so Real M2 was up 6.5%. The YoY increase in M1 in the last three weeks is the highest in history.

The Mortgage Bankers' Association reported that seasonally adjusted mortgage applications decreased another -5.7%, down a combined -15.8% in the last two weeks. The YoY comparison in purchase mortgages, which had been positive for two months, is suddenly strongly negative, down -7.3% YoY. Refinancing was also down -1.7% w/w and well below last year despite near record low interest rates.

Other series remained firmly in contraction this week:

The American Staffing Association Index remained at 87. This series' trend now looks just as it did in summer 2008, early in the last recession. The ASA's graph of this index shows how it has now decisively tipped out of improvement:


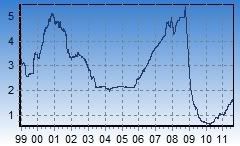
Oil finished at $85.30 a barrel on Friday. This is still about $10 below its recession-trigger level. Gas at the pump fell $.02 to $3.58 a gallon. Gasoline usage was -3.9% lower than a year ago, at 9009 M gallons vs. 9375 M a year ago. In the last few weeks, gasoline usage too has fallen to recessionary readings.

Weekly BAA commercial bond rates decreased .02% to 5.29%. Yields on 10 year treasury bonds much further, however, down .10% to 2.17%. This indicates continued fear of deflation, and also a continued significant increase in the relative distress in the corporate market. In the last two weeks, this credit spread has looked very much like an immediate precursor to recession.

Some employment related data has been improving in the last month, and several other series remained positive:

The BLS reported Initial jobless claims of 417,000. The four week average decreased to 407,500. The upturn was said to be due to that rare bird - an industrial strike (by Verizon workers). Jobless claims still remain below their recent range.

Adjusting +1.07% due to the 2011 tax compromise, the Daily Treasury Statement showed that for the first 19 days of August 2011, $120.8 B was collected vs. $118.6 B a year ago, for an increase of $2.2 B. For the last 20 days, $138.9 B was collected vs. $124.9 B a year ago, for an increase of $14.0 B, or 11.2%. With the exception of two weeks ago, withholding tax collections have rebounded strongly for the last 6 weeks.

The American Association of Railroads reported that total carloads increased 0.8% YoY, up 4400 carloads YoY to 539,200 for the week ending August 20. Intermodal traffic (a proxy for imports and exports) was up 2300 carloads, or 1.0% YoY. The remaining baseline plus cyclical traffic was up 3100 carloads, or 1.1% YoY%. Rail traffic has been oscillating between positive and negative YoY for the last 7 weeks. Using the breakdown of cyclical vs. baseline traffic that was graciously provided to me by Railfax, baseline traffic was down 3300 carloads, or -1.7% YoY, while cyclical traffic was up a strong 6400 carloads, or +6.0% YoY.

Retail same store sales continue to perform well. The ICSC reported that same store sales for the week of August 20 increased 3.0% YoY, and decreased -1.0% week over week. Shoppertrak reported a 5.0% YoY increase for the week ending August 20 and a WoW increase of 0.7%. This is the seventh week in a row of a strong rebound for the ICSC, joined for the fourth week by Shoppertrak.

Finally, continuing a real positive trend boding well for the longer term future, YoY weekly median asking house prices from 54 metropolitan areas at Housing Tracker showed that asking prices declined only -2.3% YoY. This is the smallest YoY decline since April 2007. The areas with double-digit YoY% declines remained at 6. The areas with YoY% increases in price increased by one more to 13. A few months ago only 3 or 4 areas had actual increases, and well over 10 had decreases. At the beginning of this year, only one metro area was showing a YoY increase. Now, 25% of all metropolitan areas tracked are showing YoY increases.

The continued plunge in purchase mortgage applications is especially concerning, as it shows consumers putting off big purchases due to being frozen in fear. (Incidentally, the decline in mortgage applications is probably why the ECRI index declined strongly again in the last week.) There is simply no other explanation for a 16% plunge in two weeks. That BAA bond spreads, consumer confidence about the future, and temporary staffing have joined gasoline usage in recessionary readings is also bad. At the same time, housing price stabilization, cyclical rail traffic, continued firm retail spending, and withholding taxes bode well, as does the surge in money supply for the longer term. We need to see consumer fear abate, and quickly, or the downturn will become self-reinforcing.

Friday, August 26, 2011

Thinking About Ben

So, the Fed did nothing. Don't be surprised, because, frankly, there isn't much they could actually do right now.

Consider this list of possible actions from Paul Krugman -- citing Chairman Bernanke:
Back then, Mr. Bernanke suggested that the Bank of Japan could get Japan’s economy moving with a variety of unconventional policies. These could include: purchases of long-term government debt (to push interest rates, and hence private borrowing costs, down); an announcement that short-term interest rates would stay near zero for an extended period, to further reduce long-term rates; an announcement that the bank was seeking moderate inflation, “setting a target in the 3-4% range for inflation, to be maintained for a number of years,” which would encourage borrowing and discourage people from hoarding cash; and “an attempt to achieve substantial depreciation of the yen,” that is, to reduce the yen’s value in terms of other currencies.
Let's take these in order presented:

1.) purchases of long-term government debt (to push interest rates, and hence private borrowing costs, down): The Fed has already done this, and I believe it did help to keep rates down. But right now, the market is already pricing the 10 year at 2.12%. Realistically, how much lower to rates have to go before people start borrowing? In short, I think that Ben thinks the market is already engaging in QEIII with no prodding from the Fed.

2.) "an announcement that short-term interest rates would stay near zero for an extended period:" Done -- in the last Fed statement.

3.) "an announcement that the bank was seeking moderate inflation, “setting a target in the 3-4% range for inflation, to be maintained for a number of years:" while the Fed hasn't done this explicitly, it is implicit in their statement that rates would stay low for several years.

4.) "an attempt to achieve substantial depreciation of the yen:" The dollar is already very cheap -- as evidenced by the importance of exports in the latest expansion. And -- we need trading partners to see enough growth to purchase our exports. Considering the Indian and Brazilian yield curves have completely or partially inverted recently, this might not be happening.

In short, by Ben's own statements, he's already done a lot -- more or less everything he can do.

That means all that's really left is fiscal policy. And given the current tenor in Washington, that's not going to happen.


The Washington Lobotomy Factory Proves Itself -- AGAIN

From the NY Times:

In a turning of the tax policy tables, Democrats are increasingly hammering on Republicans who oppose the president’s proposal to extend for a year a payroll tax cut passed last year with bipartisan support.

That tax cut — which reduces workers’ contributions to Social Security this year to 4.2 percent of wages, from 6.2 percent — expires in December. The White House would like to extend it for another year. But Republicans in Congress are balking, arguing that such a cut adds needlessly to the nation’s budget deficit, and should be replaced with an overhaul of tax policy instead.

“All tax relief is not created equal,” said Brad Dayspring, a spokesman for Representative Eric Cantor of Virginia, the House majority leader. “If the goal is job creation, Leader Cantor has long believed that there are better ways to grow the economy and create jobs than temporary payroll tax relief.”


And they wonder why over 80% in the country dislikes them?

Thursday, August 25, 2011

Friday Dollar Analysis

Last week, I wrote the following about the dollar:
Until the dollar moves convincingly below the 20.9 area, we're still in a trading range.
In addition, I noted on Tuesday that the dollar was nearing support levels:
The dollar has been trading in a fairly tight consolidation range for the last 4 months -- between 20.9 and 21.7. The dollar is now approaching critical support levels. Also note the technical, upside resistance the dollar faces in the form of three declining EMAs -- the 10, 20 and 50.

Later this week, Bernanke will be at Jackson Hole, where he will speak on Friday morning. I have no idea what he's going to say -- but the dollar appears to be anticipating another round of easing in one form or another. If these levels hold through Friday, I'd place stops below support.
As we approach the all important Jackson Hole meeting, the dollar is still hovering at critical levels:


The dollar is hovering above key support in the upper 20s with a very bearish EMA picture. Ben's speech will be key here.


More Thoughts and Observations on Food Inflation

While energy prices get all the headlines, food inflation does not. I don't know why that is, but it does seem to be the way of things. Today I wanted to break down food prices in more detail, because, as I noted yesterday, food prices are spiking and are probably crimping consumer spending to some degree.

First, let's review the big chart of the series:


As I observed yesterday, prices are now above a YOY percentage change of 7.5% -- a level that has traditionally indicated we're about the enter a recession. While the recent spike could be attributed to the previous decrease -- that is, because prices are rising from an incredibly low level, the percentage change is that much more pronounced -- the spike is still concerning.

According to BLS data, food prices account for 13.742 of the overall CPI. (In case you're wondering, motor fuel comprises 5.079%). Food CPI is broken down into two broad categories of food at home and food away from home. Food at home is broken down into five different categories (with their respective weighting) --

1.) cereals and bakery products (1.090%)
2.) meat, poultry, fish and eggs (1.813%),
3.) dairy and related products (.839%),
4.) fruits and vegetables (1.152%),
5.) non-alcoholic beverages and beverage materials (.926%).

Let's look at the individual components of the food at home category.


The cereals and baking goods chart shows the pronounced effect of the pre-recession food price spikes, along with the impact of rising grains prices. Remember that while grains have been moving sideways for some time, they are all still at high levels. Those prices are being reflected in the current price index of cereals.


The meat index also shows large YOY spikes, largely because of the drought in Texas and Oklahoma thinning herds and the spiking cost of grains, which are fed to cattle. The recent spike is very large and therefore very noticeable to people.


Dairy prices are also spiking, but not to the level of previous spikes, such as the two that occurred during the previous expansion.


Fruit and vegetable prices are at the top of s standard pricing pattern.


Non-alcoholic beverages are also increasing at fairy high rates -- which I have noticed in my 20 ounce diet Dr. Pepper purchases.

At the heart of the current price spikes are grain prices; they form the basis of cereal and grain prices, but also have an important impact on meat and dairy prices as grains are used in feed. To that end, consider these two charts of wheat and corn prices, both of which are 25 years in length.


Wheat saw massive spikes at the end of the last expansion, and is still at high levels, while corn is near its highest level in 25 years. As these two grains form the building blocks of out food system, these price spikes have very important ripple effects.

At the heart of the above charts is the long-term impact of two events.

1.) Using your food supply for fuel, thereby increasing overall demand.
2.) The drop in the dollar.

The former can be considered a pure political boondoggle while the latter indicates the need to move away from a single currency pricing of commodities and more towards a basket of commodities.


Not That We Actually Need to Repair Our Infrastructure

There are currently 875 water main breaks in the City of Houston. Wouldn't it be nice to repair the infrastructure of the city to actually make the city work a bit more efficiently? That's right -- that'd be a boondoggle of unnecessary spending on projects we don't need......


Wednesday, August 24, 2011

Thursday Oil Market Analysis

Last week, I wrote the following about the oil market:
Fundamentally, we're at the end of the summer driving season when US demand spikes upward. In addition, there is concern about the pace of economic expansion in the rest of the developing world, leading to less upward pressure on prices. There is also now a tremendous amount of upward resistance to price advances. There is little reason to see oil moving meaningfully higher in the current environment.
In short, prices had sold off and, at best, were consolidating at low levels, facing tremendous upside resistance. In such an environment -- barring some fundamental change in the overall economic picture -- there is little reason to see any change; that is, prices are low and there is no reason to see major movers higher.


The above daily chart of the oil market shows a bear market. Prices are below the 200 day EMA, and all the shorter EMAs are moving lower -- and are also below the 200 day EMA. The MACD shows very weak momentum. Right now, prices are consolidating in a triangle pattern.


The 5 minute chart shows prices rising in an upward sloping channel last week, starting at the 79.5 level and topping out at the 86.5 level, where they then moved sideways between 84.5 and 86.5. There is also upside resistance at the 87.5 level -- and that's before we get into issue of hitting the daily EMAs.

Prices are now under tremendous downward pressure es evidenced by the EMA picture. In addition, there is concern about overall US demand destruction in a weakening economy, along with the possibility of a slowing Asian market. In short, should oil prices start to move higher, there will be a large amount of resistance from both the fundamental and technical side.


Drought Tightens Wheat Supplies

From Bloomberg:

A yearlong drought from Kansas to Texas has created the driest conditions on record for farmers preparing to plant winter wheat, dimming crop prospects for a second straight year in the U.S., the world’s largest exporter.

Dry weather already has cut output of hard, red winter wheat, the most common U.S. variety, by 22 percent from 2010, government data show. If drought persists into the planting months of September and October, next year’s harvest will be even smaller, and prices on the Kansas City Board of Trade may jump 50 percent to $13 a bushel, said Dan Manternach, a wheat economist with researcher Doane Advisory Services in St. Louis.

In Texas, where agriculture losses from the drought were a record $5.2 billion, soil moisture is so depleted that plants may not emerge from the ground without more rain, Texas A&M University said in a report yesterday. Kansas, Texas and Oklahoma were the biggest growers of winter wheat in 2010 and supplied 28 percent of all wheat varieties produced in the U.S.

“Most of us are gamblers enough that we will plant a wheat crop,” said John Goodknight, who farms 3,500 acres in Chattanooga, Oklahoma, and saw his wheat output drop by a third this year. “We just live and work in the conditions we have. It’s exceedingly hard to make it work with drought.”

Housing and the double-dip

- by New Deal democrat

Suppose my analysis is wrong, and we actually have a "double-dip" recession? How bad is it likely to be?

I wanted to put up a much longer discussion on this, but frankly I don't have the time right now. One important point, however, is to look at housing. Housing historically has been a long leading indicator ( 6 to 12 or even 15 months ahead of the economy as a whole). Bill McBride a/k/a Calculated Risk has pointed out a number of times that he did not expect the unemployment rate to drop that much, because it correlates quite well with housing starts - with a lag - and housing starts have gone more or less sideways for two years. The relationship going back 50 years is shown in this graph:


(Note: unemployment rate is inverted, right scale, better to show the relationship)

As I have previously pointed out, housing starts also correlated very well with job growth in the 1920s and 1930s as well. But if the correlation holds true, than the inverse also holds true also. That is, if housing starts have not declined, then we should not expect the unemployment rate to grow very much in any double-dip, either. A ceiling of about 10% or so in the next 6 - 12 months on the unemployment rate based on housing present status is certainly a valid estimate.

And the housing market shows no sign of any meaningful accelerated downturn. To the contrary, new home sales data for July showed that the months of supply of houses on the market has dropped to 6.6 months. With the exception of a very brief period during the artificial support to housing of the $8000 tax credit, this is the lowest months' of housing for sale since the onset of the recession almost 4 years ago:


(courtesy Calculated Risk)

With no further goverment stimulus at all, this metric has declined by 2.5 months during the last year. It is not unreasonable at all to believe it could drop below the long-term average of 6.0 months during the next year.

This week Housing Tracker reported that YoY asking prices are only down -2.3%. One quarter of all metro areas tracked are now reporting YoY increases in asking prices.

In my opinion the bottom in nominal housing prices (as opposed to inflation-adjusted prices) is much closer than almost all analysts suspect. Once we start to get an upward trend in housing, then according to the correlation with the unemployment rate, there should be good fundamental support for job growth. Housing simply does not support a substantial double-dip.

Tuesday, August 23, 2011

Wednesday Commodity Round-Up


One of the reasons copper is such an important commodity is its correlation to the overall growth cycle. As the economy starts to heat up copper rises, largely because copper is used in practically everything. The above chart is the JJC copper ETF compared to the SPY. Notice the high degree of correlation.


On the multi-year chart, copper is hanging on by a thread to a two year trend line. In addition, note the gradual increase in volume, possibly indicating buying climax.


The above chart shows in more detail the current price action. Prices are consolidating right around the long-term trend line. All the shorter EMAs are moving lower, and the 10 and 20 day EMA have moved through the 200 day EMA. Right now, the 10 day EMA is providing upside resistance for prices, which is standard in a market environment like the one we're in now.

Are Food Prices Signaling Recession?


Above is a chart of the YOY percentage change in food prices. Notice the last five times that food prices have advanced more than 7.5% on a YOY basis a recession has followed. You could argue that this time is more like the spike which occurred after the 2000 recession, when prices advanced quickly from an incredibly low reading, which exacerbates the following spike. However, that spike could still be a reason why the early part of the last expansion was so slow (in 2002, the rate of GDP growth on a quarter to quarter basis was 3.5, 2.1, 2 and .1, respectively).

However, there is no arguing that higher food prices are clearly a current economic issue which will be putting downward pressure on consumer spending for foreseeable future. Now the question becomes, will this continue?

Here are three charts of the major grains (wheat, soy and corn):


After a strong advance, all are now moving sideways in one form or another. So while price increases have stalled, there has been little in the way of downward pressure on grain prices.

Energy price spikes get a lot of publicity; not so much for food prices. Yet the information above says food prices are crimping consumer spending with little chance for a meaningful drop in the near future.

Dollar's At Critical Support Levels


The dollar has been trading in a fairly tight consolidation range for the last 4 months -- between 20.9 and 21.7. The dollar is now approaching critical support levels. Also note the technical, upside resistance the dollar faces in the form of three declining EMAs -- the 10, 20 and 50.

Later this week, Bernanke will be at Jackson Hole, where he will speak on Friday morning. I have no idea what he's going to say -- but the dollar appears to be anticipating another round of easing in one form or another. If these levels hold through Friday, I'd place stops below support.

Monday, August 22, 2011

Treasury Tuesdays

Last week, I wrote the following about the market:
The daily chart shows a bit of a sell-off. However, prices are still above the 10 day EMA and looking to hit them for support. Also note the drop in volume. This indicates there isn't much selling (talking profit) in the current market, so traders are clearly waiting for something.
After a strong, flight for safety induced rally, the markets were moving sideways, consolidating their overall gains.


The above shows a slight upward move, but on very weak volume and with very weak bars. The EMAs are still bullishly aligned and are providing technical support.


The 5 minute charts shows the trading action in far more detail. After rising last Tuesday and Wednesday, prices are now consolidating on considerably weaker volume. Notice the tightness of the trading range -- 103.6-104.1


The technicals tell use that money is still positive , but the flat A/D tells us that traders are getting less excited about this security. However, there is still positive momentum.

Finally, consider this long-term chart:


Prices are clearly advancing over a long-term trend line on increasing volume.

Overall, the IEFS are looking over-extended in the short run; prices have moved through resistance in near parabolic fashion on high volume, largely as a safe haven play. However, there is still a great deal of concern regarding the overall economy, and the Fed is not raising rates anytime soon, so there is little downward pressure on prices right now.

The biggest thing we have to fear is, fear itself

- by New Deal democrat

In case you haven't already seen it, this video clip of CNBC anchors Jim Cramer and Simon Hobbs getting into a heated argument on-air about European banks has been going viral:


Hobbs, Cramer, and Carl Quintanilla actually seemed to be in "violent agreement." Here are a few snippets of dialogue:

Cramer:
"We have a Lehman situation"
"people are trading as if it is [a Lehman situation]"

Hobbs:
"We do not have a Lehman-like situation. We have the fear that there may be a Lehman situation at the moment."
"That is not going to happen here, at this stage" (my emphasis)
"We're not about to have a European bank hit the wall"

Quintanilla (trying to be a peacemaker):
"It may be a fat-tail risk, but it is a risk"

In other words, all three actually agree that while there is no European bank failing right now, there is a non-trivial and indeed significant chance that there could be a major European bank failure with systemic risk in the coming days/weeks/months. More to the point, Cramer says that people are trading as if that is the case.

There's one more quote I'm going to come back to, because I believe it perfectly encapsulates the situation.

But being the nerd that I am, let's go look at some pertinent data. First of all, if there were a substantial systemic risk to finance right now, then bankers should be charging more for counterparty risk, in particular when they loan other banks overnight money. It ain't happening. Here's LIBOR:


and here's EURIBOR:


As I first said a couple of weeks ago, Where's the fear? Why don't the front line troops in the trenches share the trepidation of the pinstriped strategists in the rear?

Now here is Barron's graph from Saturday's edition of insider buying vs. selling:

The ratio is down to 1:3, the lowest in a year (since the much-mocked "Hindenburg omen"). Even in 2008, when insiders trading got to this level, it always signaled at least a short term bottom (e.g., when Bear Sterns failed in March, and when Fannie and Freddie were nationalized in July), and it also marked the ultimate bottom in March 2009. So the smart money sees a buying opportunity.

Well then, what is the dumb money doing? According to the Investment Company Institute:
Investors pulled the most money from U.S. mutual funds in 14 months as stocks lost ground and Congress battled over raising the nation's debt ceiling. Mutual funds suffered $16.9 billion in withdrawals in the week ended Aug. 3, up from $9.6 billion the previous week ....
and then:
Investors pulled a net $40.3 billion out of those funds in the week ended Aug. 10, the largest weekly withdrawal since early October 2008, soon after the collapse of Lehman Brothers.
Let me return to the video above, because Cramer, refusing to back off his "this is a Lehman situation" statement, said the following, which seems to perfectly encapsulate the zeitgeist:
"I can't give false assurances because I learned my lesson .... for people not worrying that there is a Lehman situation is to run a risk of two weeks from now seeing 'Cramer said it would not be a Lehman situation.' "
In short, having been burnt in 2008, he is unwilling to take any risk of being too optimistic now. This is Pavlovian: if the stimulus looks similar to that which led to a severe shock in the past, it is resulting in behavior to attempt to absolutely ensure avoiding the shock now.

In short, "fear itself." The very same fear which appears to have caused consumer confidence to plunge to new lows. The same seizure which led to a 10% decline in mortgage applications in one week earlier this month. The same seizure that was reflected in a Philly Fed manufacturing reading that simply fell off a cliff to one of it deepest recessionary readings in 40 years.

The only piece of the puzzle that doesn't quite fit, and gives me pause is investor sentiment. Here's a screenshot of that metric from Barron's over the weekend:


It seems that there is a fair amount of "buy the dip" sentiment out there - not the true panic I would want to see at a real bottom. So perhaps we have to have a severe retest. But if the front line troops and the smart money are sanguine, and the dumb money is panicking, who do you think is more likely to be right?


Economic Week in Review

Consumer Spending: There were no reports of consequence in this area last week.

Manufacturing: The Empire State fell to -7.7 -- the third consecutive negative reading in this index. The new orders index was also negative, at -7.8 -- which, again, was the third straight negative reading. The future indexes also dropped sharply. The only good news in this index was the negative readings were just barely negative -- unlike the Philly Fed index, which dropped sharply to a reading of -30.7. The new orders component of the index dropped sharply as well. On the positive side, industrial production increased .9%, with upward revisions to the preceding months.

Prices: Producer prices increased .2% MTM, but increased 7.2% YOY. Food price increases were an issue, but energy prices dropped. The good news in the report was a third straight month of decreases in crude goods -- which is attributable to a drop in energy prices. The CPI increased .5%. The gain was attributable to increases in both gas and food at home prices.

Real Estate: Housing starts dropped 1.5% from the previous month. However, this series has been bouncing along the bottom now for about two years. Existing home sales also fell, this time by 3.5%. However, like housing starts, this data series has been moving along the bottom for about two years, save for spikes caused by the new home buyer tax credit. Both of these numbers indicate real estate is still in the tank.

The reports last week were generally very weak. Manufacturing is under continued pressure and real estate is still in poor shape. The inflation reports may be such that they box the Fed in; however, this is ultimately in the Fed's corner as to how to react. Expect more of a slowdown to occur in the economy overall.

Sunday, August 21, 2011

Equity Week in Review and Preview of the Upcoming Week/Month

Last week, I wrote the following about the market:
The good news is it looks as though the market found a temporary bottom. But we are hardly out of the woods. An upside testing of the declining EMAs is in order, followed by a retest of the 112 level. If the 112 level holds, we'll be in far better shape. But that bottom is new and still very tenuous. Any rally should be considered suspect until we see prices advance through the 200 day EMA. Any move below the 112 area should be shorted.
In short, the market was trying to stabilize in some form after an extremely tumultuous trading situation over the last few weeks. Let's take a look at the charts to get an idea for what happened.


The above chart is a daily chart. Notice we can break the candle action down into two different periods. The first occurred during the sell-off; the bars were very strong (the bodies were long) and volume was increasing, indicating more people were getting out of the market, adding to downward pressure. Last week, we see an attempted rally with small bodies that hit resistance at the 10 day EMA. But the bodies are weaker and the volume is decreasing, indicating there isn't a lot of excitement for the rally. At the end of last week, there was an increase in volume on the downward moves, but the moves stabilized a little about 112.

The EMA picture is extremely bearish: all the shorter EMAs are moving lower, prices are below all the EMAs and the shorter EMAs are below the 200 day EMA. This creates a tremendous amount of upward resistance in the event of a rally.


The 5-minute chart shows shows three advances to the 120.5/121 area in the early part of last week, only to be rebuffed. However, despite a strong gap down on Thursday AM, there was little downside follow-through at the end of the week. Instead, the markets found support a little above the 112 area, which is a technically important development. If the market holds at these levels and then advances, an important, quick-forming double bottom will have formed, from which the market can move higher.


Also note the other averages have hit important areas of technical support, adding further strength to the SPYs attempt at forming a bottom last week.

This is still not a market to go long in. The technical indicators are decidedly negative and there is concern about the economy. However, I wouldn't go short unless the market breached recently reached bottoms.


Weekend rant: the triumph of the Know-Nothings

- by New Deal democrat

It isn't just the right wing teabaggers whose know-nothing, "keep the government out of my Medicare" worldview is ascendant. On the left, it's pretty clear that a large part of the activist base wants no part of actual, you know, facts.

Last Wednesday the Pied Piper of Doom told his acolytes that:
What if ”they” told you that many, if not most, of the “official” economic numbers that have been hyped by our government and our private sector over the past few years—the very core statistics that form the faux “basis” of our society’s so-called, “professional” and pundit class’ economic analyses and the same numbers which are at the heart of our nation’s MSM reports on our economy, which then create the public’s perception about it, and our government’s response to it—have recently been proven to be so incredibly and grossly distorted in favor of Wall Street, that it’s now basic FACT that they were little more than corporatist hyperbole?

... the BEA, in Q1 ’11, screwed the pooch on what is, arguably, the single most important statistical indicator (and, certainly the most inherently flawed) of our economy, the Gross Domestic Product (GDP) ....
....
Unfortunately, this latest “chapter” in the story of the curtain being pulled back on the truth about our distorted economic “news” won’t be the last we hear of this propaganda travesty.

Stories of economic mis- and disinformation account for most of the “statistics” that we read and hear in the MSM concering our nation’s financial services sector, on a daily—if not hourly—basis, too.
Quelle surprise! The first estimate of quarterly GDP is ... an estimate! Beyond that, most of our economic statistics are "distortions," "propaganda," a "travesty," "mis- and disinformation." So, as one person finally noted, the Pied Piper of Doom's point "is that nothing anyone says can be trusted, even the final numbers, to any extent whatsoever, and ergo, we have to believe his conclusions."

Well, if that's the case, there's a little problem. Here's the Pied Piper of Doom only 3 days later:
By the way, and for the record, for any that deny what’s going on before their eyes, this month-over-month/year-over-year number inflation issue is not a “conspiracy theory.” These are cold, hard facts, (independently facilitated--without ANY inference/implication of collusion) by three separate entities publishing many of the most important key economic metrics utilized within our society: our government’s Bureau of Labor Statistics, the Bureau of Economic Analysis and the private sector’s National Association of Realtors.
Ummm, first of all, I didn't know the NAR had anything to do with generating the CPI report. Apparently that's in the double-secret Doomer spy kit. But more importantly, didn't we just hear that we're not supposed to trust any government economic statistics?!?

But wait, you say. In the first article, he was discussing GDP. In this one he's discussing inflation. Well then, let me take you all the way back to ... two weeks ago. That's when the Pied Piper of Doom told his audience that:
here we are, a year after Secretary Geithner’s failed message appeared in print, and what do we have? Economic realities that tell us things might morph, yet again, from very bad to worse. How bad? Here’s a link to the latest analysis from William Alden over at HuffPo: “Recession Fears Revived As Economic Data Point To Critically Weakened Growth.”
And what did the aforesaid William Alden rely upon? From the link:
[I]nvestors ... quickly changed focus to the increasingly ugly fundamentals: Gross domestic product is barely growing, the unemployment rate is high, home prices are falling and the manufacturing sector is suffering, with little relief in sight.

A stream of data in recent days vividly portrays a sick economy. One more obstacle, experts say, might put an end to growth.
....
The economic situation may be worse than the headline numbers make it seem. Economic output grew at an annual rate of just 0.85 percent in the first half of the year, the government announced Friday. Growth in the first three months clocked in at a meager 0.4 percent.
(my emphasis) Yep. The Pied Piper of Doom told his audience that "economic realities ... [are] morph[ing] from very bad to worse" because of downward revisions to GDP!!!

So, let me get this straight. Government statistics like GDP and payroll data are misinformation and propaganda, like when they show 9 straight quarters of growth from the 3rd quarter of 2009 on, except when they are revised downward. Then they're gospel. I'm sure there's a reason for that somewhere....

But it isn't just the Pied Piper of Doom I'm writing about. He got over 400 recommendations for that know-nothing screed. Here's a few of the comments:

- "Thanks for the confirmation of what many of us knew all along. The stats used in the Green Shoots diaries were known by many to be complete horseshit." (77 recs)

- "The official "unemployment" statistics are a total fabrication .... "They" don't tell you, because "they" don't want you to know" (48 recs)

- "Torture those numbers. Waterboard the numbers until they tell you what you want to hear!")

- "Of course government reporting is "managed". ... the fact that government is lying about its economic reporting"

- "Clap harder, everything will be all right. The government IS playing with number"

- "there is no shortage of idiots who will point to economic reports, dat, and statistics as somehow contradicting what peoples' personal experiences tell them."

That last one is a real gem. I don't know about you, but my personal experience everywhere I go is that the earth is flat, and plainly the sun, the moon, and the planets and stars all revolve around it.

That the Pied Piper of Doom is an economic dunce is plain if you actually dig into his record of over 100 false prophecies of Doom (saved on my hard drive), including for example multiple prophecies of imminent stock market crashes dating from May 2009 with the Dow Jones at about 7000. But he could not survive without his acolytes, for whom data is selectively accurate and selectively propaganda -- depending on whether it fits with their preconceived notions or not.

I never did a GBCW from DK. I left because even in the heyday only about 1 in 8 of my posts ever hit the rec list, and I am under no obligation to endure insults from people who plainly are not interested in factual debate. There is no point in attempting discourse with Know-Nothings - and with DK's participation numbers continuing to decline, it's clear that when it comes to the economy, Know-Nothings are the largest part of the remaining rump.

-----
P.S.: Unlike DK, whose YoY readership continues to decline, our numbers are going up in this period of uncertainty. We're getting a bunch of new readers who have seen our work on Seeking Alpha, and we know that some others quietly sneak over here from DK to find out what is really going on.

Economic Indicators of the Roaring Twenties and Great Depression

- by New Deal democrat

I've been meaning to bookmark for future reference all of the posts I wrote in the last few months looking at economic indicators during the pre-WW2 deflationary era, and since it's a Sunday, now seems like a good time. Secondarily, there's an idiot at DK who is claiming that in my piece last week I neglected to look at indicators more than 50 years old, so my work is invalid, yadda yadda yadda - despite the fact that there was an entire section in that post devoted entirely to that era.

So, for the record, here are my prior posts discussing economic indicators from the period predating World War 2:

Professor Geoffrey Moore on Leading Indicators from 1854-1938

The Dow Jones Bond Average and pre-WW2 recessions

Real long term interest rates and pre-WW2 recessions

Money supply and pre-WW2 recessions

The yield curve and pre-WW2 recessions

Stock prices and pre-WW2 recessions

Commodity prices and pre-WW2 recessions

Housing starts as a pre-WW2 leading indicator

Corporate [BAA] bonds and pre-WW2 recessions

Economic Indicators during the Roaring Twenties and the Great Depression (V) (five part series examining the "Kasriel Recession Warning Indicator" of inverted yield curve and negative real money supply as applied to the pre-WW2 deflationary era).

So I'm pretty sure I know what I'm talking about.