Saturday, April 25, 2020
Weekly Indicators for April 19 - 23 at Seeking Alpha
- by New Deal democrat
My Weekly Indicators post is up at Seeking Alpha.
The coincident and short term leading indicators, as expected, continue to be awful — probably the worst since the Great Depression.
Whether this downturn can be turned off relatively quickly, or whether it metasticizes into something far worse and far longer is going to be determined by the wisdom - or lack thereof - of those few people at the very top of the US and State governments. The outcomes might be extremely different if they are determined at State levels.
Coronavirus dashboard for April 24: variation in US numbers are all about NY
- by New Deal democrat
Here is the update through yesterday (April 24)
As usual, significant developments are in italics. Two days ago NY recorded almost no new infections, and yesterday it made up for that quirk. As a result, the total US recorded a daily new high in infections. Meanwhile testing has ramped up about 33% higher in the past few days compared with earlier in the month, and the ratio of total tests vs. positive results made a new high.
Here are yesterday’s numbers.
Number and rate of increase of Reported Infections (from Johns Hopkins via arcgis.com)
- Number: up +36,161 to 905,333 (new daily high)
- NY: 8,130 vs. 168 day/day; 3 day rolling average 4,410 vs. 10,569 at peak, or -58.3%
- US ex-NY: 3 day rolling average 31,156 vs. 33,437 at NY peak, or -6.8%
- ***US Rate of increase: day/day: 4% (vs. 4% for the past week, and 3% on April 22)
The new daily high in new infections is entirely an artifact of a day/day quirk in reporting from NY. The trend seems to be a slight decrease in the number of new cases. This is almost entirely due to New York, which is on track to “crush the curve.”
Number of deaths and infections and rate of increase of testing (from COVID Tracking Project)
- ***Number of deaths: Total 45,786, increase of +1,772 day/day
- Rate: increase of 4% day/day vs. average of 5% in past week
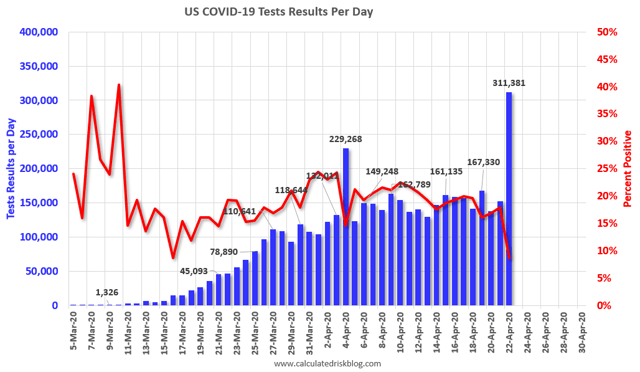
- Number of tests: 223,552 (new daily peak*)
- Ratio of positive tests to total: 7.1:1 (new daily peak*)
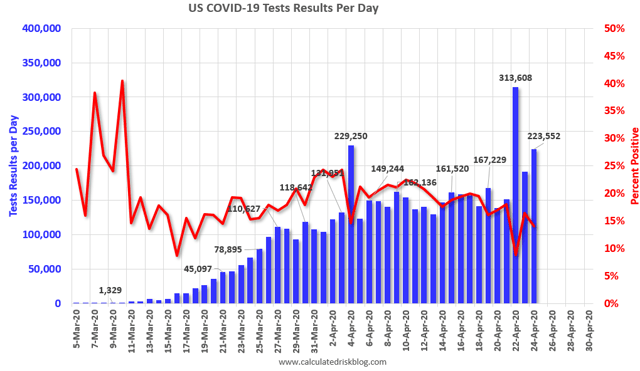
*ex.-Calif clearing its backlog
Summary for April 24
- The total US population remains under total lockdown has declined from about 95% to about 88% due to the three renegades in the Confederacy (which were also among the very last States to go to lockdowns a few weeks ago)
- The number of daily new infections made a new high yesterday, but that is entirely an artifact of NY recording only 168 cases the day before; NY increased about 8,000 day/day, while the US increased about 7,200 day/day. In other words, NY’s recording quirk accounted for the entire increase and then some. Average NY over two days and the overall US trend of a slight decline is intract.
- Deaths daily still appear to be increasing slightly.
- The trend number of daily tests has improved dramatically in the past few days from an average of about 150,000-160,000 to over 200,000. As a result we are picking up a higher number - but decreasing rate - of new infections.
- Nevertheless, we are continuing to miss a large percent of new infections. My personal suspicion remains that the actual number of total infections in the US is about 5x the official number, or roughly 4.5 million at present.
- New York and Hawaii are the only States that are “crushing the curve.” NY is the only State approaching a test regimen sufficient to begin opening its economy once a tracing regimen is put in place.
- In general, outside of New York, progress has stalled. There is no indication that testing, let alone tracing and isolation regimens, are ramping up in any meaningful sense anywhere else. This means that lockdowns will remain in place indefinitely.
Friday, April 24, 2020
Coronavirus dashboard for April 24: NY “crushing the curve,” while rest of US stalls
- by New Deal democrat
Here is the update through yesterday (April 23)
As usual, significant developments are in italics. Yesterday was the best day yet for testing (outside of those couple of days where California reported its backlog of negative tests).
Here are yesterday’s numbers.
Number and rate of increase of Reported Infections (from Johns Hopkins via arcgis.com)
- Number: up +26,548 to 869,172
- NY - 3 day rolling average down -4,351 from peak, or -45.0%
- US ex-NY - 3 day rolling average UP +495 since NY peak, or +2.2%
- ***Rate of increase: day/day: 3% (vs. 4% for the past week, and 2% on April 22)
The trend seems to be a slight decrease in the number of new cases. This is almost entirely due to New York.
Number of deaths and infections and rate of increase of testing (from COVID Tracking Project)
- ***Number of deaths: Total 44,014, increase of +1,911 day/day
- Rate: increase of 5% day/day vs. average of 5% in past week
- Number of tests: 192,664 (new daily peak*)
- Ratio of positive tests to total: 6.1:1 (vs. daily peak of 6.2:1 on April 18*)
*ex.-Calif clearing its backlog
Summary for April 23
- The total US population remains under total lockdown has declined from about 95% to about 88% due to the three renegades in the Confederacy (which were also among the very last States to go to lockdowns a few weeks ago)
- The number of daily new infections has declined slightly, but that is entirely because NY is “crushing the curve”
- Deaths daily still appear to be increasing slightly.
- The trend number of daily tests appears to have improved a little bit to an average of about 160,000. We are continuing to miss a large percent of new infections. My personal suspicion is that the actual number of total infections in the US is about 5x the official number, or roughly 4.1 million at present.
- In general, outside of New York, progress has stalled. There is no indication that testing, let alone tracing and isolation regimens, are ramping up in any meaningful sense anywhere else. This means that lockdowns will remain in place indefinitely.
Thursday, April 23, 2020
Jobless claims still point to over 20,000,000 lost jobs in April, 15%+ unemployment rate
- by New Deal democrat
As I’ve written in the past few weeks, the number of initial jobless claims correlates roughly with the number of net new jobs added or subtracted in any given month. Normally there is too much noise for it to be of much value, but with the huge spike in the past month, the signal will come through much more strongly.
Here’s what the crude correlation looks like between initial claims (blue, weekly) and jobs (red, monthly), in the past year through February:
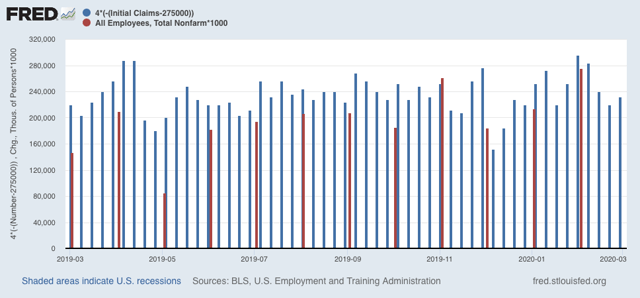
And here is what the exact same correlation looks like since the beginning of March:
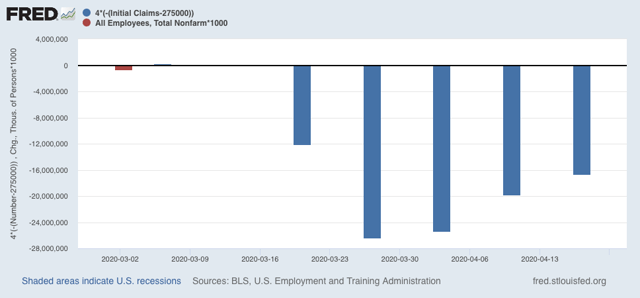
The reporting week for the April jobs number was last week. In the 4 months ending last week, over 23,000,000 new jobless claims were filed. Since about 275,000 such claims would roughly correlate with zero net new jobs, that means that we can expect that about -22,000,000 jobs were lost in April.
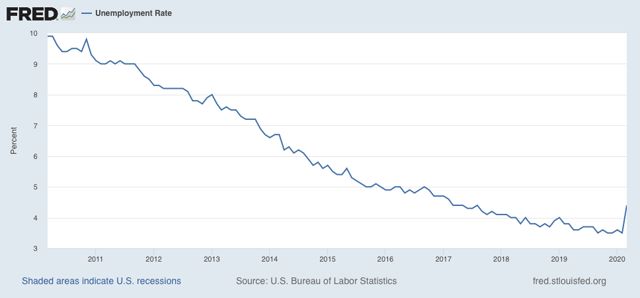
In March, the unemployment rate moved higher to 4.4%:
Meanwhile, the civilian labor force is about 160,000,000 people:
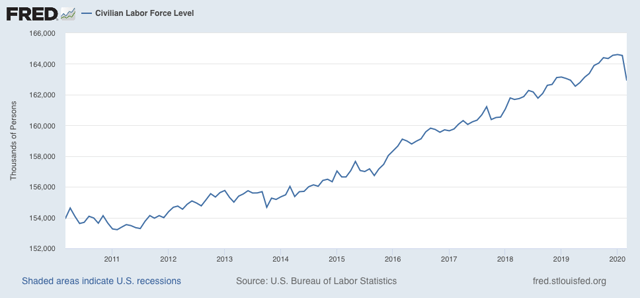
Subtracting 22,000,000 jobs is about a -12% decline in that number.
Add that to the existing 4.4% unemployment rate gives us a likely April unemployment rate on the order of 16.4%.
Needless to say, these are losses on the order of the Great Depression.
Abbreviated Coronavirus dashboard for April 23: New York accounts for ALL of the US’s progress
- by New Deal democrat
No big changes today, and since a picture is worth 1000 words, let me let the graphs speak pretty much for themselves.
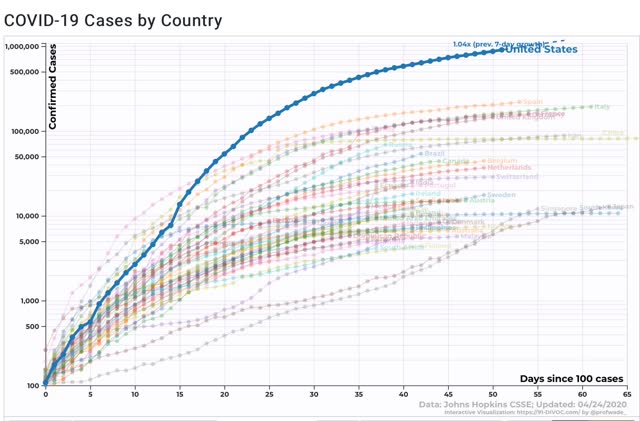
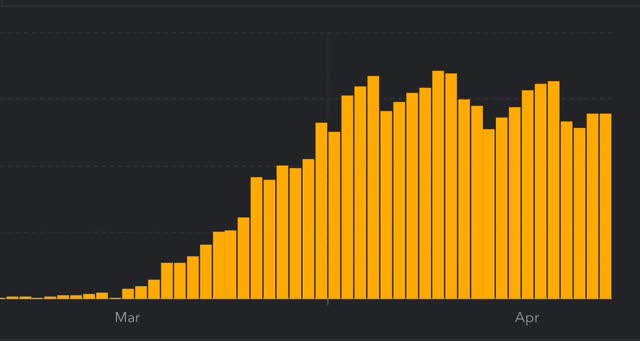
1. Daily infections for the US as a whole continue to look like they are trending slightly down (but more on that below):
2. The 7 day rate of new infections remains stuck at +4%. There is very little evidence of this rate of increase slowing:
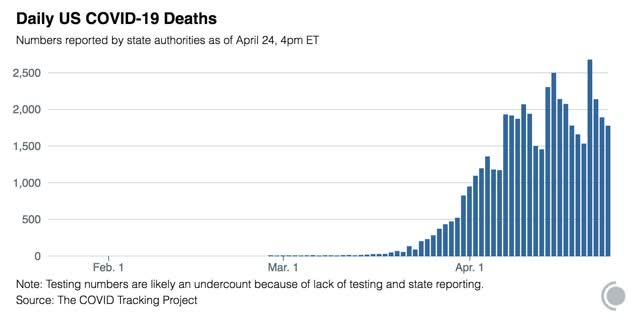
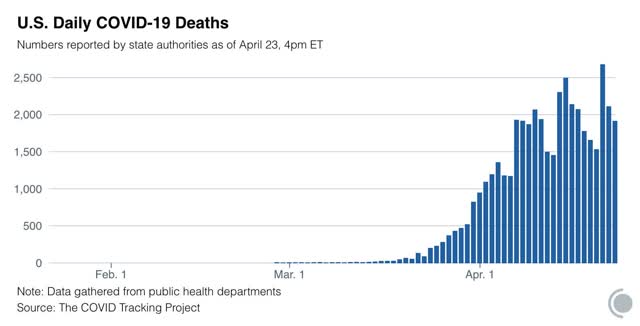
3. The trend in deaths has not peaked:

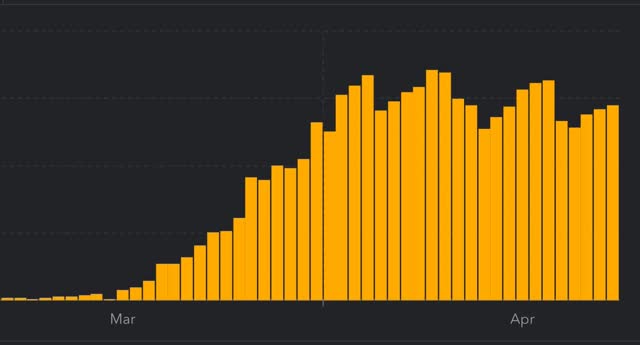
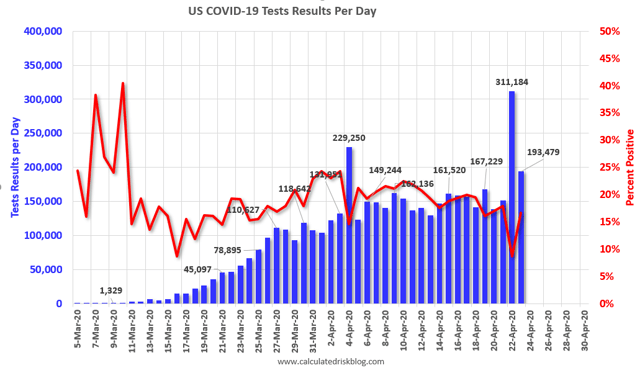
4. California cleared a big backlog in testing yesterday, which is why the number of tests spiked and the ratio of positive tests to total tests sharply declined:
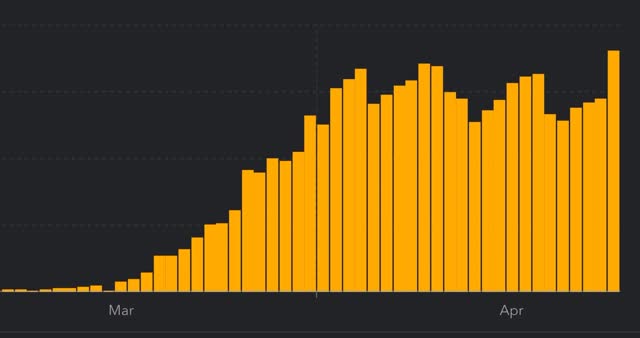
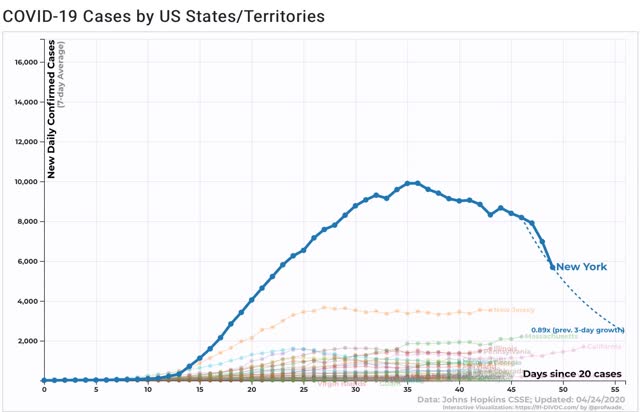
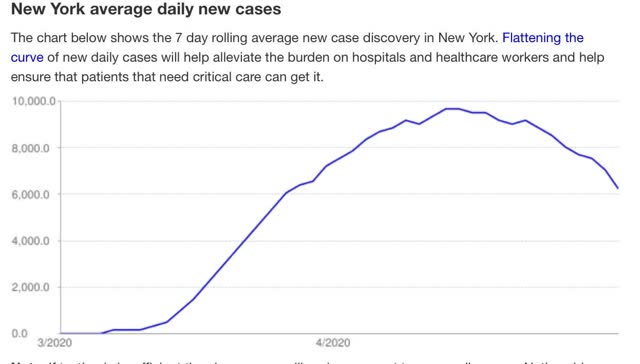
5. BUT - when we look at the 7 day rolling average of new daily infections, New York State has steeply declined, by over 33%, from a peak of 9,651 on April 9 to 6,205 yesterday:
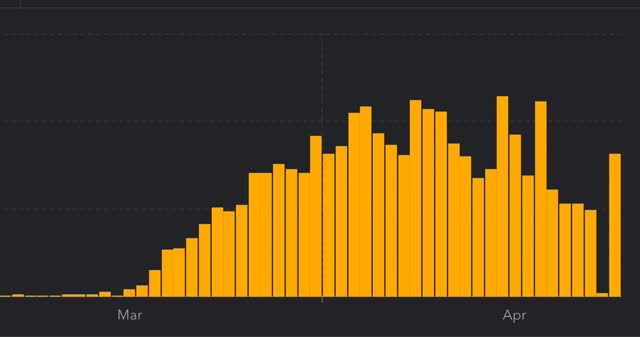
6. By contrast, during that same period the decline for the entire US has only been a little *under* 3,000 new infections daily, from 30,747 to 27,754:
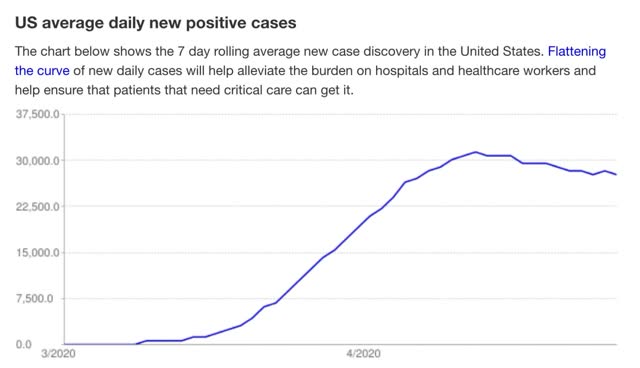
(H/t Department of Numbers for graphs #5&6)
7. Which means that the 3,400+ decline in NY accounts for *more* than the entire decline in the US, I.e., ex-NY new infections have continued to *climb* slightly over the past 2 weeks. Not good at all, and certainly not a basis for any “opening up” of the economy.
Subscribe to:
Posts (Atom)