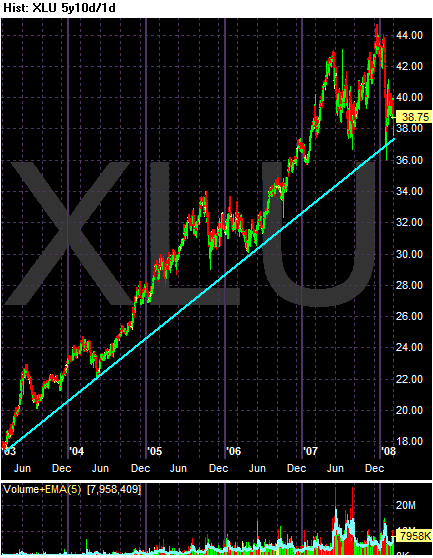
The 5-year chart chart shows the sector is still clearly in a rally.

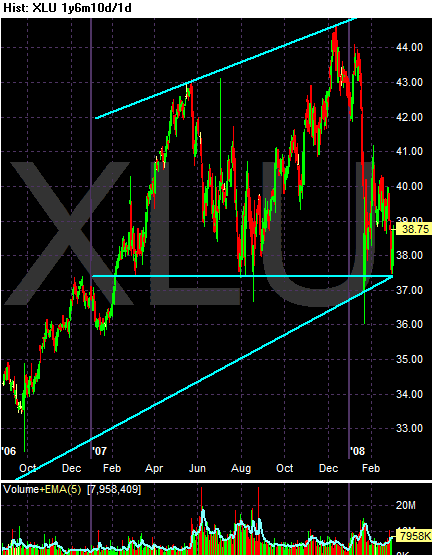
Here's a closer look at the last 1 1/2 years. Notice:
-- The average is still above the long term trend line, but
-- There is also a broadening formation occurring which is a reversal pattern.

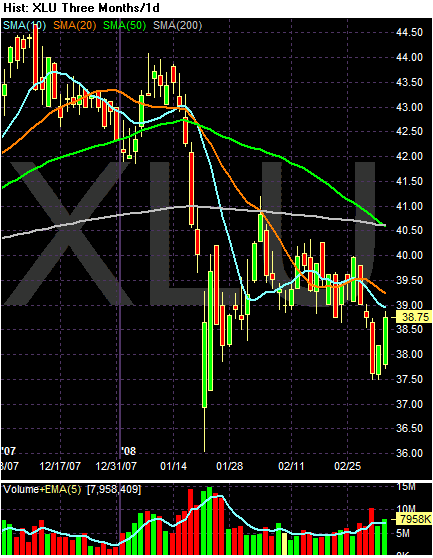
The SMAs tell us the following:
-- Prices are below the 200 day SMA, which indicates a bear market
-- The longer SMAs (the 50 and 200 day SMA0 are clearly moving lower.
-- The 50 day SMA is about to cross over the 200 day SMA -- a bearish crossover.
-- Prices and the shorter SMAs are wrapped up around the same level, indicating a lack of direction.
Short version: expect more losses.