Saturday, June 1, 2019
Weekly Indicators for May 27 - 31 at Seeking Alpha
- by New Deal democrat
My Weekly Indicators post is up at Seeking Alpha.
There was a touch of weakening across several timeframes. The economy is just weak enough that continuing trade and tariff tantrums could take a slowdown and do enough damage to make it a downturn.
As usual, clicking over and reading should be informative for you, and helps me just a little bit for the effort I put into the work.
Friday, May 31, 2019
Q1 corporate profits and real gross domestic income
- by New Deal democrat
Yesterday the second estimate of Q1 GDP came out, which means that corporate profits for Q1 were finally reported.
In my post earlier this week at Seeking Alpha, I wrote that corporate profits are of higher forecasting importance because of the contradiction in the signals being sent by the bond market vs. the housing market. So what light do they shed on the forecast for the next 12 months?
I wrote a follow-up post, and it is up on Seeking Alpha. As usual, clicking over and reading should be informative for you, and helps to the tune of a couple of pennies for me.
P.S.: As a bonus, another important Q1 metric, gross domestic income, was also reported in yesterday’s revision. There is some evidence that, when they diverge, GDI leads GDP. Here’s what that relationship looks like for the past 30 years:
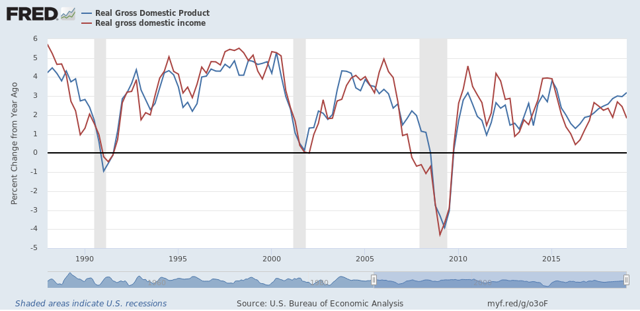
Note 1989-90 and 2006-07. And finally, note that YoY real GDI growth has once again diverged sharply from real GDP, and is only up 1.8% through Q1.
Thursday, May 30, 2019
Initial jobless claims: still positive, but extra watchfulness justified
- by New Deal democrat
Late last year, as initial jobless claims were rising off their September lows, I did some parsing of levels to watch for in terms of a change in the economic cycle.
Here’s the nut:
the simple fact is that there is almost always one or two periods a year where the four week moving average of jobless claims rises between 5% and 10%. About once every other year for the past 50+ years, it rises over 10%. Typically (not always!) it has risen by 15% or more over its low before a recession has begun. And a longer term moving average of initial claims YoY has, with one exception, turned higher before a recession has begun.
A second way to parse signal from noise is to look at readings YoY. With the sole exception of 1981, when the Fed was drastically raising rates, the number has always been higher YoY by the time a recession begin.
—-
So let me distill some signal from the initial claims noise:
As to the four week average:
- at an increase of 10% in the four week average from its low, take notice
- an increase of 12.5% or more is a warning sign
- an increase of 15% or more almost certainly means a recession is close at hand
As to the YoY% change averaged monthly or quarterly:
- at a decrease of -2.5% or less, take notice
- a YoY increase is a warning sign, but there are many false positives
Here’s a graph illustrating that latter point:
Here’s a graph illustrating that latter point:
 ——
——
Now let’s turn to this week’s data. The four week moving average is 216,750, up 7.6% from its low of 201,500 in the weeks leading up to this year’s late Easter:
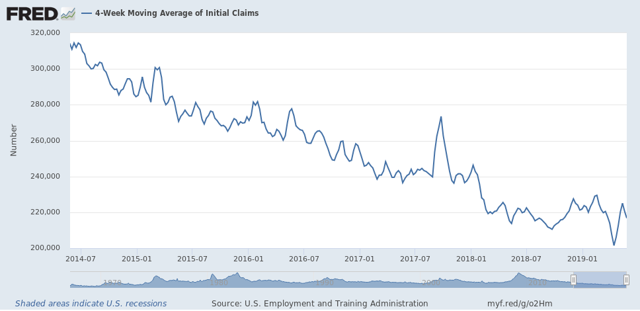
Although the levels are generally flat to slightly declining since February of last year, there’s no cause for concern here yet.
The monthly YoY% change, however, is only -1.5%:
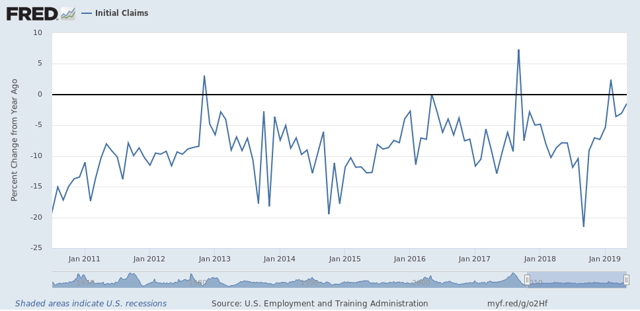
Since the beginning of this year, while remaining positive for the economy, the comparisons have been weakening - even with the 49 year lows in early April. We don’t have a warning sign at this point, but taking notice and being extra watchful is justified.
Wednesday, May 29, 2019
Resolving the contradiction between the yield curve and housing
- by New Deal democrat
If you listen to the yield curve, it is screaming “recession!” If you listen to new home sales, they are saying “no worries!” One of them is wrong.
For the last couple of weeks, I have been going back over history in an effort to resolve the contradictory signals. One important portion of that work has been to focus on the non-financial leading indicators, and in particular, balancing the consumer stress indirectly measured by housing permits vs. the producer stress measured by corporate profits.
The outcome of factoring corporate profits into the mix is telling. This work is up at Seeking Alpha. As usual, clicking over and reading helps reward me with a little $$$ for my efforts.
Tuesday, May 28, 2019
Trucking tops ailing rail (nerdy)
- by New Deal democrat
Since the beginning of this year, weekly rail volumes have usually been negative. The full year to date volumes have also been negative YoY:
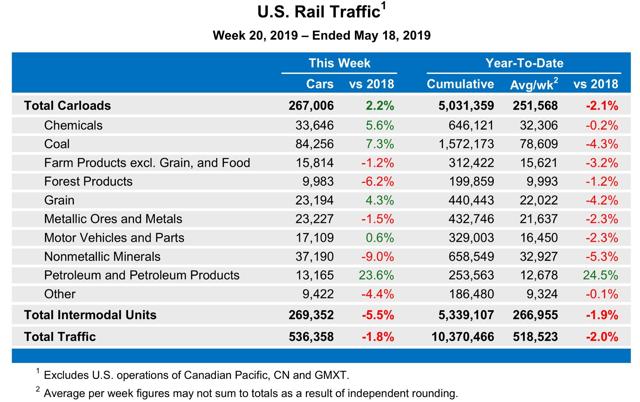
Since all manufactured goods have to be transported to market, if this is something confirmed in other transportation readings, it would clearly be recessionary - as in, a recession has already started.
One alternative measure of the transportation sector is the Cass Freight Index.
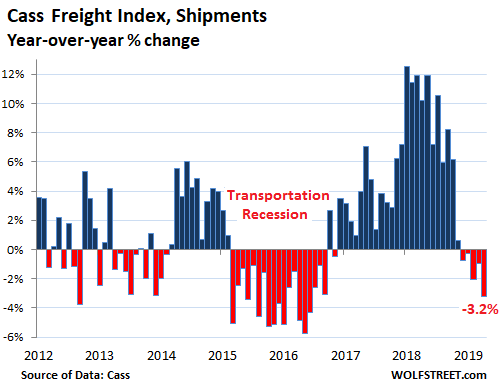
Although, interestingly, the primary reason for the downturn seems to be an anomalous surge that happened in late 2017 (due primarily to the hurricanes?) and went out of the YoY comparisons in late 2018, as shown in this next graph:
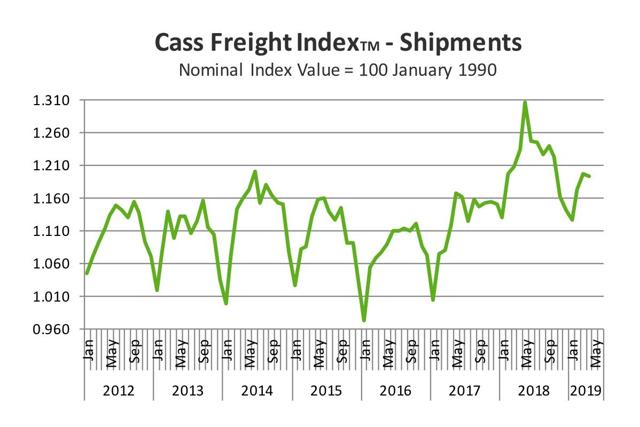
Note the seasonal downturn that typically starts to happen in about October, but never happened in 2017. As a result, on a 2 year basis, the Cass Index is up 7.0%.
Another issue with the Cass Index, however, is that it also measures international air and ocean shipping volumes for the U.S. So at least some of the downturn may be changes in international freight, perhaps due to Trump’s trade wars.
So I have been waiting for the April American Trucking Association Index. If domestic trucking is down as well as rail, that clearly looks recessionary. But if trucking is up while rail is down, that looks like a substitution, possibly due to competing costs, and/or possibly due to changed transportation patterns as western railroads suffer due to the widened Panama Canal increasing shipments directly to East and Gulf Coast ports.
And, late last week, the April trucking index was released.
Here’s what it shows:
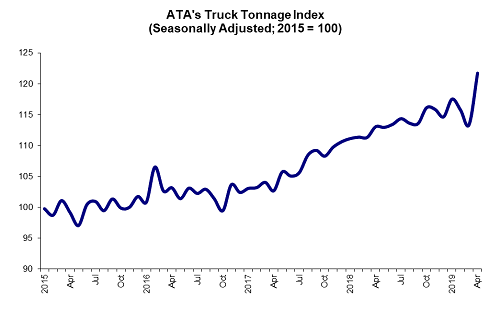
According to the ATA:
[the] seasonally adjusted (SA) For-Hire Truck Tonnage Index surged 7.4% in April after decreasing 2% in March. In April, the index equaled 121.8 (2015=100) compared with 113.4 in March.
“The surge in truck tonnage in April is obviously good for trucking, but it is important to examine it in the context of the broader economy,” said ATA Chief Economist Bob Costello. “February and March were particularly weak months, as evidenced by the 3.5% dip in tonnage due to weather and other factors, so some of the gain was a catch-up effect. In addition, the Easter holiday was later than usual, likely pushing freight that would ordinarily be moved in March into April.”
“I do not think the fundamentals underlying truck tonnage are as strong as April’s figure would indicate, but this may signal that any fears of a looming freight recession may have been overblown,” he said.
Even averaging April with March, however, the trucking index remains positive.
The bottom line is that the downturn in rail has not been confirmed by trucking, which continues in an uptrend. This is real time evidence that while the economy may be softening, it’s not in an outright downturn.
Monday, May 27, 2019
Memorial Day 2019: let the enemy dead rest in peace
- by New Deal democrat
Memorial Day was established as the day for both sides of the American Civil War to honor their dead. Today there will be many observances remembering those who made the ultimate sacrifice on behalf of the country.
On a broader scale, the dignity - or not - with which a country allows the burial of its enemy’s ordinary soldiers and sailors also speaks to its values.
Here is the grave of two British soldiers killed at the Battle of Bunker Hill:

Here is the German war cemetery in LeCambe, Normandy, France:

Here is the Anzac cemetery in Gallipoli, Turkey:

The plaque contained these words from Attaturk, the founder of modern Turkey:
“Those heroes that shed their blood and lost their lives…
You are now lying in the soil of a friendly country. Therefore Rest In Peace. There is no difference between the Johnnies and the Mehmets to us where they lie side by side here in this country of ours…
“You, the mothers, who sent their sons from faraway countries wipe away your tears; your sons are now lying in our bosom and are in peace, after having lost their lives on this land they have become our sons as well”
Or at least it used to. In June 2017 the current nationalist and Islamist leadership of Turkey had the plaque desecrated. Here is what it looks like now:

It is a bigger insult to the dead than if there had never been a plaque at all, and speaks poorly of the current regime in Turkey.
And, to return to the original purpose of Memorial Day, here is the graveyard of about 140 Confederates who died in a. POW camp in Madison, Wisconsin:

In the foreground is the plaque, “Confederate Rest,” speaks of “These valiant Confederate soldiers [who were] fighting under extremely difficult conditions” before being forced to surrender. Behind it is a larger monument as well as the individual graves. Here’s a photo of the monument:

The plaque was removed in 2017.
Overruling its Landmarks Commission, in 2018 Madison ordered the removal of the large monument as well, because on its base was the statement that it was erected by the Daughters of the Confederacy, and because it listed the names of the dead.
Overruling its Landmarks Commission, in 2018 Madison ordered the removal of the large monument as well, because on its base was the statement that it was erected by the Daughters of the Confederacy, and because it listed the names of the dead.
Whatever you think of the actions of Turkey you should also think of the actions of Madison, Wisconsin.
Sunday, May 26, 2019
The Western Hemisphere’s portion of the Arctic looks set for a record low
- by New Deal democrat
Given Donald Trump’s view that global warming is a hoax, I am surprised that almost 2 1/2 years into his Presidency NOAA’s “Arctic Sea Ice” page is still with us. And since I am a nerd, during the spring and summer it is something I check.
In past years, sea ice melted much more in the Eurasian arctic at the extremities of the Gulf Stream than on the North American side. In contrast, the decline in ice cover in the North American sector of the Arctic is particularly advanced this year. Here’s what it looks like as of yesterday:

With the exception of Hudson’s Bay, it looks much more like the end of June for the past decade in that sector of the Arctic. In order, here are June 2018, 2017, and 2012


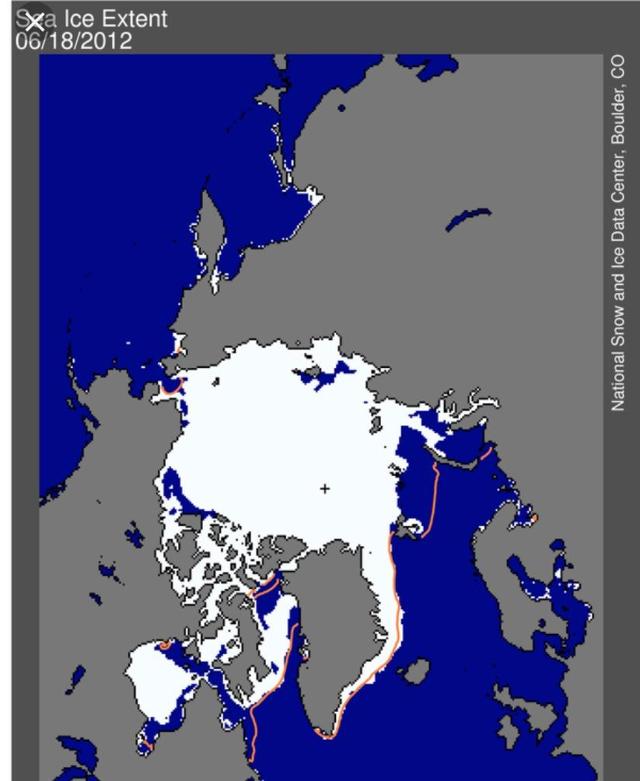
And for the Canadian Arctic (again aside for Hudson’s Bay), it isn’t even far behind mid-July of last year:

Of course, this pattern might not continue for the next several months. But if it does, we are probably going to set another record low for ice, at least for the Western Hemisphere’s portion of the Arctic.
Subscribe to:
Posts (Atom)