This indicate the internal condition of the markets is still weak.
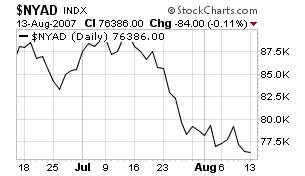
The New York Advance/Decline Line is still trending slightly lower.
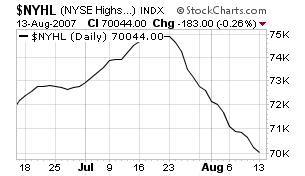
The New York High/Low is still heading lower
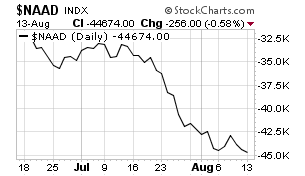
The NASDAQ advance/decline is still heading lower
And the NASDAQ new high/new low is still heading lower
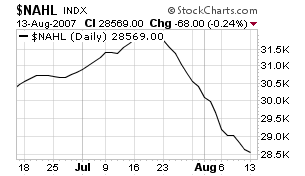
These are not bullish charts in any way.