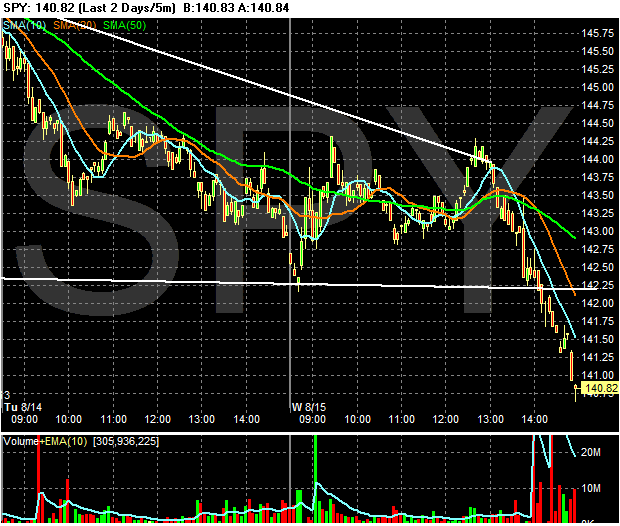
Here's the 2-day 5-minute chart. Notice the market started selling off a little after 12.30. Also notice the market continued downward since that time. Once the market broke through support the volume pick-up and the decline continued.

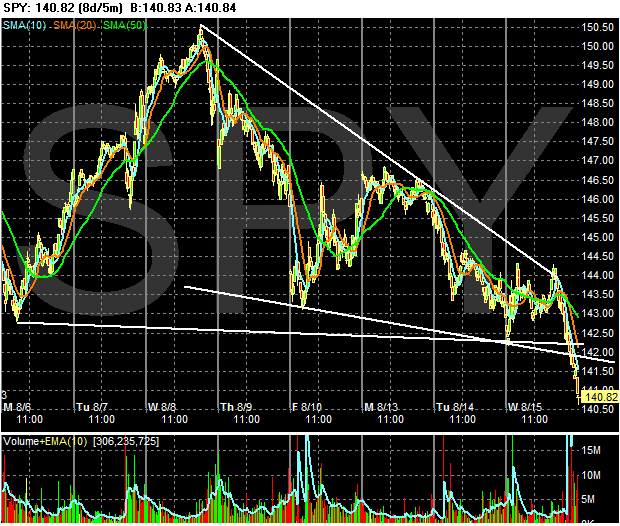
Here's the 8-day chart. Yesterday I commented the market was forming a triangle consolidation formation; we simply didn't know where the market was headed. Now we do -- lower.

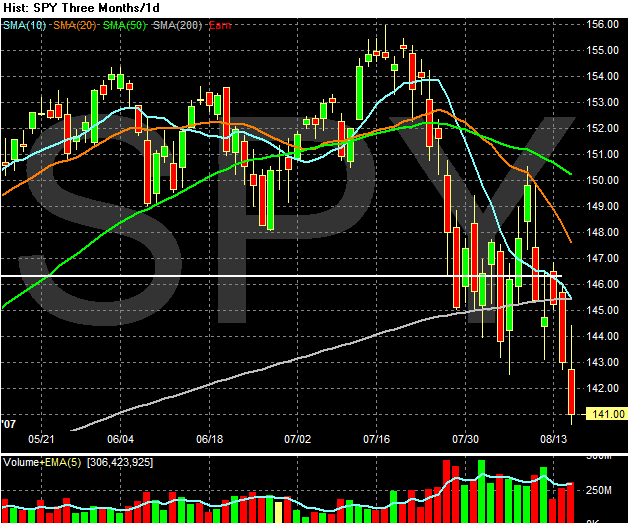
Here's the chart that should concern everybody. The SPYs closed below the 200-day SMA in a big way. This is what the beginning of a bear market/serious bull market correction looks like. In short, this chart ways we are heading lower.
