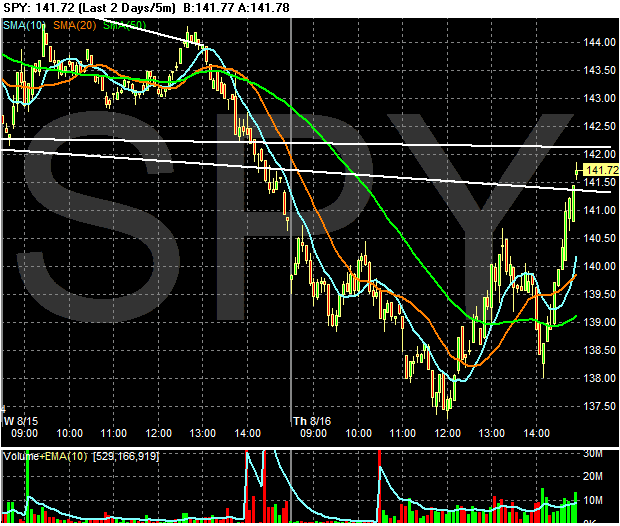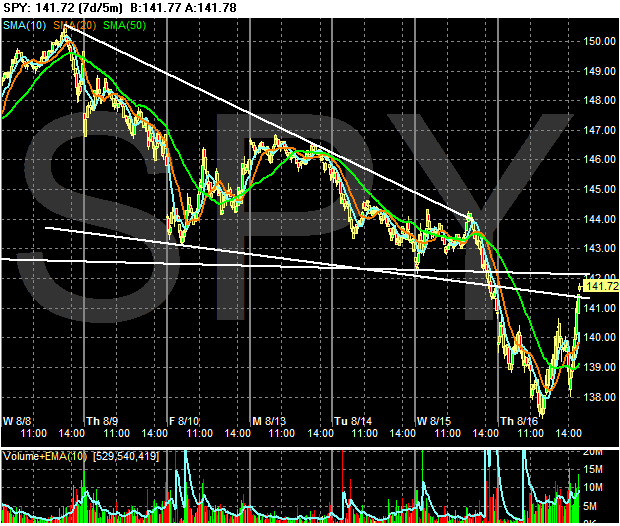
However, the 7-day chart indicates we're not out of the woods yet. Notice we still have resistance at the lower part of the triangle formed over the last 8-10 days.

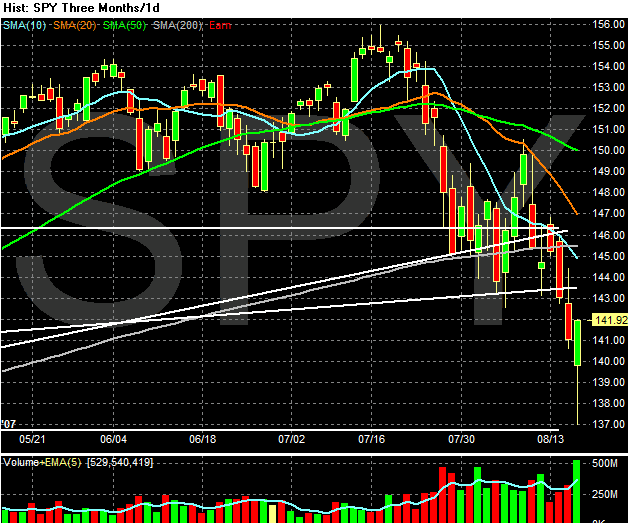
And here's the daily chart. There are a lot of ways to look at this. There is really high volume, which could indicate a selling climax. However, we're still below a ton of resistance and the market is clearly in a downtrend. Combine that with the overarching credit market situation and you still have pretty strong downward pressure.
