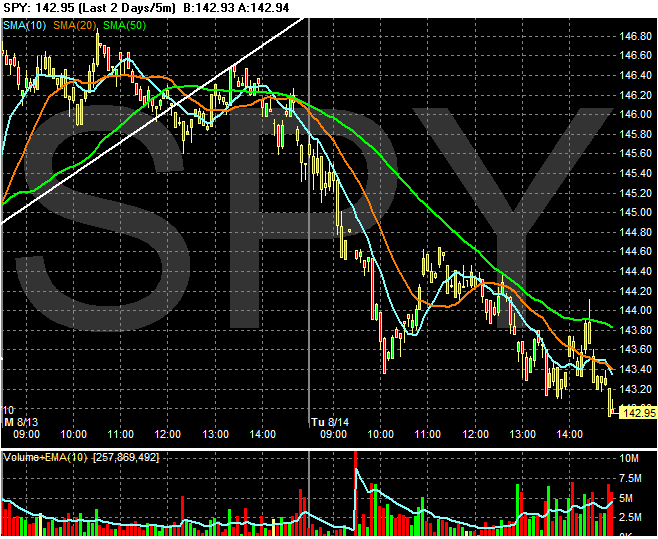
1.) The clear downtrend that started about 11 AM and continued for the rest of the trading day.
2.) The market sold-off at the end of the day on big volume.
3.) All three simple moving averages (SMAs) are moving lower and the short-term averages (10 and 20 minute SMAs) are lower than the 50 minute SMA. Both of these factors are bearish.

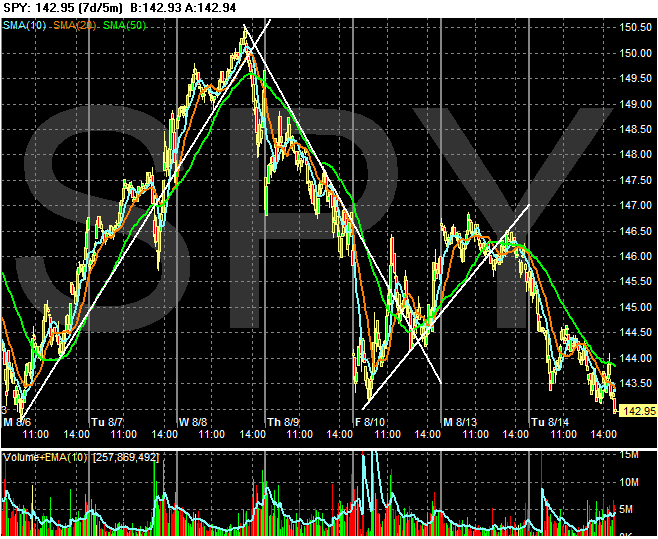
Here's a 7-day chart that goes back to Monday of last week. Notice we're right where we started last week.

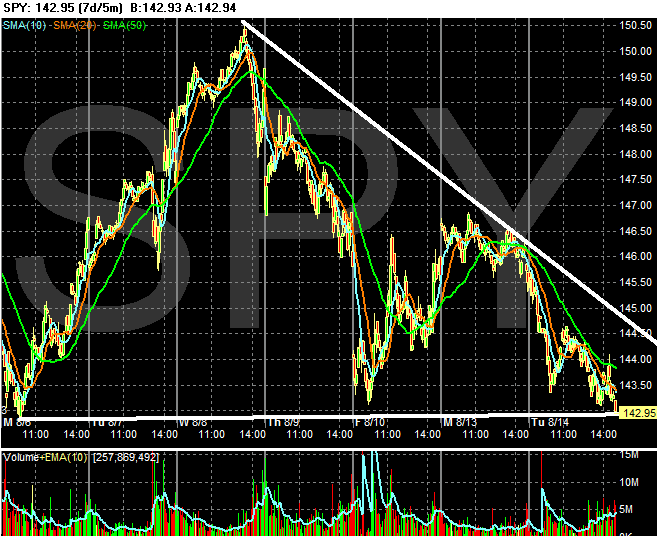
Here's another way to look at the chart. The last 7-days are a triangle consolidation pattern. This could mean that prices are ready to move strongly in one direction or another. The big question is which direction.

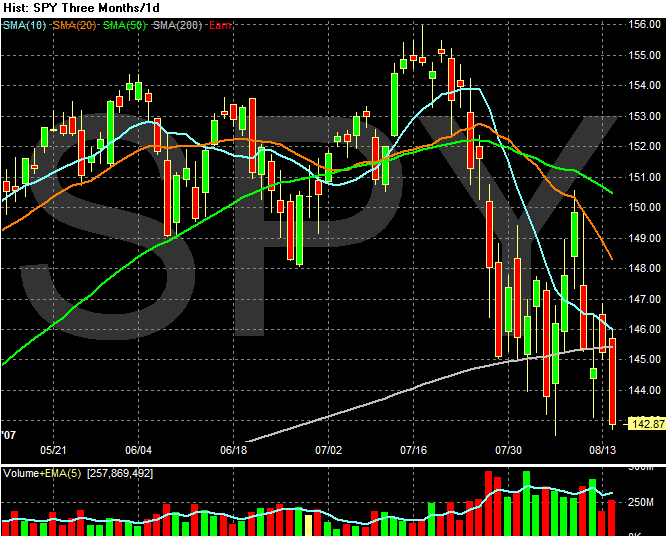
Finally, here's the daily chart, which looks terrible. The 10, 20 and 50 SMAs are all moving lower. The shorter-term SMAs are below the longer SMAs, strongly indicating a further downtrend. The index closed below the 200 day SMA pretty decisively. Bottom line -- this chart stinks for anyone going long.
