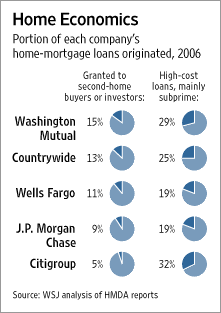
I'm not saying this is good or bad. What I am saying is it seems like a fair amount of mortgage loans were made to people who either had questionable credit or already had a home.


First, it is important to understand that mortgage debt has begun to grow at a slower pace largely because home prices are no longer appreciating. The growth in the mortgage market was about equal to nominal GDP growth between 1980 and 2000. But, in the 2000 to 2006 period, a massive breakout from the trend occurred and, combined with a decline in the saving rate, drove consumption and GDP growth. But, as home prices began to decline in 2006, and as problems in the subprime lending market became evident, lending standards were tightened to their highest level in 15 years. Declining home prices and tighter lending standards brought about a slowdown not only in mortgage debt growth but also in overall debt growth. Mortgage debt, which grew at an annual rate of 10.2% in the second quarter of 2006, declined to an annual growth rate of 8.6% in the third quarter and to 6.4% in the fourth quarter. It is likely that mortgage debt growth slowed down further in the first quarter of 2007, and will decline even more in the second quarter given the problems in the sub-prime lending industry and the tight lending standards.
In the meantime, household debt growth in the United States has declined from a peak of 11.9% in the third quarter of 2005 to 6.6% annual rate in the fourth quarter of 2006. According to David Rosenberg, the fourth-quarter 2006 annual credit growth was the slowest since the third quarter of 1998 and the sixth consecutive quarterly deceleration, “which hasn’t happened since 1956” (emphasis added). Now, ceteris paribus, this significant slowdown in mortgage and household debt accumulation would have already brought about a significant slowdown, or even a decline, in US consumption. However, because of the stock market rally in the fourth quarter of 2006, equity wealth increased by 4.2%, or an annual rate of 18%.
......
Now, this deterioration in household debt growth hasn’t yet led to a consumer spending decline; but, very clearly, retail sales are now growing more slowly. Continuous consumption growth was therefore driven less by household debt growth in the fourth quarter of last year and the first quarter of this year, than by the continuation of an increase in household wealth and the selling of US equities by the household sector. But herein lies the problem. If declining home prices are now joined by equity prices that are either declining or no longer rising, it will only be a matter of time before consumer confidence declines and the consumer either slows down their spending further or stops spending altogether.
Of the six banks that reported earnings yesterday, four -- SunTrust, U.S. Bancorp, Comerica Inc. and M&T Bank Corp. -- saw net income fall from the year-ago quarter. KeyCorp, of Cleveland, posted a 31% gain in quarterly profit, helped by the sale of its McDonald Investments unit.
...
Wells Fargo cited higher losses on home-equity loans in the Midwest and in central California. Howard Atkins, Wells's chief financial officer, said deterioration in certain markets was caused by rising interest rates on some mortgages combined with falling home prices, creating very high loan-to-value ratios that made it difficult for borrowers to refinance out of high-cost loans.
...
Minneapolis-based U.S. Bancorp said net income fell 2% from a year ago, citing higher credit costs and operating costs of acquired businesses and lower net-interest income, which offset growth in fees.
SunTrust saw net income fall 2%. While revenue grew 1% and outpaced growth in expenses, it wasn't enough to overcome an increase in the provision for loan losses. SunTrust said nonperforming loans rose to 0.57% of total loans from 0.25% a year ago, largely due to slipping credit quality on low-documentation, or "Alternative A," loans.
Detroit-based Comerica said net income fell 2%, despite a tight rein on expenses, due to a higher loan-loss provision.
M&T Bank, based in Buffalo, said profit fell 13% due to previously disclosed declines in mortgage revenue. The bank said buyers of Alternative A loans are getting scarce, forcing M&T to keep more loans on its books.
International Business Machines Corp. reported first-quarter earnings rose 8% but said slow U.S. capital spending held down results, raising concerns about leaner times ahead for companies like IBM that depend on robust business spending
...
The numbers were in line with expectations. But IBM's comments that it saw an unexpected U.S. sales slowdown in March caused analysts in the company's conference call to probe for hints about whether business spending is slowing broadly, with implications for the overall economy.
"Everything was going great until they started talking about weakness in U.S. enterprise spending, especially in financial and telecom which are economically sensitive," said Chris Whitmore, an analyst with Deutsche Bank. "It created a lot of concerns about that big-spending group." Mr. Whitmore noted that storage giant EMC Corp. also cited U.S. revenue weakness in reporting earnings yesterday.
Goldman Sachs downgraded IBM to neutral from buy, citing a slowdown in U.S. tech spending
Housing starts in the U.S. unexpectedly rose for a second month in March, bolstering expectations the worst housing slump in 15 years may be easing.
Builders broke ground on new homes at an annual rate of 1.518 million last month, an increase of 0.8 percent from February, the Commerce Department said today in Washington. Building permits, a sign of future construction, also rose 0.8 percent.
Unusually warm temperatures last month encouraged builders to start work on more homes, along with signs that demand is starting to firm as prices moderate. The Federal Reserve predicts the economy will pick up in the course of the year as the drag from housing diminishes, while warning that a wave of mortgage defaults poses a risk to their forecast.
The National Association of Home Builders/Wells Fargo index of sentiment fell to 33 from 36 in March, the Washington-based association said today. A reading below 50 means most respondents view conditions as poor.
Let me now turn to the inflation situation. Overall consumer price inflation has come down since last year, primarily as a result of the deceleration of consumers’ energy costs. The consumer price index (CPI) increased 2.4 percent over the twelve months ending in February, down from 3.6 percent a year earlier. Core inflation slowed modestly in the second half of last year, but recent readings have been somewhat elevated and the level of core inflation remains uncomfortably high. For example, core CPI inflation over the twelve months ending in February was 2.7 percent, up from 2.1 percent a year earlier. Another measure of core inflation that we monitor closely, based on the price index for personal consumption expenditures excluding food and energy, shows a similar pattern.
A measure of prices paid by U.S. consumers rose less than forecast last month, supporting the Federal Reserve's call that inflation will subside as the economy slows.
The 0.1 percent increase in core consumer prices, which exclude food and energy costs, was the smallest this year and follows a 0.2 percent February gain, the Labor Department said today in Washington. Prices overall rose 0.6 percent in March, led by a jump in fuel costs.
Less inflation may give Fed Chairman Ben S. Bernanke and his colleagues more latitude to lower interest rates to reinvigorate the economy in coming months, economists said. Cheaper clothing and hotel stays and a smaller gain in medical care costs restrained price gains last month, suggesting a slowing economy is starting to help alleviate price pressures.
A surge in gasoline costs helped drive overall U.S. consumer prices up at the sharpest
rate in nearly a year during March, though so-called core prices that exclude food and energy items rose at a muted pace, the Labor Department said on Tuesday.
The Consumer Price Index climbed at a 0.6 percent rate, up from 0.4 percent in February. It was the largest monthly increase since a matching 0.6 percent rise last April.
A 10.6 percent jump in gasoline prices last month eclipsed a 0.3 percent gain in February and was the largest increase in 1-1/2 years since a 17.4 percent gain in September 2005.
The Consumer Price Index for All Urban Consumers (CPI-U) increased 0.9 percent in March, before seasonal adjustment, the Bureau of Labor Statistics of the U.S. Department of Labor reported today. The March level of 205.352 (1982-84=100) was 2.8 percent higher than in March 2006.
.....
For the first three months of 2007, consumer prices increased at a seasonally adjusted annual rate (SAAR) of 4.7 percent. This compares with an increase of 2.5 percent for all of 2006.
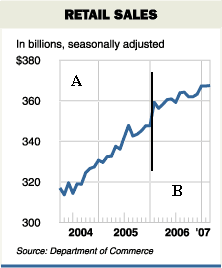
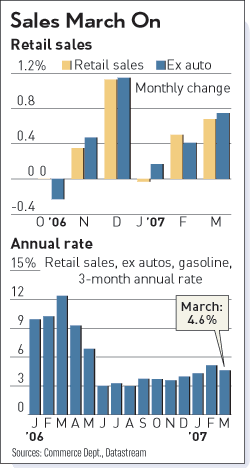
The government sharply raised its estimate of February retail sales, saying they rose 0.5%, instead of the previously reported 0.1%.
"It was a decent report, especially when you take into account the revisions," said Haseeb Ahmed an economist with J.P. Morgan Chase & Co. "It basically points to a consumer that is doing OK."
The latest numbers on consumer spending indicate that personal-consumption expenditures are growing at a rate of about 3%, slower than the 4.8% rate recorded in the first quarter of 2006.
Consumer spending, which accounts for about 70% of U.S. economic activity, has taken on greater importance in recent months because it is one of the economy's few remaining areas of strength. The decline in housing construction has taken a huge bite out of the economy over the past year and rising foreclosures are also expected to hurt economic growth.
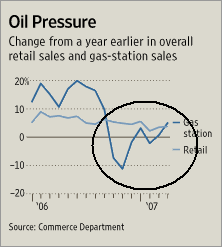
"Consumers may not be happy with high energy prices right now, or weakness in the housing market. But as long as the job situation is still really good they have the income to spend and they're spending it," said Gary Thayer, chief economist at A.G. Edwards.
An index of U.S. homebuilders' confidence fell to the lowest level of the year this month amid concern that an increase in mortgage defaults is resulting in tighter lending standards that are discouraging would-be buyers.
The National Association of Home Builders/Wells Fargo index of sentiment fell to 33 from 36 in March, the Washington-based association said today. A reading below 50 means most respondents view conditions as poor.
According to today's report, single-family home sales have fallen this month and builders' outlooks for the next six months are at the lowest level since October. That, along with rising defaults on subprime mortgages and excess inventory levels, suggests a greater drag on construction this year.
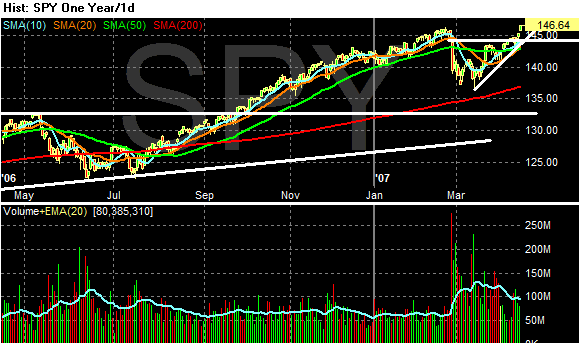
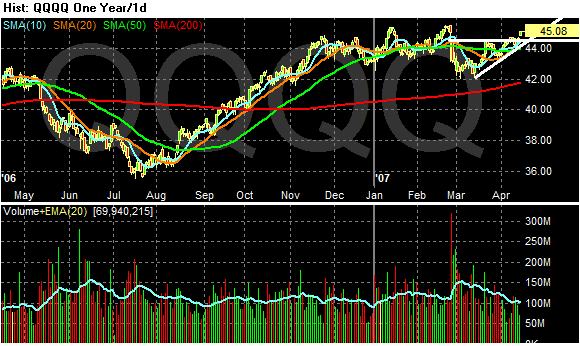
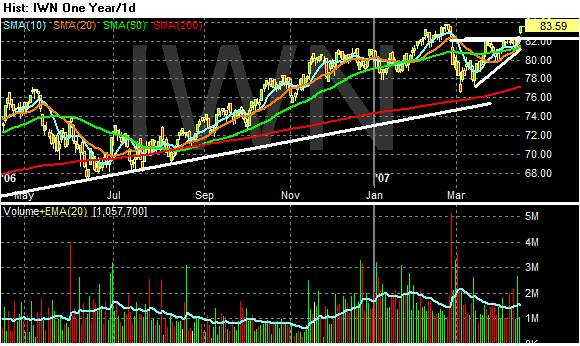
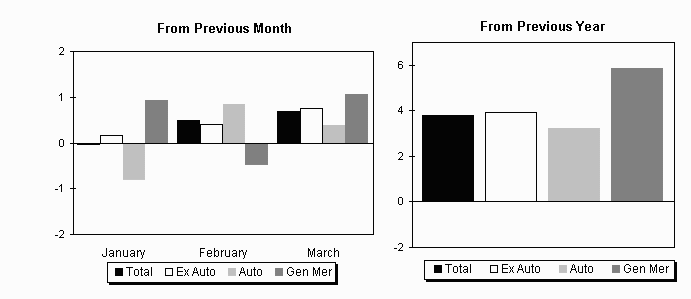
The U.S. Census Bureau announced today that advance estimates of U.S. retail and food services sales for March, adjusted for seasonal variation and holiday and trading-day differences, but not for price changes, were $371.6 billion, an increase of 0.7 percent (±0.7%)* from the previous month and up 3.8 percent (±0.7%) from March 2006. Total sales for the January through March 2007 period were up 3.2 percent (±0.5%) from the same period a year ago. The January 2007 to February 2007 percent change was revised from 0.1 percent (± 0.7%)* to 0.5 percent (± 0.2%).
Retail trade sales were up 0.6 percent (±0.7%)* from February 2007 and were 3.6 percent (±0.8%) above last year. Clothing and clothing accessories stores were up 8.0 percent (±1.5%) from March 2006 and sales of general merchandise stores were up 5.8 percent (±0.2%) from last year.
Personal income increased $65.4 billion, or 0.6 percent, and disposable personal income (DPI) increased $53.8 billion, or 0.5 percent, in February, according to the Bureau of Economic Analysis. Personal consumption expenditures (PCE) increased $55.5 billion, or 0.6 percent. In January, personal income increased $110.5 billion, or 1.0 percent, DPI increased $74.2 billion, or 0.8 percent, and PCE increased $50.2 billion, or 0.5 percent, based on revised estimates.
Truckload carrier US Xpress Enterprises Inc. said it would likely post a loss in the first quarter, which compares with a profit last year, citing lower-than-expected freight demand, severe winter weather and rising fuel prices. The news was not entirely unexpected, as the company usually experiences a rough start to the year and carriers throughout the sector have complained of similar headwinds.
The sector also witnessed a downgrade of J.B. Hunt Transport Services Inc. by Edward Wolfe at Bear Stearns, who took the stock to "Peer Perform" from "Outperform," due mostly to the 37 percent it has gained since the start of the year.
Americans face sizable increases in their grocery bills this year as a boom in ethanol production diverts more corn from the nation's dinner table to its gas tank. Indeed, their pocketbooks could feel the pinch for years to come.
High corn prices, bad weather and steep energy costs have combined to make food a bigger potential contributor to inflation this year than it has been at least since 2004, when a cutback in dairy production boosted dairy prices and beef prices rose as mad-cow disease disrupted trade.
The Agriculture Department says that retail food prices are likely to climb by 2.5% to 3.5% in 2007, fueled in part by strong demand for corn-derived ethanol. But Michael Swanson, an agricultural economist at Wells Fargo & Co., thinks the rise could be an even sharper 4.5%.
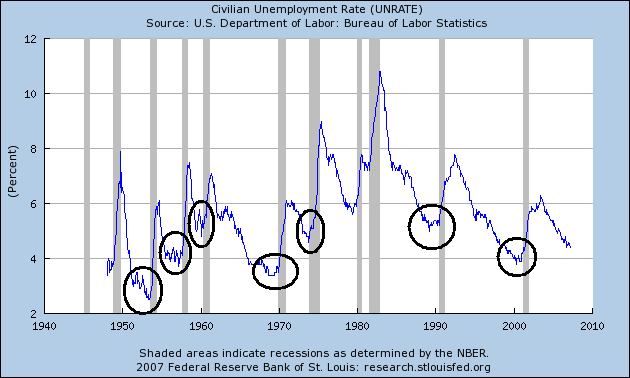
Corporate balance sheets, by almost any standard, couldn't be in much better shape than they are right now. If anything, you could make the case that corporate balance sheets aren't leveraged enough. There is too much cash on the balance sheet, there is not enough debt. It is hard to get a recession when corporate balance sheets are this clean. No. 2, employment is generally a lagging indicator, but the employment situation is so good. The unemployment rate is 4½%. When I got out of college, full employment was considered 5½% to 6%. It is hard to get a recession when both corporate and consumer balance sheets are as strong as they are and when people are employed.
With the Fed on hold, banks' net interest margins continue to come under pressure. "The dramatic loan growth banks have enjoyed also will slow, especially in consumer- or mortgage-related segments," Bagley says. Another direct hit to earnings could come from the greater reserves banks set aside for rising defaults or credit deterioration. While big banks with thriving investment-%banking operations might hold up well, smaller regional lenders will have a harder time.
The KBW Bank Index has slipped 4% since March 21 even as the market advanced, as inflation stayed firmer than investors hoped. The index fell Wednesday after minutes from a recent policy meeting showed the Federal Reserve still vexed by inflation and none too likely to begin cutting interest rates soon.
The potential for economic deceleration, a worsening housing market and inflation that keeps the Fed's hands tied could prove to be a "perfect storm" for banks, says Dan Jones, who runs Blue Water Asset Management. As a hedge, he suggests buying June put spreads on the bank index.
It may indeed be the case that banks will dodge any incoming bullets from the growing number of mortgage defaults, as many people argue. But evidence like this tells me that banks have a lot to lose if mortgages go bad.
Thanks to Federal mandates and subsidies, corn used for the production of corn ethanol is expected to increase from ~ 700 M Bushels in 2000/2001, to 3.2 B bushels in 2007/2008 – an increase of 357 percent. On December 11, 2006, the USDA estimated 2006-2007 U.S. ending stocks would be 935 million bushels, down from 1.97 billion bushels in 2005-2006. That decreases the ending stocks by more than 50 percent and puts the ending stocks to use ratio at 8%, - the lowest in 11 years. It should be obvious to all, we are going to need a lot more acreage and big yield improvements if corn production is going to keep up to demand. Prices could exceed $4.50 per Bu by the end of 2008. That’s a price increase of 125% over 2005/2006 season prices.
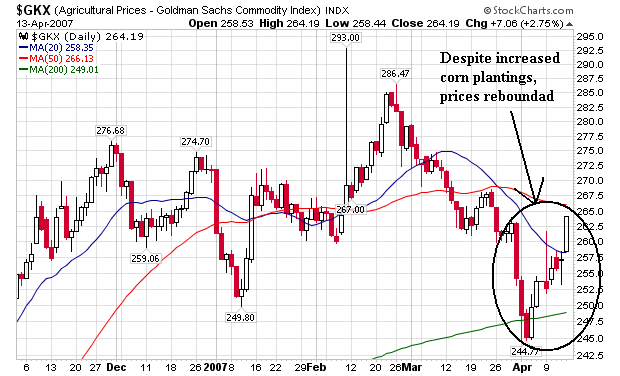
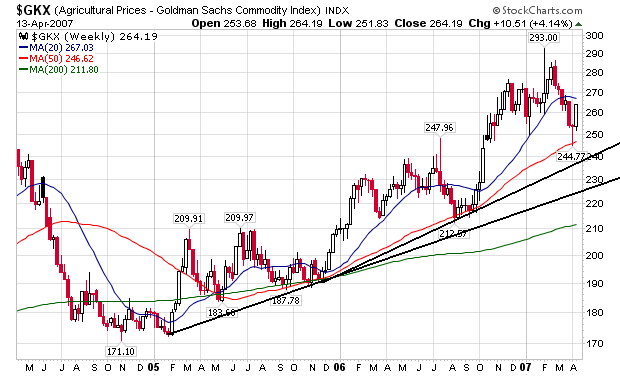
If corn prices increase by ~ 55 percent, year over year, then will the corn used for hog, cattle, chicken, turkey and fish feed go up 55 %? Doesn’t that increase the price of meat, poultry, fish, milk and eggs? If corn is used in corn meal, corn flakes, corn oil, and hundreds of other food items goes up 55%, doesn’t that increase the price of all these foods? Maybe. Since 2000, the price of beef is up 31%, eggs up 50%, corn sweeteners up 33%, wet corn milling up 39%, and corn flakes are up 10%. Chicken prices haven’t changed very much. Yet. Food producers are predicting higher prices.
Members agreed the statement also should indicate that inflation pressures seemed likely to moderate over time, but that recent readings on core inflation had been somewhat elevated and the high level of resource utilization had the potential to sustain inflation pressures. A persistence of inflation at recent rates could eventually have adverse consequences for economic performance. All members agreed the statement should indicate that the Committee’s predominant policy concern remains the risk that inflation will fail to moderate as expected. The Committee agreed that further policy firming might prove necessary to foster lower inflation, but in light of the increased uncertainty about the outlook for both growth and inflation, the Committee also agreed that the statement should no longer cite only the possibility of further firming.
The Committee agreed that further policy firming might prove necessary to foster lower inflation, but in light of the increased uncertainty about the outlook for both growth and inflation, the Committee also agreed that the statement should no longer cite only the possibility of further firming.
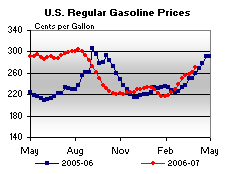
Gasoline prices saw another significant increase for the week of April 2, 2007, jumping 9.7 cents to 270.7 cents per gallon. This is the ninth consecutive week of increases; prices are now 11.9 cents per gallon higher than at this time last year. All regions reported higher prices. East Coast prices were up 9.6 cents to 267.1 cents per gallon, while Midwest prices rose 9.6 cents to 261.4 cents per gallon. The Gulf Coast saw the largest regional increase, with prices up 12.3 cents to 256.5 cents per gallon. In the Rocky Mountains, prices increased 8.1 cents to 261.9 cents per gallon. West Coast prices were up 8.0 cents to 309.6 cents per gallon, with the average price for regular grade in California up 7.6 cents to 322.8 cents per gallon, 48.5 cents per gallon above last year's price.
The International Energy Agency warned Thursday that output by the Organization of Petroleum Exporting Countries had hit its lowest level in over two years on production outages and self-imposed cuts, a factor likely to drain global oil stocks in the coming months.
In its monthly oil market report, the agency, the energy security watchdog for the Organization for Economic Cooperation and Development, highlighted unexpected product-led reductions in world oil stocks and what it described as "astonishing" demand growth in China, where it was forced to revise up its growth expectations for this year.
Unexpected production outages in Nigeria and maintenance in Saudi Arabia contributed to OPEC's daily output in March falling to a little over 30 million barrels, the lowest since January, 2005.
The Producer Price Index for Finished Goods increased 1.0 percent in March, seasonally adjusted, the Bureau of Labor Statistics of the U.S. Department of Labor reported today. This advance followed a 1.3-percent rise in February and a 0.6-percent decrease in January. The index for finished goods excluding foods and energy was unchanged in March after moving up 0.4 percent in February. At the earlier stages of processing, prices received by producers of intermediate goods increased 1.0 percent in March following a 1.1-percent advance a month earlier, and the crude goods index rose 3.2 percent after climbing 8.9 percent in February.
In light of the recent economic data and anecdotal information, the Committee agreed that the statement to be released after the meeting should note that economic indicators had been mixed, that the adjustment in the housing market was ongoing, and that the economy seemed likely to expand at a moderate pace over coming quarters. Members agreed the statement also should indicate that inflation pressures seemed likely to moderate over time, but that recent readings on core inflation had been somewhat elevated and the high level of resource utilization had the potential to sustain inflation pressures. A persistence of inflation at recent rates could eventually have adverse consequences for economic performance. All members agreed the statement should indicate that the Committee’s predominant policy concern remains the risk that inflation will fail to moderate as expected.
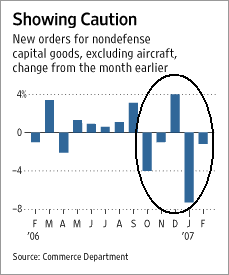
A new WSJ.com survey found that 20 of 54 economic forecasters responding to a query cited soft capital spending as the chief risk to their forecast that the U.S. economy will grow slowly but avoid recession this year.
Only 11 of the economists cited housing; the rest cited other threats, including inflation and oil prices.
Capital spending "scares me more than anything else because I can't explain the weakness," said Stephen Stanley of RBS Greenwich Capital.
The Federal Reserve has similar worries. "The magnitude of the slowdown [in capital spending] has been somewhat greater than would be expected given the normal evolution of the business cycle," Fed Chairman Ben Bernanke told Congress late last month. And the International Monetary Fund, cataloging the risks to the U.S. economy this week, noted "concerns that the current softness of business investment could be extended."
The softness extends across industries. Semiconductor maker Advanced Micro Devices Inc. said this week that it is reducing planned 2007 capital spending by $500 million to about $2 billion amid sharply lower first-quarter revenue and difficulty in taking market share from rival Intel Corp. That spending would, however, still be up from last year's $1.86 billion.
China reported a massive increase in its huge pile of foreign currency in the first three months of this year, a gain that includes as much as $73.3 billion in unexplained new funds that has confounded experts on the Chinese financial system.
The Chinese central bank, which already controls more financial assets than any other single institution in the world, said that its foreign-exchange reserves rose $135.7 billion in the first quarter -- more than half the increase for all of last year. That raised the total to $1.2 trillion by the end of March.
The rise is far more than economists had expected -- and than can be explained by the flows of money into the country reported already. An increase in foreign reserves shows that more money is flowing into China than out of it, with the excess ending up on account with the central bank. And plenty of money is coming into China, owing in part to its export prowess.
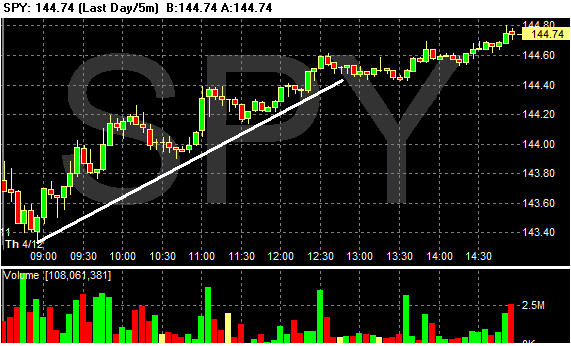
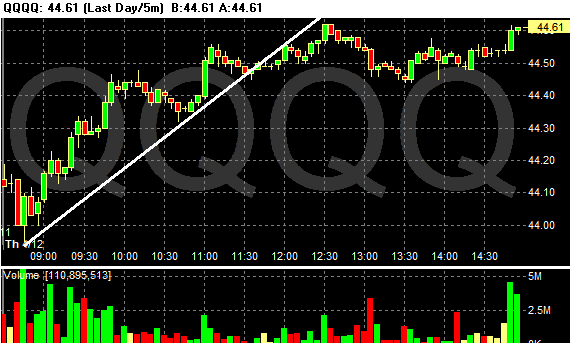
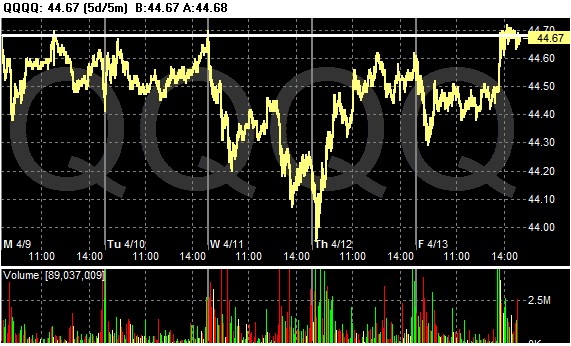
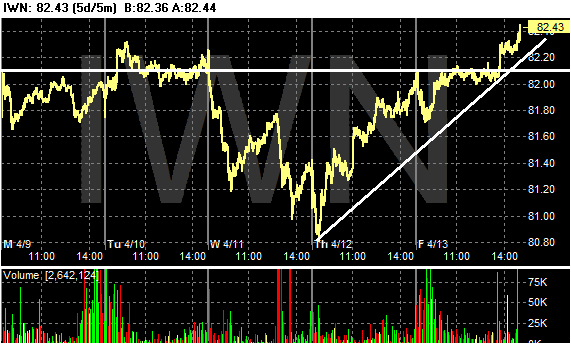
Does anyone believe that foreign buyers have suddenly started snapping up all of the industrial production which is theoretically pouring off American production lines. That's the only thing which might account for the purported rise in industrial production given the rest of this report. Business fixed investment and inventory builds and residential construction are down (and house sales too) which all mean domestic consumption of industrially-produced products are down too. Where's the growth source? Can anybody identify it? Is it restricted solely to light trucks and automotive? It sure looks like it and that's a pretty slender reed on which to base an economy. Or, is it restricted to kilowatt-hours and barrels of oil? That's an even more treacherous sink hole.
The U.S. Import Price Index rose 1.7 percent in March, the Bureau of Labor Statistics of the U.S. Department of Labor reported today. The increase followed a 0.1 percent rise in February and was led by an increase in petroleum prices. The price index for exports increased for the fifth consecutive month, advancing 0.7 percent in March.
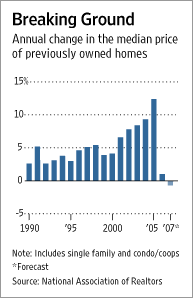
The National Association of Realtors, which has long proclaimed that U.S. home prices haven't declined on a nationwide basis since the Great Depression, now says they are likely to do just that this year.
The Realtors, which had been projecting as recently as February a 1.9% increase in the median home price this year, now say prices for previously occupied homes will slip 0.7% this year from the 2006 level.
The trade group's revised outlook, which puts it in line with a growing consensus that home prices will fall at least modestly this year, underlines how quickly expectations about the market have changed in light of a recent tightening of credit by mortgage lenders. Before the subprime mortgage problems blew up recently, said Lawrence Yun, an economist for the Realtors, the group expected the housing market to begin recovering by the middle of this year. Now, he says, recovery is unlikely before late this year.
The International Energy Agency warned Thursday that output by the Organization of Petroleum Exporting Countries had hit its lowest level in over two years on production outages and self-imposed cuts, a factor likely to drain global oil stocks in the coming months.
In its monthly oil market report, the agency, the energy security watchdog for the Organization for Economic Cooperation and Development, highlighted unexpected product-led reductions in world oil stocks and what it described as "astonishing" demand growth in China, where it was forced to revise up its growth expectations for this year.
Unexpected production outages in Nigeria and maintenance in Saudi Arabia contributed to OPEC's daily output in March falling to a little over 30 million barrels, the lowest since January, 2005.
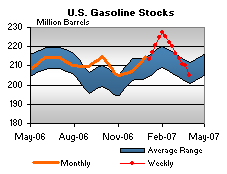
U.S. gasoline stockpiles fell 5.5 million barrels to 199.7 million barrels in the week to April 6, the biggest drop since Aug. 22, 2003, the U.S. Department of Energy reported yesterday. Supplies fell 12 percent the past nine weeks.
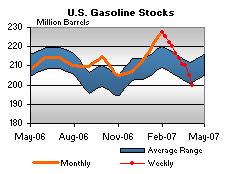
Gasoline demand, which peaks between the Memorial Day holiday in late May and Labor Day in early September, was close to 9.5 million barrels in each of the Energy Department's past two reports, a level not usually seen until June.
Gasoline prices were up again for the week of April 2, 2007, increasing 9.5 cents to 280.2 cents per gallon. This is the tenth consecutive week of increases; prices are now 11.9 cents per gallon higher than at this time last year. All regions reported higher prices. East Coast prices were up 8.4 cents to 275.5 cents per gallon. The Midwest had the largest regional increase, with prices rising 13.0 cents to 274.4 cents per gallon. Gulf Coast prices were up 11.0 cents to 267.5 cents per gallon, while Rocky Mountain prices increased 10.0 cents to 271.9 cents per gallon. West Coast prices were up 4.2 cents to 313.8 cents per gallon, with the average price for regular grade in California up 2.4 cents to 325.2 cents per gallon, 44.1 cents per gallon above last year's price.
Participants agreed that risks around the expected and desired path of a gradual decline in core inflation remained mainly to the upside; some noted that upside risks to inflation appeared to have increased slightly in recent months.
Most participants continued to expect a gradual decline in core inflation over the next year or two, fostered by stable inflation expectations, a likely deceleration in shelter costs, and a slight easing of pressures on resources. Nonetheless, all meeting participants expressed concern about the risks to this outlook. The latest readings on core inflation were higher than expected, and it was difficult to discern whether the apparent downward trend in core inflation during the past few quarters was continuing. Also, the recent increases in prices for energy and some non-energy imports likely would boost overall inflation in the near term and might put upward pressure on prices of some core goods and services. Moreover, rates of resource utilization that were near the high end of historical experience suggested a possibility that inflation pressures could build. Participants agreed that risks around the expected and desired path of a gradual decline in core inflation remained mainly to the upside; some noted that upside risks to inflation appeared to have increased slightly in recent months.
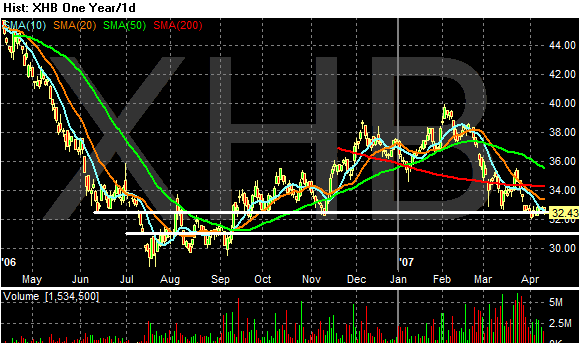
KB Home's (KBH 41.96) chief executive, Jeffrey Mezger, said Tuesday he expects the housing market to get worse before it gets better, even though sales have improved in some areas of the U.S. Shares of the Los Angeles-based builder were indicated more than 2% lower following the announcement, which comes a day after DR Horton (DHI 21.70), the nation's largest homebuilder, warned of a sharp drop in new home orders, and said the spring selling season is off to a slow start as market conditions remain challenging.
As earnings season got underway Tuesday with better-than-expected quarterly results from Alcoa, analysts said many other companies are likely to exceed their sharply lowered forecasts.
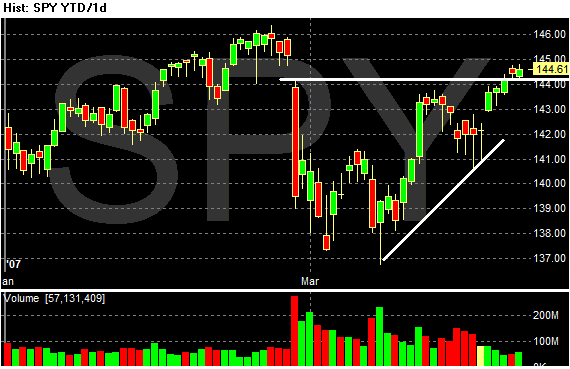
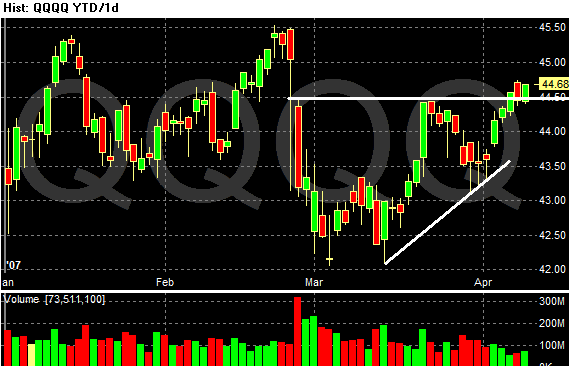
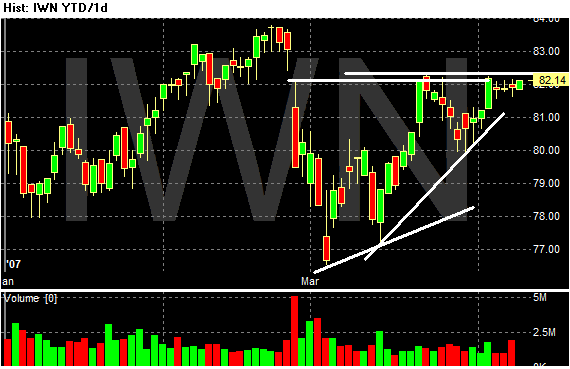
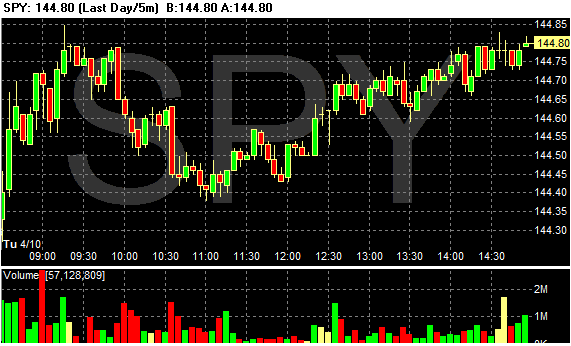
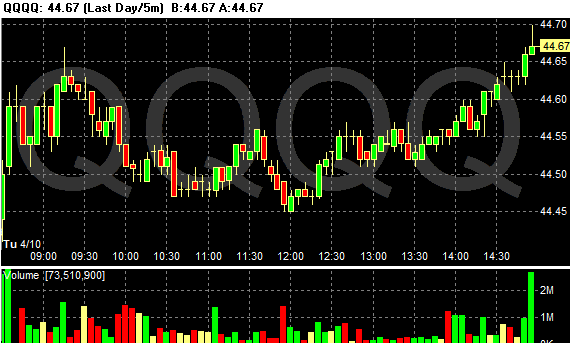
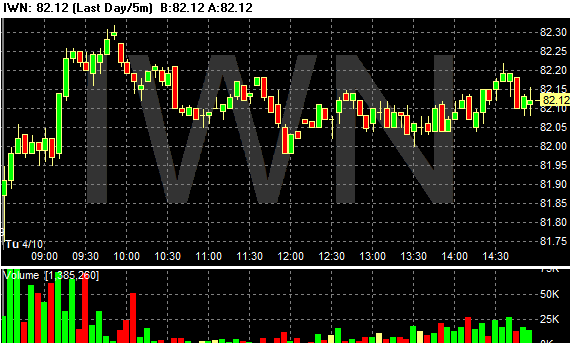
During the first quarter, foreclosures have jumped sharply across the nation’s top urban markets, according to a PropertyShark.com report released to CNBC.
In Miami, foreclosures are up nearly 31%, in Los Angeles 24%, and in New York City, up 56%, the website said. Properties in the borough of Queens accounted for the bulk of the New York foreclosures, jumping 91% alone.
Miami experienced the highest quarterly foreclosure rate per household. In Miami-Dade County, there were 987 residential auctions in the first quarter, which translates into 127 foreclosures per 1,000 households. Miami typically has foreclosure rates higher than the national average because it attracts investors that buy into properties before they’re developed with hopes of flipping them later at a profit.
The percentage of mortgages in default rose to 2.87%, surpassing the worst levels following the 2001 recession.
“The news is unremittingly bad,” CNBC's Steve Liesman said Tuesday. “Delinquency rates were up in 44 of the 50 states.”
The only states where delinquencies didn’t increase were Kansas, Kentucky, Montana, North Dakota, South Carolina and Utah.
The states with the highest delinquency rates are:
Mississippi, 4.85%
Texas, 4.09%
Michigan, 4.06%
Georgia, 3.89%
West Virginia, 3.83%
Most Americans expect a recession within a year and disapprove of President George W. Bush's handling of the economy even though the unemployment rate is at a five-year low, a new Bloomberg/Los Angeles Times poll found.
Six in 10 who were surveyed predicted a recession, similar to the 64 percent who anticipated the economy would contract in a December 2000 poll by the Los Angeles Times three months before the last decline. In the current survey, 71 percent of those earning less than $40,000 said they expect a recession compared with about half for those making more than $100,000.
``We're living on borrowed time,'' said Andrew Herring, 43, a chemical engineering professor at the Colorado School of Mines in Golden, Colorado, who took part in the survey. ``We spend ridiculous amounts of money on the war and now we have issues with the subprime housing market,'' said Herring, a Democrat.
D.R. Horton Inc., the nation's largest homebuilder by deliveries, said Tuesday its second-quarter sales orders fell 37 percent, led by even steeper declines in California and the Southwest.
We continue to sell more homes than any other builder, even though the spring selling season has not gotten off to its usual strong start," Chairman Donald R. Horton said in a statement.
Net sales orders for the quarter ended March 31 totaled 9,983 homes, down from 15,771 homes during the prior-year quarter. The value of the orders dropped to $2.6 billion from $4.4 billion in the previous year.
Net sales orders for the first six months fell to $4.9 billion, or 18,754 homes, from $7.5 billion, or 27,234 homes during the same period in fiscal 2006.
[American Home Mortgage] The lender slashed Q1 profit targets to 40-60 cents a share, below views of $1.01. It struggled to sell mortgages and will stop making some "alt-A" loans due to losses. M&T Bank, which also makes many "liar loans," cut views last week, citing trouble selling mortgages. These warnings raise concerns that lending woes are spreading beyond subprime. American Home fell 15%.
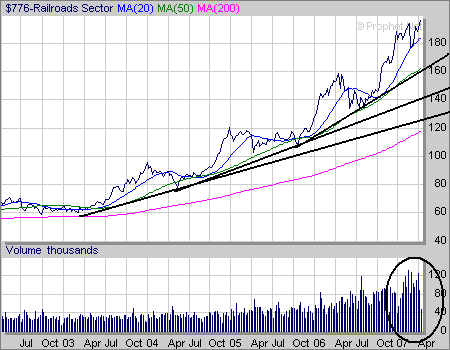
Warren Buffett is taking a ride on the rails.
Railroad operators have benefited in recent years from a boom in overseas demand for commodities, U.S. hunger for foreign goods and restrained competition from their big rival, trucking. And thanks to earlier waves of consolidation that left only a handful of public U.S. railroad companies, their earnings and their stocks have attracted investor attention.
So, the billionaire investor's bet on Burlington Northern Santa Fe Corp. is the latest sign that the resurgence in railway stocks has some strength over the long haul.
.......
"The business model is a good value at this price, with not much substitute product out there in terms of competition, and it has pricing power," says David Carr, co-manager of the Oak Value Fund, part of Oak Value Capital Management, which has net assets of $148 million. Berkshire makes up 9% of the fund.
China's trade surplus almost doubled in the first quarter, adding to friction as the U.S. takes complaints against its second-largest trading partner to the World Trade Organization.
The surplus widened to $46.4 billion from $23.3 billion a year earlier, the customs bureau said on its Web site today. The March gap was $6.87 billion, smaller than economists expected.
.....
Chinese businesses rushed to sell products overseas in January and February in anticipation of government measures to slow exports and because of protectionist sentiment abroad, said Wang Qing, an economist at Bank of America Corp. in Hong Kong.
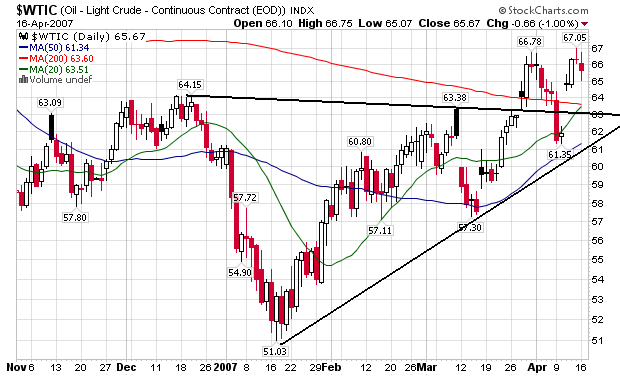
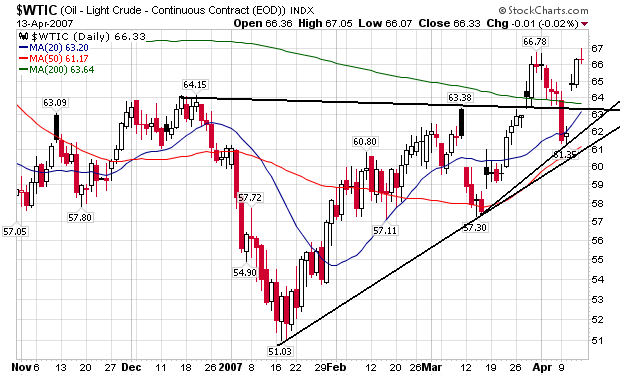
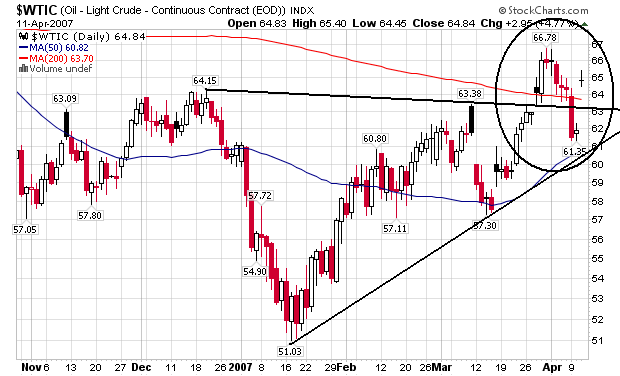
Crude oil plunged $2.77 a barrel in New York, the biggest decline in three months, on speculation that an Energy Department report will show U.S. inventories jumped last week as refiners unexpectedly shut units.
Crude-oil supplies in Cushing, Oklahoma, where oil traded in New York is delivered, surged 12 percent in the week ended March 30, Energy Department figures show. Fires and power outages have forced refiners to shut units, reducing crude-oil demand. Oil prices also fell because release of British naval personnel on April 5 eased concern of a supply disruption in the Persian Gulf.
``Crude oil is pulling everything lower,'' said James Ritterbusch, president of Ritterbusch & Associates in Galena, Illinois. ``It looks like we will see record inventories in Cushing this week because of all of the refinery outages.''
We heard last month from semiconductor company Advanced Micro Devices (AMD 13.40, +0.54) that it expected to fall short of its previous first quarter revenue forecast of $1.6 billion to $1.7 billion. AMD didn't provide any specific guidance at the time, but today, it has offered some granularity saying it expects revenues to be approximately $1.225 billion.
The updated guidance is nearly 25% below the mid-point of its original guidance range and marks a 31% decline form the fourth quarter. In turn, it falls well below the current Reuters Estimates consensus estimate of $1.54 billion.
.....
This isn't good news, yet shares of AMD are trading higher in response to the additional announcement from the company that it will be restructuring to increase operational efficiencies and to lower its operating cost structure. As part of this plan, AMD will reduce 2007 capital expenditures by roughly $500 million, significantly reduce discretionary expenses, and limit hiring to critical positions.