Showing posts with label import prices. Show all posts

Friday, February 20, 2009

Import, Producer and Consumer Price Round-Up

From the BLS:

Import prices fell 1.1 percent in January and 23.4 percent over the past six months. For the sixth consecutive month, petroleum prices and nonpetroleum prices decreased, falling 2.4 percent and 0.8 percent, respectively, in January. However, prices for both overall imports and petroleum decreased at a smaller rate in January than in each of the previous five months since prices last rose in July. Petroleum prices fell 69.1 percent over the past six months and 55.0 percent over the past year, the largest 12-month decline since the index was first published in June 1982. Overall, import prices fell 12.5 percent for the year ended in January, the largest 12-month decline since the index was first published in September 1982. Nonpetroleum prices decreased 5.7 percent over the past six months and 0.6 percent over the past year.

The 0.8 percent January decrease in nonpetroleum prices was led by a 4.8 percent drop in the price index for nonpetroleum industrial supplies and materials. Falling prices for chemicals and natural gas were the largest contributors to the decline. Nonpetroleum industrial supplies and materials prices decreased 7.6 percent over the past year, led primarily by declining unfinished metals prices.

In contrast, prices for automotive vehicles increased in January, rising 0.2 percent after decreasing the previous two months. For the year ended in January, the index increased 0.7 percent.

The price indexes for consumer goods, capital goods, and foods, feeds, and beverages were unchanged in January. Over the past year, consumer goods prices increased 1.5 percent, capital goods prices advanced 0.9 percent, and prices for foods, feeds, and beverages rose 3.3 percent.


Looking at the BLS' end use tables we see drops in industrial supplies and goods but increases in capital goods, autos and consumer goods. However, all imports excluding fuels and all imports excluding petroleum have been decreasing for the last four months.

Non-manufactured articles dropped 45.9% year over year.

Manufactured articles dropped 3.7% year over year.

Here's the chart from Econoday:


From the BLS:

The Producer Price Index for Finished Goods rose 0.8 percent in January, seasonally adjusted, the Bureau of Labor Statistics of the U.S. Department of Labor reported today. This increase followed declines of 1.9 percent in December and 2.5 percent in November. At the earlier stages of processing, the decrease in prices for intermediate materials slowed to 0.7 percent from 4.2 percent in the prior month, and the index for crude materials declined 2.9 percent after dropping 5.3 percent in December.


What makes this news less scary is that core PPI has been increasing for the last five months when we've been seeing large decreases in the overall PPI. However, core prices of intermediate goods have been decreasing for the last four months and core prices of crude goods decreased throughout the fourth quarter of 2008 while ticking up slightly last month. In other words, there could be downward pressure on prices over the next few months.

Here are the relevant charts from Econoday:


From the BLS:

The Consumer Price Index for All Urban Consumers (CPI-U) increased 0.4 percent in January, before seasonal adjustment, the Bureau of Labor Statistics of the U.S. Department of Labor reported today. The January level of 211.143 (1982-84=100) was virtually unchanged from January 2008.


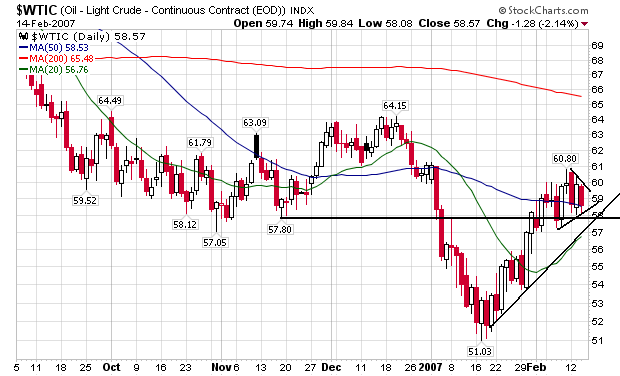
The good news here is core prices are still positive for the last 8 months. This tells us that price drops are occurring in the food/energy area rather than overall. A big reason for the drop in CPI over the last half of 2008 was transportation costs. Here is a chart of gas prices from that period:


In addition, although agricultural prices have dropped over the same period:


They have remained positive in the CPI numbers over the last half of 2008.

Friday, July 13, 2007

Import Prices Increase

From the BLS:

Import prices rose 1.0 percent in June, the fifth consecutive increase for the index. Petroleum prices were also up for the fifth month in a row, increasing 4.7 percent in June after a 3.7 percent advance the previous month. After declining at the end of 2006, the price index for import petroleum rose 28.1 percent from January through June. However, the index was only up 2.1 percent over the past year compared to a 33.7 percent increase over the previous 12 months. Nonpetroleum prices also advanced in June, rising 0.2 percent after advancing 0.5 percent in May. Prices for nonpetroleum imports increased 2.6 percent for the year ended in June, while overall import prices rose 2.3 percent for the same period.


Once again, a report brings into focus the ridicules obsession with core inflation at the expense of the whole picture. Import oil prices are up 28.1% this year. But according to the Fed, this increase is not important.

Thursday, April 12, 2007

Import Prices Surprise on the Upside

From the BLS:

The U.S. Import Price Index rose 1.7 percent in March, the Bureau of Labor Statistics of the U.S. Department of Labor reported today. The increase followed a 0.1 percent rise in February and was led by an increase in petroleum prices. The price index for exports increased for the fifth consecutive month, advancing 0.7 percent in March.


Petroleum prices -- which increased 9% -- were the primary reason for the increase. Non-petroleum prices increased .3%.

Short version -- this report is not good, especially in light of the Fed's FOMC minutes released yesterday.

Wednesday, March 14, 2007

Import Prices Surprise on the Downside

From the BLS:

The U.S. Import Price Index rose 0.2 percent in February, the Bureau of Labor Statistics of the U.S. Department of Labor reported today. The increase followed a 0.9 percent decline in January and was led by an upturn in petroleum prices. The price index for exports increased for the fourth consecutive month, advancing 0.7 percent in February.


The best part of this report was the year over year change. From February 2006 to February 2007 import prices increased 1.3%.

However, take a look at the statements on oil:

Prices for imports increased 0.2 percent in February as a 2.0 percent increase in petroleum prices more than offset a modest decline in nonpetroleum prices. The advance in petroleum prices followed declines in four of the previous five months, and despite the February upturn petroleum prices decreased 2.6 percent over the past year.


Take a look at the chart below on oil. Remember we're going into the summer driving season.

From Bloomberg:

Prices of U.S. imports rose less than forecast in February, held down by lower costs for metals and machinery that may help keep a lid on inflation.

The 0.2 percent increase followed a 0.9 percent drop in January, the Labor Department said today in Washington. Prices excluding petroleum fell 0.1 percent. Separate figures from the Commerce Department showed the current-account deficit shrank last quarter to $195.8 billion.

The cheapest imported business equipment in almost a year is among factors that may make it easier for the Federal Reserve to keep interest rates unchanged. Policy makers will see reports on wholesale and consumer prices in coming days as they prepare for next week's interest-rate meeting.

``This is definitely a Fed-positive report,'' said Ellen Zentner, an economist at Bank of Tokyo-Mitsubishi UFJ Ltd. in New York. ``It supports the case for the Fed to sit tight and continue to watch inflation pressures recede.''


I would add, this is a Fed positive report for now. Oil still remains a wild card in deck.

Thursday, February 15, 2007

Import Prices Decrease 1.2%

From the Department of Labor:

Import prices fell 1.2 percent in January after increases of 1.1 percent and 0.5 percent, respectively, in December and November. A 7.3 percent decrease in petroleum prices drove the overall January drop, as petroleum prices resumed a recent downward pattern after increasing 4.6 percent in December. Nonpetroleum prices were unchanged in January after a 0.5 percent advance the previous month. Prices for nonpetroleum imports rose 1.6 percent over the 12 months ended in January.


Let's look at a chart of oil to see if this trend will continue:

Photobucket - Video and Image Hosting

Oil bottomed in mid-January around $52/bbl. Since then it has broken through technical resistance in the $57/bbl area. Currently it's still in an uptrend and appears to be consolidating its gains in the $58-$60 area.

In other words, so long as oil remains at or near current levels we can't expect this inflation number to repeat. In addition, this month's increase more or less canceled out last months increase, so we'll be back to square one next month.

However, this news should add fuel to the "inflation is decreasing from natural factors" bulls from yesterday.

Friday, January 12, 2007

Import Prices Up 1.1%

From the BLS:

Import prices rose for the second consecutive month in December and the 1.1 percent increase was the largest monthly advance since May. The price index for overall imports also increased for the fifth straight year in 2006, advancing 2.5 percent after more substantial increases of 8.0 percent and 6.7 percent in 2005 and 2004, respectively.

A 4.8 percent increase in petroleum prices was the largest contributor to the overall December rise. Petroleum prices resumed their upward trend after declining 21.5 percent for the three-month period ended in November. The index rose 6.2 percent overall in 2006, the fifth consecutive year the index advanced, but the smallest annual increase over that period.

Nonpetroleum prices increased 0.4 percent in December after a 0.9 percent advance the previous month. Prices for nonpetroleum imports rose 1.7 percent over the past 12 months after advancing 2.4 percent and 3.7 percent in 2005 and 2004, respectively. The December increase in nonpetroleum prices was driven by a 1.5 percent rise in nonpetroleum industrial supplies and materials prices. That advance in turn was led by higher prices for natural gas, up for the second consecutive month, metals and chemicals prices. The price index for nonpetroleum industrial supplies and materials increased 4.5 percent over the past year.


There is good news for Fed watchers in this report. Note that nonpetroleum import prices are showing a decreasing trend. On an annual basis, they rose 3.7% in 2004, 2.4% in 2005 and 1.7% in 2006. That annual trending decrease may rekindle speculation about a rate cut in the coming year.

In addition, oil prices have dropped in a big way since the beginning of the year. Depending on oil's price action for the remainder of the month, this may make the 1.1% increase in December nothing more than statistical noise.

The December to December percent changes in commodity imports was 2.5% for 2006, which is a decrease from the 8% increase in the December to December 2005 period. A decrease in oil prices is the primary reason for the drop.

Thursday, December 14, 2006

Import Prices Up .2%

From the BLS

Import prices rose 0.2 percent in November following the petroleum driven declines of 2.3 percent and 2.2 percent in October and September, respectively. The index for overall imports increased 1.2 percent over the past 12 months. Petroleum prices fell a more modest 1.6 percent in November compared to the double-digit declines recorded in the prior two months. Despite the recent downturn, petroleum prices advanced 1.5 percent for the year ended in November. Nonpetroleum prices resumed an upward trend in November, following a 0.5 percent decline in October, rising 0.7 percent for the month and 1.3 percent over the past year.


Oil is obviously the most variable part of this number. Oil decreased 10.9% in September, 10.1% in October and 1.6% last month. This decrease is the primary reason for the decrease in import prices over the last few months.

Oil is the central problem with oil prices. I've said it before, and frankly I'll keep saying it probably for the rest of my life. So long as the US is a major oil importer, we are one geo-political crisis away from major problems.

The .2% increase should help to calm any fears of a Fed raising. However, the .7% rise ex-oil may lead to a different conclusion. However, total imports are about 13% of the US economy. In other words, this is a number to keep you eyes on, but don't overstate its importance.

Gold Star For Redfish. From Bloomberg:

Import prices rose 0.2 percent after falling more than 2 percent in each of the two prior months, the Labor Department said today in Washington. Excluding petroleum, the index rose 0.7 percent following a 0.5 percent decline the prior month.

Prices of natural gas, which is in the non-petroleum category, soared 30.3 percent, the biggest increase since November 2004. A weaker dollar also boosted the tab on imports. The Federal Reserve this week kept its benchmark rate unchanged for a fourth consecutive policy meeting and said ``inflation risks'' remained.

``The recent sharp drop in the dollar suggests some upside risk to trade prices through year-end and into early 2007,'' Mike Englund, chief economist at Action Economics LLC in Boulder, Colorado, said before the report.