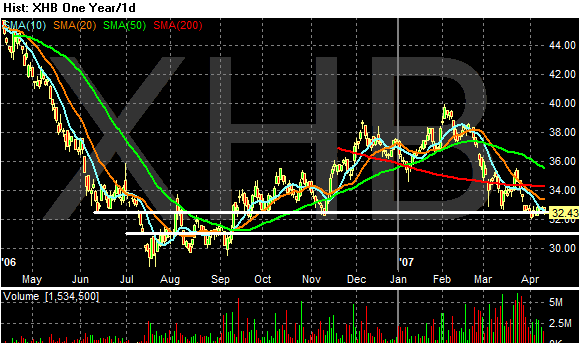
1.) The chart is clearly in a downtrend.
2.) Prices are consolidating around a technical level established 10 months ago.
3.) Prices are trading below all the simple moving averages.
4.) the 10, 20 and 50 day SMA are all heading lower.
The above 4 factors are all bearish. The only positive element on this chart is the decreased volume over the last 5 or so trading days. That indicates the big selling might be over and the average will limp along for awhile.
