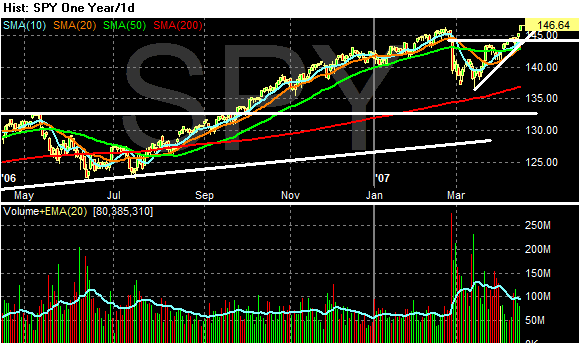
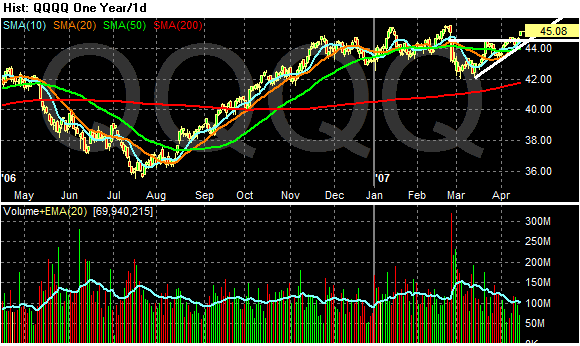
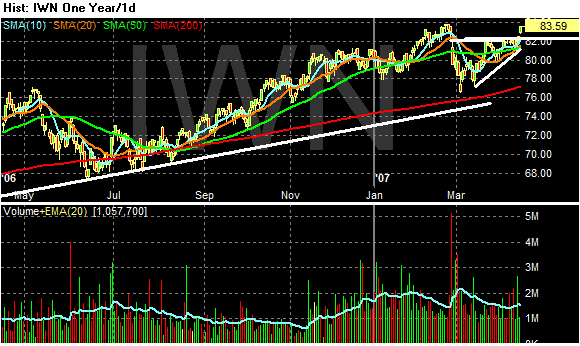
I exaggerated the 1-year charts of the SPYs, QQQQs and IWNs to highlight the volume of the post-China rally. Notice how the volume's 20-day EMA has been decreasing for the duration of the rally. While this is usually a bearish sign, keep in mind volume levels are coming down from high levels from the China sell-off.


