A theory which says the market is in an upward trend if one of its averages (industrial or transportation) advances above a previous important high, it is accompanied or followed by a similar advance in the other.
Basically, more than one average has to advance for the market to be in a rally. This makes basic economic sense. When the economy is expanding, businesses have to ship more and more stuff from point A to point B. The converse is also true; when the economy is slowing, businesses have to ship less and less stuff from point A to point B. That's why the following news items have caused me some concern:
United Parcel Service Inc (NYSE:UPS - News) warned on Monday that second-quarter earnings would be below expectations, blaming high fuel prices and a sluggish U.S. economy.
.....
UPS estimated earnings of 83 cents to 88 cents a share for the quarter, down from a prior view of 97 cents to $1.04 per share.
In a statement, UPS said U.S. package volume had been lower than expected, while demand for higher-priced air delivery services had seen a particular drop.
Keith Schoonmaker, an analyst at Morningstar, said the warning from UPS was hardly a surprise, given the monstrous head winds the industry faces.
"This just shows that in a challenging economic environment, with high fuel prices, that some customers are shifting to slower, cheaper shipping alternatives" within both UPS and its rivals, he said.
And add this to the mix:
FedEx(FDX - Cramer's Take - Stockpickr) says it will miss analysts' estimates for the current quarter and for fiscal 2009, as the continuing impact of high fuel prices and a weak economy drag on.
"We're pressured by serious economic difficulties," said CEO Fred Smith, on an earnings conference call. "Record high fuel prices and the weak U.S. economy dampened volume growth and substantially affected our bottom line."
Smith added that the "economic headwinds" the company is facing this year will continue into fiscal 2009. But he noted that results during this year and next "will be anomalies" that will "hopefully set the stage for fiscal year 2010."
That makes this an opportune time to take a look at the Transportation average.

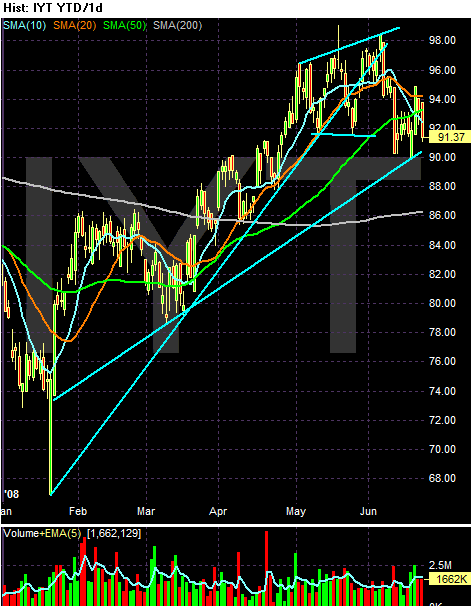
On the 6-month chart, notice the average has been rallying since the first part of the year. There are two important trend lines. The first is from the extreme bottom in mid-January. While this is technically a place to draw a trend line from, I'm always reluctant to draw a line from a point this extreme on a chart. I think the more accurate line is the second line started just after the extreme point.
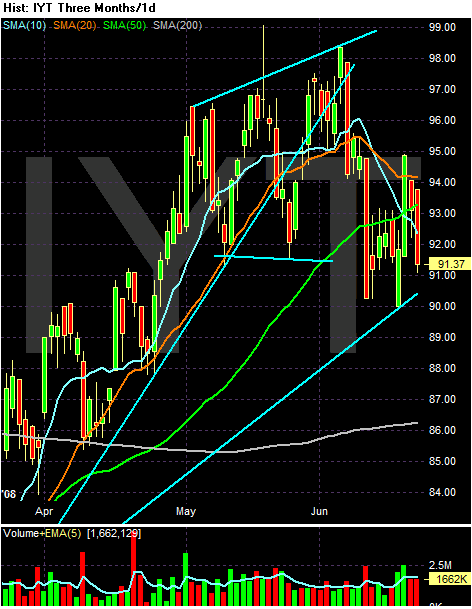
Using the first trend line (the one from the extreme point) notice the average broken trend in mid-May. Using the second line, notice prices are right at the trend line. Also note the broadening formation that formed in May, which is usually indicative of a market top.

On the SMA chart, notice the following:
-- Prices are above the 200 day SMA
-- The 10 and 20 SMA have moved lower
-- The 10 day SMA has crossed below the 50 day SMA
-- The 50 and 200 day SMA are still positive
-- Prices are SMAs are bunched in a close range
What does all of this tell us?
-- The short term trend is down as indicated by the declining 10 and 20 day SMA
-- The overall trend is still higher
-- Whenever prices and SMAs are bunched together in a tight range it indicates the market is looking for a direction about where to move.