The Committee expects inflation to moderate later this year and next year. However, in light of the continued increases in the prices of energy and some other commodities and the elevated state of some indicators of inflation expectations, uncertainty about the inflation outlook remains high.
Markets took this as the Fed nothing up their inflation fighting rhetoric. In essence, the Fed was saying "we're pretty much done lowering rates; our next move will be higher. We're not doing that today, but we're closer to doing that now than yesterday."
Let's take a look at the charts:

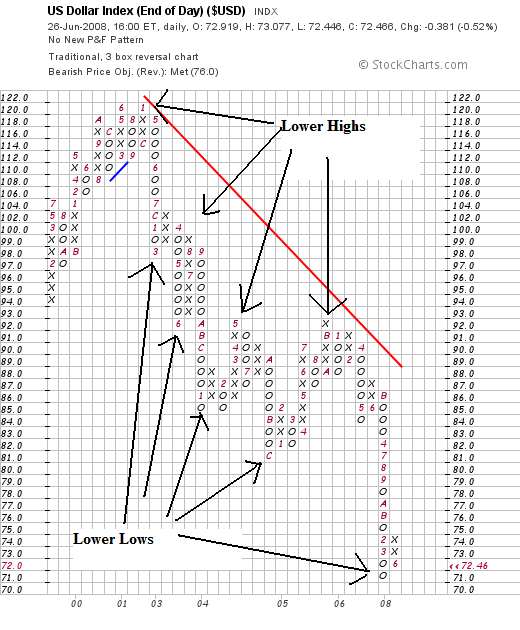
Let's start with the P&F chart, which is a great way to cut out the market noise and see what prices are really doing. With the P&F chart, notice the dollar has been dropping since 2001. Combine that with the fact the US experienced an expansion starting at the end of 2001 and you get an idea for how deep the problems with the dollar go.

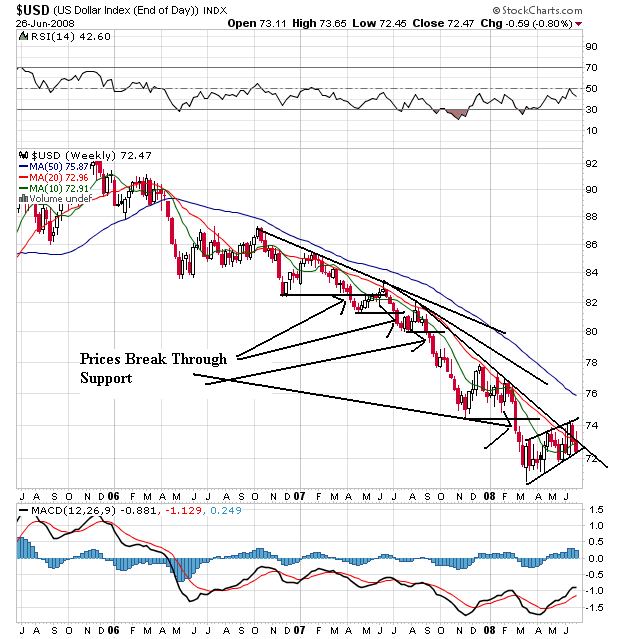
On the weekly chart, notice the following:
-- Prices have been dropping for the better part of two years, continually moving through support levels to establish new lows
-- Prices have been using the 10 and 20 week SMA as resistance areas
-- The 20 and 50 week SMA are currently moving lower
-- The 10 week SMA is moving up and is about to cross over the 20 week SMA. This is a positive development. However...

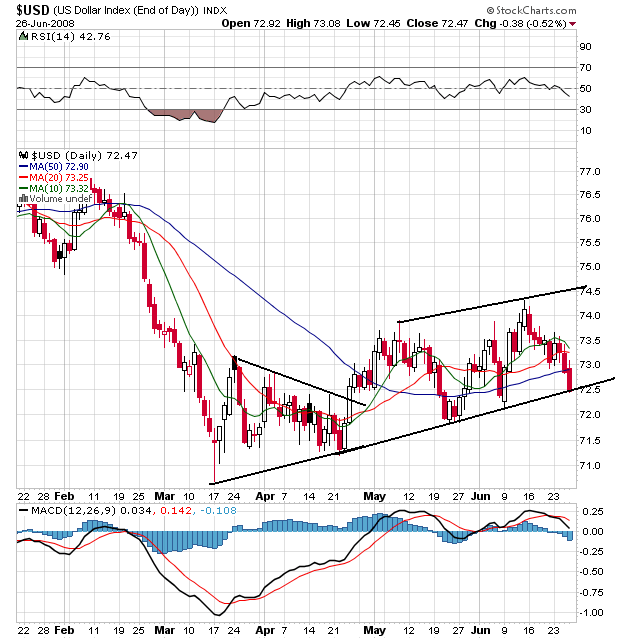
The dollar is at the bottom of a consolidation range with the momentum indicators giving an overbought signal. The SMAs are giving a counter-veiling signal. All three are generally moving up. However, I think this week's fundamental events (the Fed leaving rates unchanged) adds downward pressure.