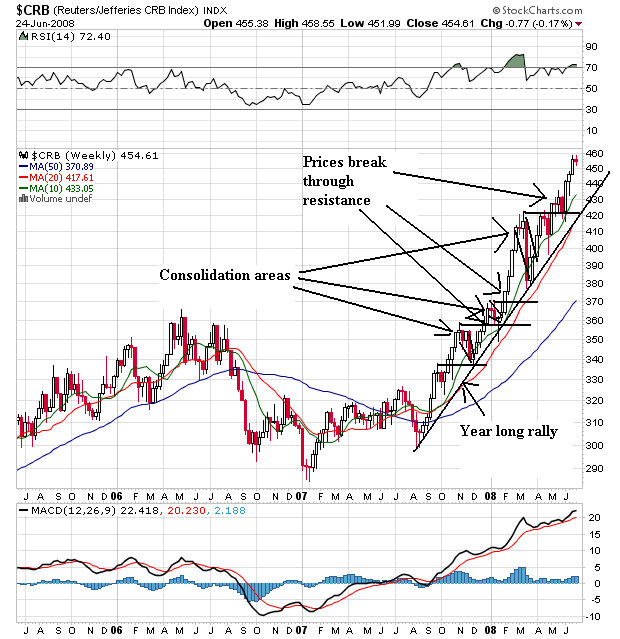
The weekly CRB chart shows a very strong rally that started about a year ago. Note that prices have continually moved higher, broken through resistance and consolidated gains. Regrading the SMA, notice the following:
-- All the SMAs are moving higher
-- The shorter SMAs are above the longer SMAs
-- Prices are above all the SMAs
This is a bullish chart, plain and simple.
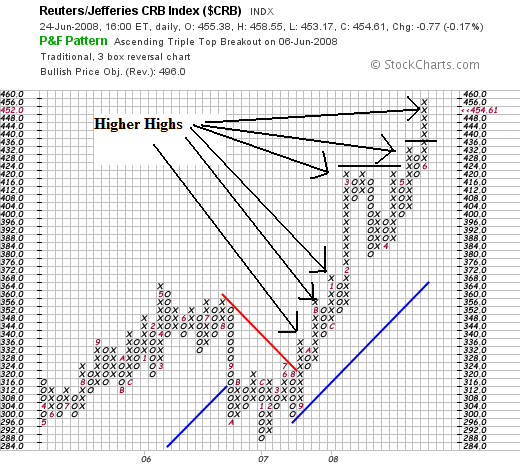
On the P&F chart, notice that prices have continually made higher highs.
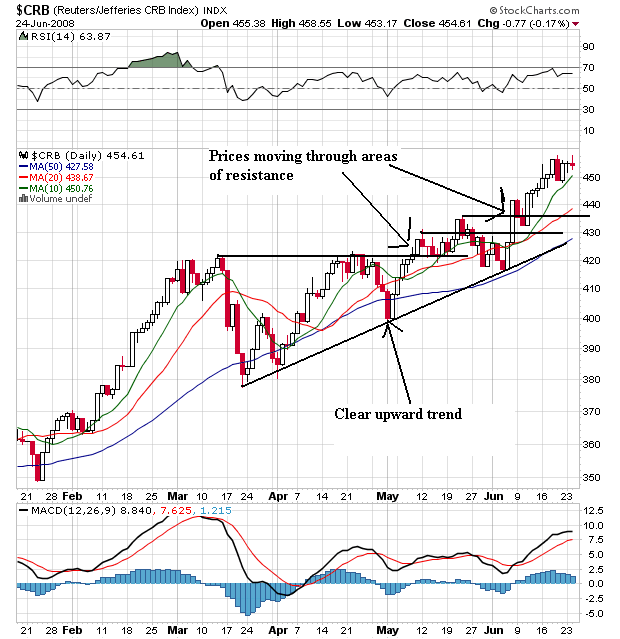
On the daily chart, notice that prices had a hard time getting through the 120 - 130 area, but have now broken out of this level. On the SMA front, notice the following:
-- All the SMAs are moving higher
-- Prices are above the SMAs
-- The shorter SMAs are above the longer SMAs
This is a bullish chart.
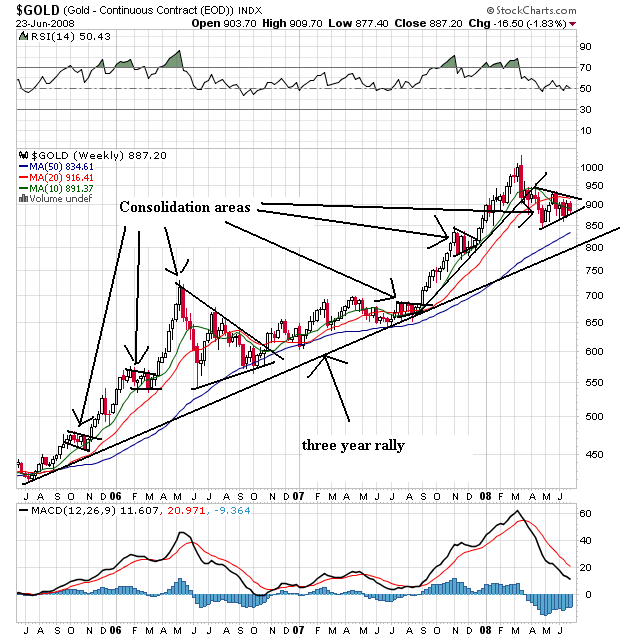
Gold is in the middle of a multi-year rally. It has continually moved higher, breaking through resistance and consolidating gains.
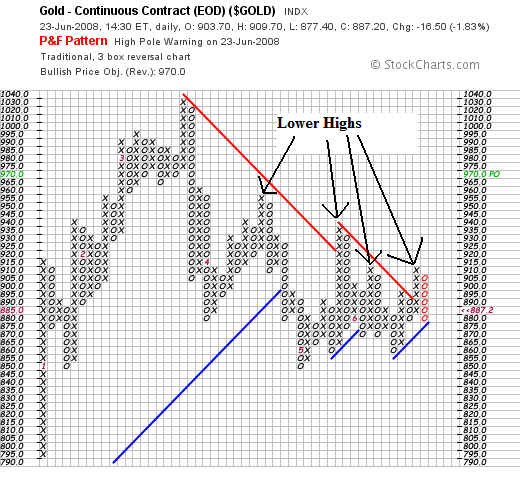
However, the P&F chart shows gold is in the middle of a correction from its rally with ha series of lower highs.
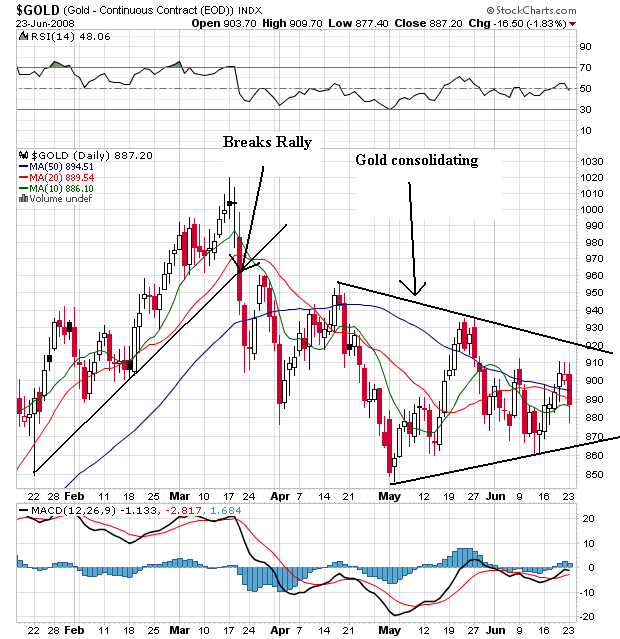
Gold's daily chart shows prices are currently in the middle of consolidating. Also note that prices and the SMAs are bunched together indicating a clear lack of direction.