-- Bank of American's purchase of Countrywide may pay for itself in tax savings
-- Barclay's Financial is getting $8.8 billion in fresh capital.
-- New Homes sales continue to drop

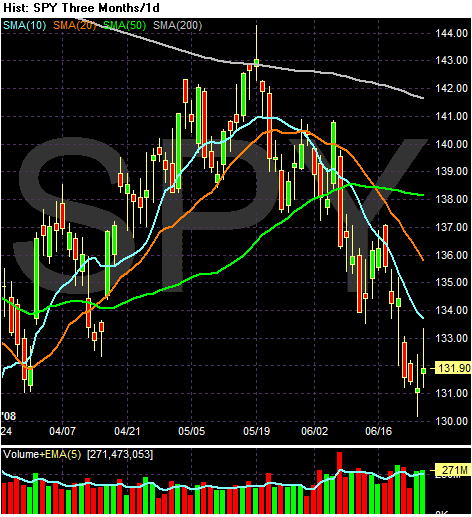
Notice the following on the SPYs daily chart:
-- Prices are back where they were when the Fed backed the Bear Stearns deal.
-- Prices are below all the SMAs
-- All the SMAs are headed lower
-- The shorter SMAs are below the longer SMAs
-- Prices are below the 200 day SMA

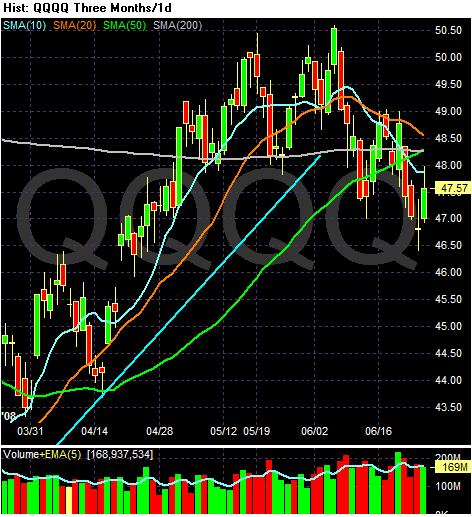
On the QQQQs daily chart, notice the following:
-- Prices are below the 200 day SMA
-- The 10 and 20 day SMA are heading lower
-- The 10 day SMA has crossed through the 200 day SMA
-- Prices are below all the SMAs

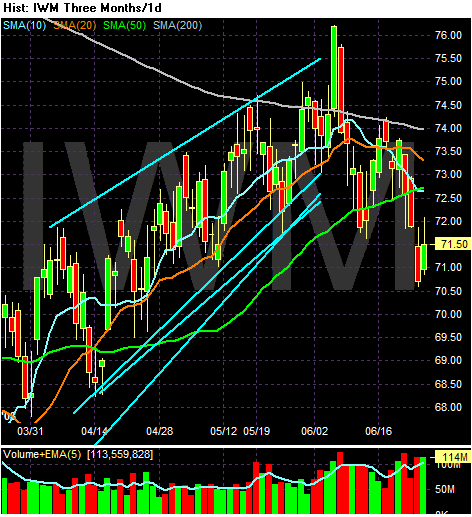
On the IWMs, notice the following:
-- Prices are below the 200 day SMA
-- The 10 and 20 day SMA are both headed lower
-- Prices are below all the SMAs
-- The 200 day SMA is headed lower -- and never turned positive.
None of these charts is very bullish. The SPYs chart is turning more and more bearish.