Showing posts with label transportation. Show all posts

Thursday, April 23, 2009

How Does the Transport Average Stack Up to Current Price Action?

From Bloomberg:

United Parcel Service Inc., the world’s largest package-delivery company, posted a profit that trailed estimates and forecast second-quarter earnings short of analysts’ projections as the recession curbs shipping.

First-quarter net income fell 56 percent to $401 million, or 40 cents a share, the company said today. Excluding non-cash costs to write down the value of UPS’s 40-year-old fleet of DC-8 jets, profit was 52 cents a share, trailing the 56-cent average of 16 analyst estimates compiled by Bloomberg.

UPS is considered a bellwether for economic health because it handles business and consumer packages worldwide. It said profit this quarter would be 45 cents to 55 cents a share, less than the 66-cent average among analysts surveyed by Bloomberg.

“Economic indicators tell us recovery in the U.S. might begin late this year, but more likely not until 2010,” Chief Financial Officer Kurt Kuehn said in a statement.

Sales slid 14 percent to $10.9 billion, only the second quarterly drop since Atlanta-based UPS first sold shares to the public in 1999.


This data point got me thinking about the Transportation average -- more specifically, whether or not the Transports were confirming or denying the rally. The reason is based on Dow Theory, which is:

A theory which says the market is in an upward trend if one of its averages (industrial or transportation) advances above a previous important high, it is accompanied or followed by a similar advance in the other.


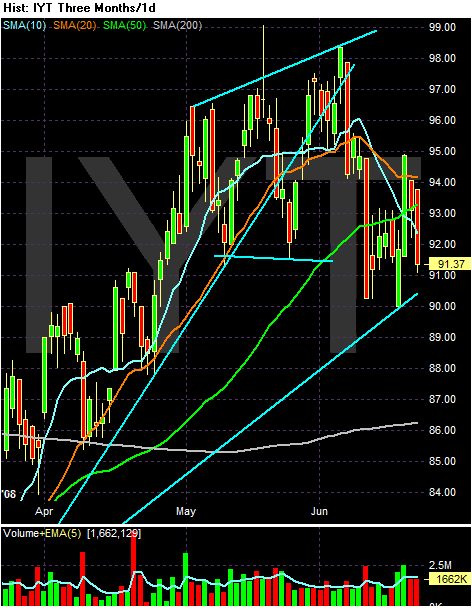
The above chart caught my interest because prices are still below an important trend line. While the SMAs are in a pretty bullish configuration (shorter about longer, two of the shorters moving higher and the longer one moving sideways), prices are still below an important trend line.

In addition,


The MACD is a bit over-extended at these levels.


The three months chart shows two very important technical points.

1.) The upward sloping trend line that started at the beginning of March is now resistance as opposed to support.

2.) Prices have approached the downward sloping trend line twice only to be rebuffed.

If this chart is going to move higher it needs to do so soon.

Tuesday, March 24, 2009

Transportation Not Looking So Rosy

From Reuters:

World airlines are set to lose $4.7 billion this year as a result of the global recession that has shrunk passenger and cargo demand, industry body IATA said.

The International Air Transport Association had estimated in December the industry would lose $2.5 billion in 2009.

"The state of the airline industry today is grim. Demand has deteriorated much more rapidly with the economic slowdown than could have been anticipated even a few months ago," Director-General Giovanni Bisignani said on Tuesday.

"The relief of lower fuel prices is overshadowed by falling demand and plummeting revenues. The industry is in intensive care."

IATA, which represents 230 airlines including British Airways (BAY.L), Cathay Pacific (0293.HK), United Airlines (UAUA.O), and Emirates (EMIRA.UL), also raised its estimate of international airline losses in 2008 to $8.5 billion, from its previous $8 billion estimate.


And consider this table from the Association of American Railroads:


Click for a larger image

We'll need better news from the transportation sector before we can say the economy is moving at top speed.

Tuesday, June 24, 2008

A Closer Look At the Transports

I'm a big fan of Dow Theory, which in a nutshell is:

A theory which says the market is in an upward trend if one of its averages (industrial or transportation) advances above a previous important high, it is accompanied or followed by a similar advance in the other.


Basically, more than one average has to advance for the market to be in a rally. This makes basic economic sense. When the economy is expanding, businesses have to ship more and more stuff from point A to point B. The converse is also true; when the economy is slowing, businesses have to ship less and less stuff from point A to point B. That's why the following news items have caused me some concern:

United Parcel Service Inc (NYSE:UPS - News) warned on Monday that second-quarter earnings would be below expectations, blaming high fuel prices and a sluggish U.S. economy.

.....

UPS estimated earnings of 83 cents to 88 cents a share for the quarter, down from a prior view of 97 cents to $1.04 per share.

In a statement, UPS said U.S. package volume had been lower than expected, while demand for higher-priced air delivery services had seen a particular drop.

Keith Schoonmaker, an analyst at Morningstar, said the warning from UPS was hardly a surprise, given the monstrous head winds the industry faces.

"This just shows that in a challenging economic environment, with high fuel prices, that some customers are shifting to slower, cheaper shipping alternatives" within both UPS and its rivals, he said.


And add this to the mix:

FedEx(FDX - Cramer's Take - Stockpickr) says it will miss analysts' estimates for the current quarter and for fiscal 2009, as the continuing impact of high fuel prices and a weak economy drag on.

"We're pressured by serious economic difficulties," said CEO Fred Smith, on an earnings conference call. "Record high fuel prices and the weak U.S. economy dampened volume growth and substantially affected our bottom line."

Smith added that the "economic headwinds" the company is facing this year will continue into fiscal 2009. But he noted that results during this year and next "will be anomalies" that will "hopefully set the stage for fiscal year 2010."


That makes this an opportune time to take a look at the Transportation average.


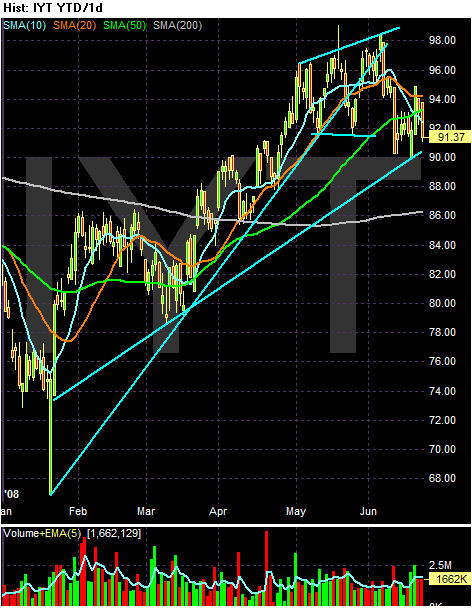
On the 6-month chart, notice the average has been rallying since the first part of the year. There are two important trend lines. The first is from the extreme bottom in mid-January. While this is technically a place to draw a trend line from, I'm always reluctant to draw a line from a point this extreme on a chart. I think the more accurate line is the second line started just after the extreme point.

Using the first trend line (the one from the extreme point) notice the average broken trend in mid-May. Using the second line, notice prices are right at the trend line. Also note the broadening formation that formed in May, which is usually indicative of a market top.


On the SMA chart, notice the following:

-- Prices are above the 200 day SMA

-- The 10 and 20 SMA have moved lower

-- The 10 day SMA has crossed below the 50 day SMA

-- The 50 and 200 day SMA are still positive

-- Prices are SMAs are bunched in a close range

What does all of this tell us?

-- The short term trend is down as indicated by the declining 10 and 20 day SMA

-- The overall trend is still higher

-- Whenever prices and SMAs are bunched together in a tight range it indicates the market is looking for a direction about where to move.

Thursday, March 20, 2008

Why Transports Matter

From the WSJ:

A sharp drop in freight shipped across the Pacific during the past two months suggests the shipping-industry slump is about to get worse.

At the major ports of Los Angeles and Long Beach, Calif., which bring in nearly two-thirds of West Coast containerized goods, import volume fell 8.8% in both January and February compared with a year earlier, as the weakening economy, tough housing market and high gasoline prices eroded U.S. demand.

.....

Transportation companies like FedEx offer a window into the pernicious effects of a slow economy and rising commodities costs.

Slow growth and high energy costs seem to have squeezed FedEx's third-quarter earnings, due to be reported today. Analysts surveyed by Thomson Financial expect it to post net income of $1.22 a share, down 10% from a year ago.

Rival UPS warned last week that it could miss first-quarter earnings targets after six straight weeks of negative volume in its U.S. package business. Kurt Kuehn, UPS's chief financial officer, said "across a very broad segment of our customers there is a slowing in shipping needs."

High energy prices and weakening demand have also thumped truckers. The American Trucking Associations expects truckers to spend $135 billion on fuel this year, up 20% from 2007. Several trucking companies describe the environment today as the worst they've seen, say Morgan Keegan analysts.

Trouble in transports signals a bad outlook more broadly. FedEx shares tumbled in 1999, before the rest of the market. The "FedEx Indicator" seems to be working well again. Its shares started dropping in July and are down 26% since then. The Dow Jones Industrial Average didn't start slipping until October


Simply put, the transports are a great way to keep track of how the economy is doing. If it's going well, people will have to ship more and more stuff from point A to point B. If things aren't going well, people will be shipping less stuff from point A to point B.

I've touched on the following story before, but it's still very relevant to the current situation:

U.S. airlines, which seemed last year to have shaken off a half-decade slump, may face a new round of restructuring amid a stumbling economy and spiraling fuel prices.

The turnabout reflects the headwinds that have buffeted the industry as oil prices have risen 75% in the past year and the housing slump has mushroomed into a broader credit crisis, making it hard for many businesses and households to borrow and prompting consumers to cut back on spending. Most economists now think the U.S. has slipped into a recession, and the debate is shifting to how deep the downturn will be.

Other industries, from the nation's beleaguered banks to retailers and auto makers, are facing similar pressures. But the major airlines, many of which have spent long periods under bankruptcy protection in recent years, worry they are especially vulnerable.


Let's take a look at some charts.
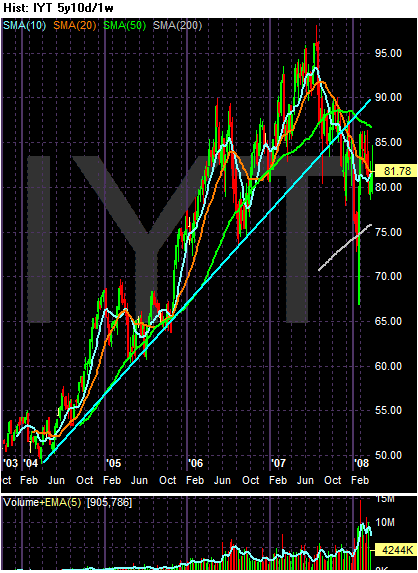


The transportation index was one of the charts that originally led to to make a bear market call. The index had dropped pretty hard. Since then it has bounced back, although not enough for me to change my opinion about the market's overall direction.

Above is the 5 year chart in one week increments. Notice the clear trend break that occurred at the end of last year. Also note how the index has bounced back since the first of the year.
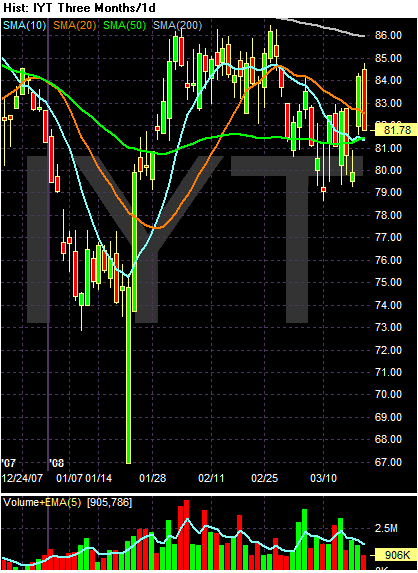


The three month SMA chart shows the bounce back. Notice how the index moved from lows of around 74 - 76 in January to the current levels in the low 1980s. Also note the average is moving closer to the 200 day SMA. But the rest of the SMA picture is cloudier. Notice that prices and the shorter SMAs (10, 20 and 50) are tightly packed around 81. That indicates there is a great deal of uncertainty about where this average is going. Also notice the average is inching back to the 200 day SMA. A cross above this like and a sustained presence about it could indicate an overall change in the market's thinking about the economy.

Let's take a look at the sub-industries
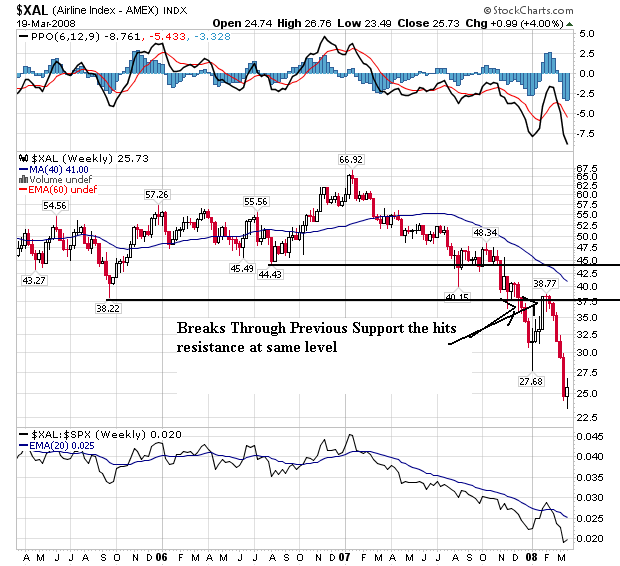


Airlines are clearly in a downtrend. They've been selling off since the beginning of 2007. Notice at the end of last year they fell through a price level established in late 2005 and then rallied into that level and failed in early 2008. That means there is probably further trouble ahead for this sector.
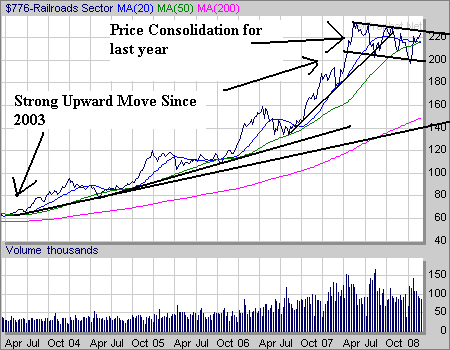


Rail has a stronger chart. Notice that it hasn't dropped nearly as hard as the broader transport index or the airlines. The sector has been in a consolidation pattern for the last year. Rail has a more solid customer base. For example, they help to transport oil and coal which will be used regardless of the overall economic situation.
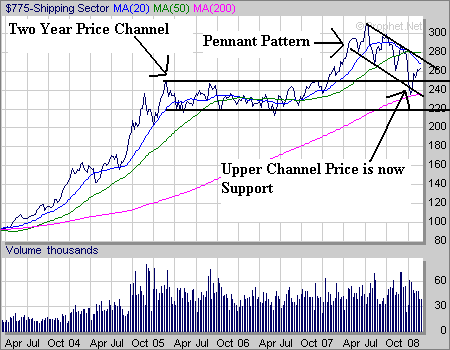


Shipping was in a two year price channel in 2005 and 2006. It broke out of that channel in 2007, but has been in a downward sloping pennant pattern since last summer.
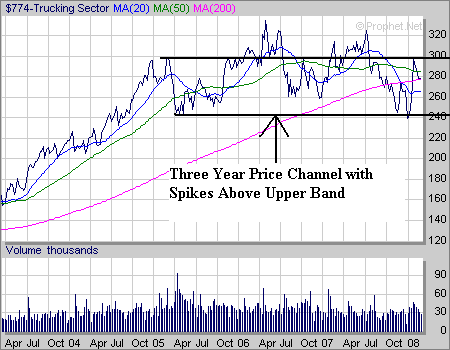


Trucking has essentially been in a three year long consolidation pattern since the beginning of 2005. Prices have moved between 240 and 300 on the chart with tow spikes about those levels. But the index couldn't keep the the upward momentum.

Overall, the sub-industries indicate traders are concerned but not panicked about the sector. They're taking some profits, but not aggressively selling.

Thursday, December 20, 2007

Why Transports Matter

From IBD:

The railroad operator slashed its Q4 earnings outlook by 20 cents to $1.70 - $1.80 a share, below $1.98 forecasts. Union Pacific (UNP) blamed higher diesel costs. Q4 fuel costs will average $2.60 a gallon — 34% above last year — topping $2.70 this month. Union Pacific also cited weak Dec. traffic due to winter storms. Its shares fell 4%.


Here are some industry charts from Transmatch:


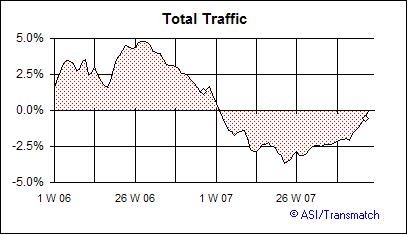
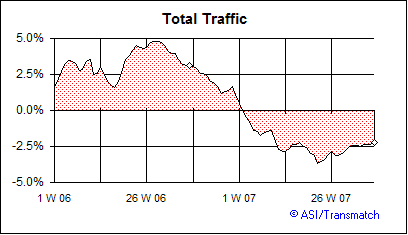
The 13-week rolling average of total traffic is increasing, and has been for awhile. That's a positive development.


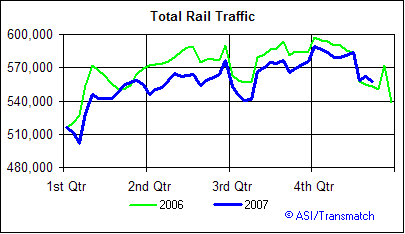
But this year's total rail traffic numbers have in general been below last years numbers.

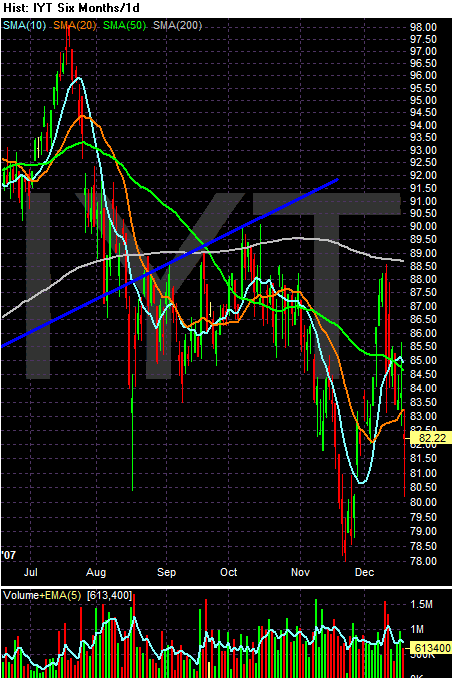
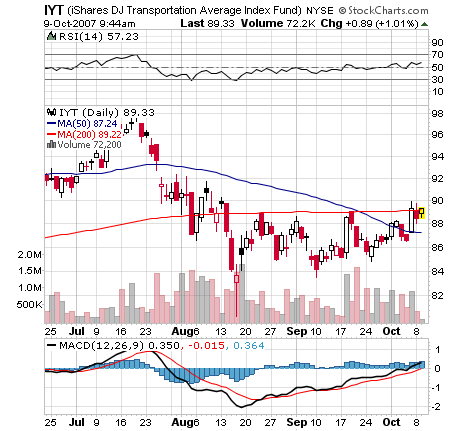
Here's the chart of the transports:


Notice the following.

-- The index is about 8% below the 200 day SMA.

-- Since August, the index has tried to rally above the 200 day SMA twice and been unsuccessful.

-- The 200 day SMA is now heading lower.

-- the 50 day SMA is heading lower.

-- prices are below all the SMAs.

On the good side -- or at least the neutral side we have the following:

-- the shorter SMAs are bunched up, indicating a lot of confusion about where the market wants to go. This is the same situation we're seeing with the big averages.

However --


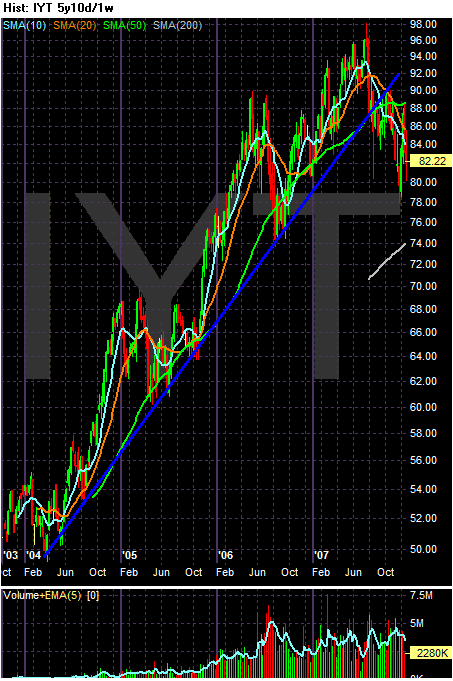
On the five year chart, notice the index has clearly broken a 3 1/2 year uptrend and is now heading lower. However, the move lower is measured, meaning there doesn't appear to be any panic selling. That's about the only good thing about this chart.

Friday, November 16, 2007

Why Transports Matter and What Inflation?

One company and two, two TWO grand themes!!!!

From the Street.com


FedEx (FDX - Cramer's Take - Stockpickr - Rating) lowered its earnings projection for the current quarter and fiscal year, citing increased fuel costs and weak freight trends.

The parcel-shipping giant now sees earnings of $1.45 to $1.55 for the quarter ending Nov. 30, down from its previous forecast of $1.60 to $1.75. Analysts polled by Thomson Financial anticipated earnings of $1.70 a share.

For the full fiscal year, FedEx projects earnings of $6.40 to $6.70 a share. Its prior view called for a profit of $6.70 to $7.10 a share; analysts had an average forecast for earnings of $6.85 a share.

FedEx had already offered weaker-than-expected projections for the periods in its first-quarter report in September. But the company said Friday that its fuel costs have increased 8%, or $85 million, since that time.


This is not the first time Fed Ex has recently warned about earnings. From September 20:

FedEx (FDX - Cramer's Take - Stockpickr - Rating) said earnings rose for the just-completed quarter, but the package carrier reduced its forecasts for the current quarter and the full year because of economic uncertainty.

The company encountered "a U.S. economy slowed by a sharp correction in the housing market, financial volatility and high energy costs," said CEO Fred Smith, on a conference call.

The impact was particularly severe at FedEx Freight, owing to the housing market's effect on the less-than-truckload transportation market,
he said. Still, strong international results led to profit growth.


Federal Express is the second largest company in the air services and freight sector. UPS is about twice as large. In other words, what Fed Ex say is very important for the overall economy. And what they are saying isn't very good.

Dow theory says the transports have to confirm the broader markets. The underlying logic is simple. If the economy is expanding, we'll have to ship more and more stuff. Conversely, if the economy is contracting, we'll be shipping less and less stuff. The logic is pretty much irrefutable.


The transports say we're in trouble.

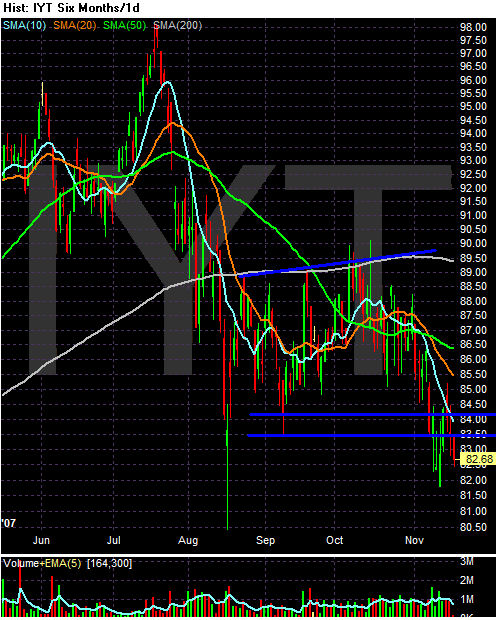
1.) The index is below the 200 day SMA, and has been there since early August.

2.) The shorter SMAs are below the longer SMAs.

3.) All of the shorter SMAs (10, 20 and 50) are moving lower.

4.) prices are below the SMAs.

Also note Fed Ex's statement about fuel costs. Fuel costs have increase 8% . That's a huge increase for a company that depends on oil costs.

Wednesday, October 24, 2007

Why Transports Matter

I harp on the importance of Dow Theory a lot. Basically, if the economy is improving business will make more "stuff" and people will buy more "stuff" which means more "stuff" will have to get from point A to point B.

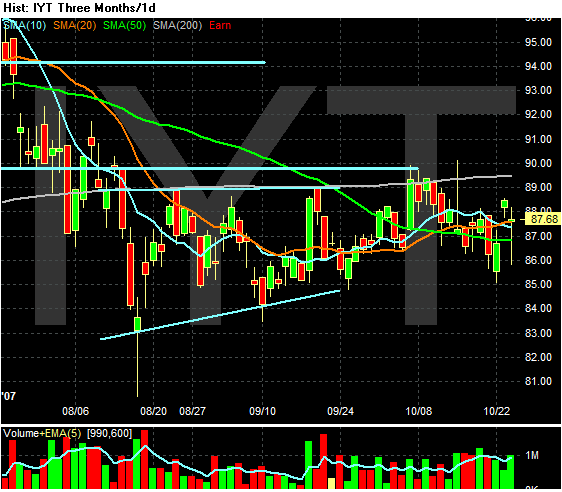
But while the SPYs rallied after the last Fed rate cut, the transports have been mired in a trading range. In fact, the transports have been below the 200 day simple moving average (SMA) for almost three months now.


Here are some of the earnings stories from the sector.

Railroads fall (Wednesday 10/24):

Meanwhile, analyst Jason H. Seidl cut his rating on shares of Burlington Northern to "Neutral" from "Outperform," saying the stock has less potential for growth after a 17 percent year-to-date stock price increase.

He noted that while the company posted third-quarter earnings that beat Wall Street expectations, the near future is expected to be challenging as carload demand continues to wane.


Norfolk Southern Profit Drops:(10/24)

Norfolk Southern Corp., the fourth- largest U.S. railroad, said third-quarter profit fell 7.2 percent on declines in coal shipments and freight moved by a combination of trains and trucks.

Net income decreased to $386 million, or 97 cents a share, from $416 million, or $1.02, a year earlier, the carrier said today in a statement. Earnings trailed analysts' estimates, and the shares tumbled the most in two months.

``I was a bit surprised in the negative reaction in the stock,'' said Jason Seidl, a Credit Suisse analyst in New York, noting that the railroad announced Oct. 9 that profit would drop. He rates Norfolk Southern as ``neutral.''


Con-Way Profit Drops: (10/23)

Freight and logistics company Con-way Inc.'s net income fell 41 percent in the third quarter due to restructuring costs and weak demand, the company said Tuesday.

Profit amounted to $37.3 million, or 78 cents per share, versus $63 million, or $1.24 per share, a year earlier. Revenue rose 3 percent to $1.11 billion from $1.08 billion. Results included restructuring and acquisition costs of $7 million, or 9 cents per share.


Heartland Express' earnings drop slightly (10/23):

Heartland Express, Inc. (Nasdaq:HTLD - News) announced today financial results for the quarter ended September 30, 2007. Operating revenues for the quarter decreased slightly to $146.6 million from $147.1 million in the third quarter of 2006. Operating income for the quarter was negatively impacted by a $4.3 million decrease in gains on disposal of property and equipment. Net income decreased 25.5% to $17.1 million from $23.0 million in the 2006 period. Earnings per share were $0.18 compared to $0.23 for the third quarter of 2006. The Company expects a minimal amount of gains from disposal of property and equipment in the fourth quarter of 2007.


Ryder Net Rises 1% (10/24):

Ryder System Inc., the largest U.S. truck-leasing company, said third-quarter profit rose less than 1 percent as a softening economy reduced demand.

Net income climbed to $65.5 million, or $1.11 a share, from $65.3 million, or $1.06, a year earlier, the Miami-based company said. Revenue rose 2 percent to $1.65 billion, curtailed by a 15 percent decline in short-term truck rentals. The shares fell.

``The U.S. economy is moderating and they're seeing softness in certain patches of it,'' said Todd Fowler, an analyst with KeyBanc Capital Markets in Cleveland, in an interview. ``There's some concern as to how long softness in rental markets will last.'' Fowler rates Ryder ``hold'' and doesn't own shares.


Simply put, we're just not moving that much more "stuff" right now.
That makes me wonder about how good the underlying economy really is -- and how strong the market really is.

Tuesday, October 9, 2007

Why Transports Matter, pt II

The more things change, the more they stay the same. At the end of last year, I read some of the earliest market analysts' theories (Gartley, Schabacker and Gann). It's amazing to me how relevant the analysis is to today's markets.

One of the theories that made the most sense to me was the Dow Theory, which according to Wikipedia:

In Dow's time, the US was a growing industrial power. The US had population centers but factories were scattered throughout the country. Factories had to ship their goods to market, usually by rail. Dow's first stock averages were an index of industrial (manufacturing) companies and rail companies. To Dow, a bull market in industrials could not occur unless the railway average rallied as well, usually first. According to this logic, if manufacturers' profits are rising, it follows that they are producing more. If they produce more, then they have to ship more goods to consumers. Hence, if an investor is looking for signs of health in manufacturers, he or she should look at the performance of the companies that ship the output of them to market, the railroads. The two averages should be moving in the same direction. When the performance of the averages diverge, it is a warning that change is in the air.


Sometime over the last few months, a commenter posted a really good observation. With the US becoming more technologically innovative wouldn't another average be a better confirming indicator? He suggested something along the lines of a communications average as a confirming indicator. Intuitively this also makes sense. US business is communications dependent. As business becomes busier, they will utilize more communications.

However, I still believe the transport average is incredibly important. First, the US still produces a lot of "stuff". Secondly, the US consumer is now responsible for 70% of US GDP growth and a lot of the consumer's purchases are made overseas. These consumer goods have to be transported from overseas to U.S. ports. The goods then have to be shipped from the ports to consumer markets. As a result, transport activity is still a very relevant metric of economic measurement.

That's why stories like this get my attention:

Cargo containers crammed with foreign-made goods that were supposed to set a record in August at major U.S. ports took an unexpected turn, with imports sinking 1.4% in another sign of the slowing of the economy.

Imports of items as diverse as toys and tiles could also be lower in September and October, when retailers will be stocking shelves for the holidays, because shell-shocked shoppers are expected to continue to pull back.

The falloff "reflects the consumer-demand-driven weakness in the U.S. economy," said Paul Bingham, an economist with Global Insight, a research firm that monitors cargo movements for the nation's top retailers.

The slump in oceangoing imports unloaded at the 10 largest U.S. container ports in August was the first drop since Global Insight began its monthly Port Tracker report in 2005. The number stunned some port watchers.


Granted, it's the first drop. But there is other news emerging from the transportation sector that indicates all is not well.

From Railfax here is the year over year percent change in total railroad traffic:


Transports importance to the economy as a whole was a central reason why Ryder's recent announcement was important:

Trucking and logistics company Ryder set off economic alarm bells Monday morning when it issued an earnings warning that it attributed to the economic slowdown spreading beyond housing and construction.

The meltdown in the mortgage and credit markets this summer, and the corresponding hit to the U.S. housing and home building markets, have been well documented by economists and investors. Many have also been anticipated that the problem may spread beyond those sectors.

Ryder, which manages and operates a fleet of more than 140,000 vehicles ranging from tractor-trailers to light-duty trucks for a wide variety of companies' transport needs, said that it is seeing a slowdown in business activity from its clients.


The bottom line is the transportation sector is sending warning signals right now. And the transportation average still isn't confirming the recent rally, which is cause for concern.

Thursday, August 2, 2007

Transport Traffic Still Decreasing

I'm a big fan of the Dow theory, largely because it makes such great sense. If the economy is growing then business will need to use more transportation resources to get its products to a variety of locations.

Right now we're seeing decreased traffic.

From the American Trucking Association:

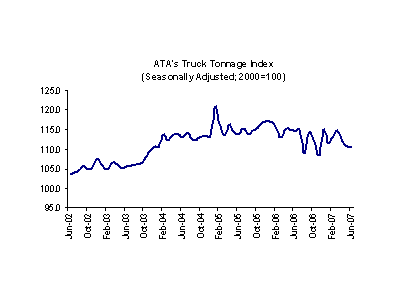
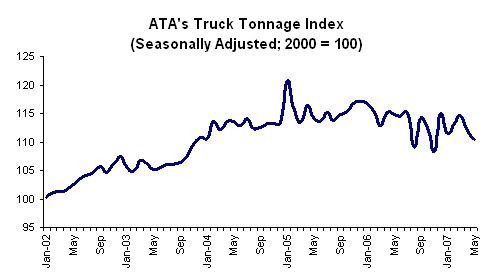
The American Trucking Associations’ advanced seasonally adjusted For-Hire Truck Tonnage Index decreased 0.1 percent in June, marking the third consecutive month-to-month drop. Tonnage fell 1.3 percent in May and has dropped 3.5 percent since March. The not seasonally adjusted index dropped 3.3 percent from May to 114.1.

On a seasonally adjusted basis, the tonnage index declined to a seven-month low of 110.5 (2000 = 100) in June from 110.6 the previous month. Compared with a year earlier, tonnage was down 3.4 percent in June, which is just a slight improvement from the 3.6 percent year-over-year decrease in May.

ATA Chief Economist Bob Costello said that while the government reported the economy grew at a 3.4 percent annualized rate in the second quarter, that strength did not filter into the transport sector. “Our tonnage index fell 1.8 percent during the second quarter from the first quarter and was 3.2 percent lower than the same quarter in 2006,” he said.


Here's a chart from the report:

Photo Sharing and Video Hosting at Photobucket

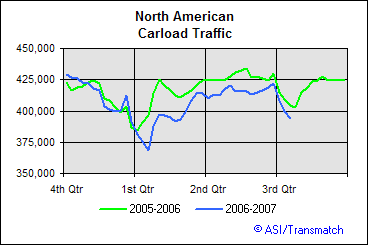
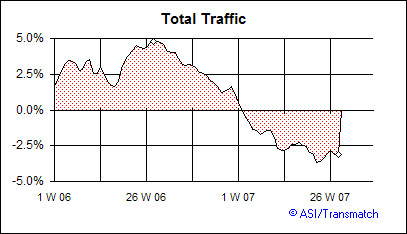
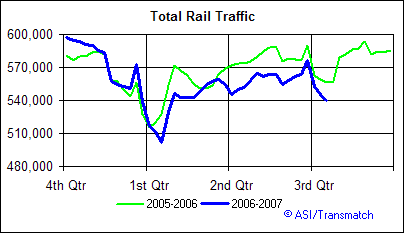
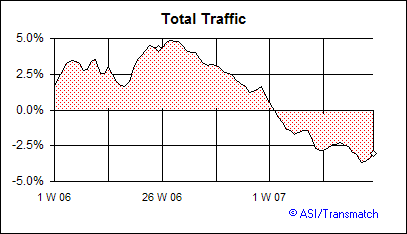
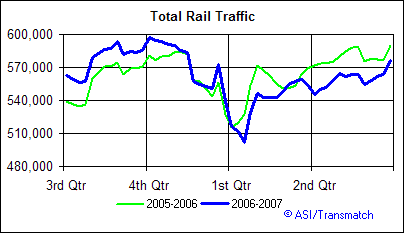
Also note that rail traffic is still below year ago levels. These charts are from Transmatch

Photo Sharing and Video Hosting at Photobucket

Photo Sharing and Video Hosting at Photobucket

Photo Sharing and Video Hosting at Photobucket

Sunday, July 8, 2007

Where Are All the New Products?

Railroads

These charts are from Transmatch:

13-week rolling average

Photo Sharing and Video Hosting at Photobucket

4-week rolling average

Photo Sharing and Video Hosting at Photobucket

Trucking

From Truckline

Photo Sharing and Video Hosting at Photobucket