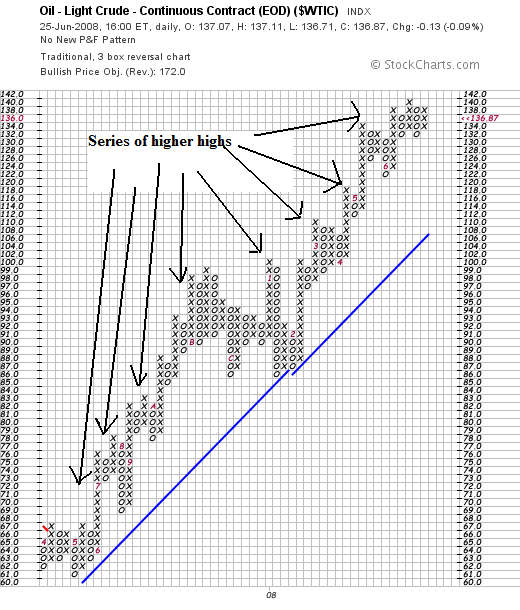
Despite all the talk about trying to boost production etc., prices have only gone higher. Oil has an incredibly strong series of increasing highs. This is a really bullish chart.
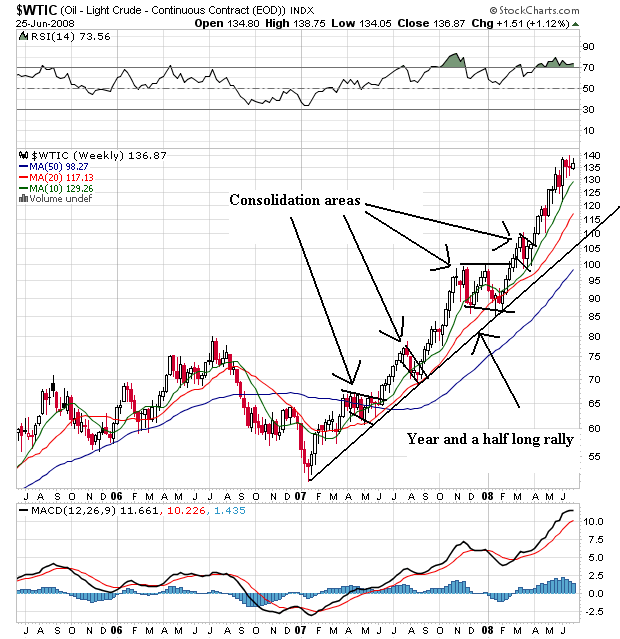
On the weekly chart, notice the following:
-- Prices have been in a rally for the last year and a half
-- Prices have moved through resistance levels and then consolidated their gains
-- All the SMAs are moving higher
-- The shorter SMAs are above the longer SMAs
-- Prices are above all the SMAs
This is still a very bullish chart.
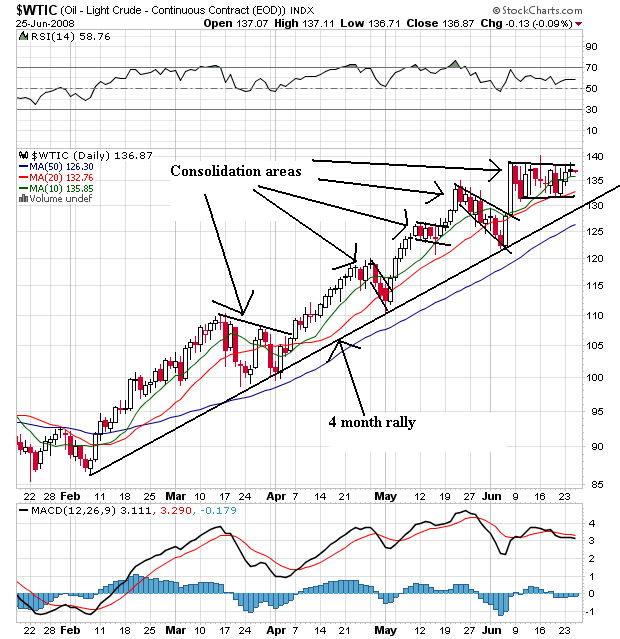
On the daily chart, notice the following:
-- Prices have been rallying for 4 months
-- Prices are above all the SMAs
-- All the SMAs are moving higher
-- The shorter SMAs are above the longer SMAs
This is also a very bullish chart