Over the weekend I wrote two long posts titled Is A Bear Market Developing?, and Is a Bear Market Developing, pt. II. The short version of these posts is there are some very troubling developments in the markets: the transportation index, the financials (XLF), consumer discretionary (XLY) and dollar are all in terrible shape. There has been a Treasury market rally, partly as a result of a fight to safety. In short, I am incredibly defensive about the next month or so in the market.
Let's look at the charts as the trading week starts.
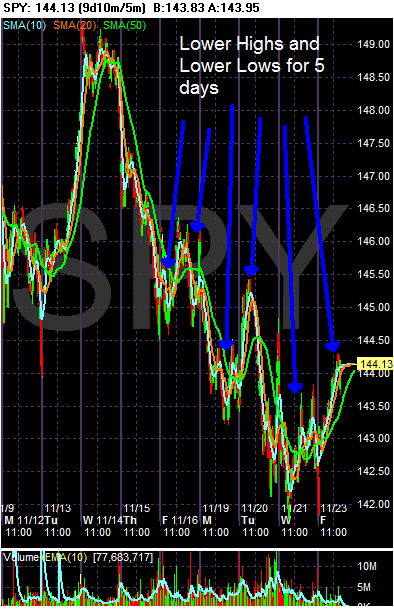
The SPYS are in a downward move right now, as indicated by the lower lows and lower highs since about a week ago. We saw a rally on holiday-shortened Friday. However, the SPYs would have to advance above the previous high a bit below 145.50 before the downward trend is broken. In addition --
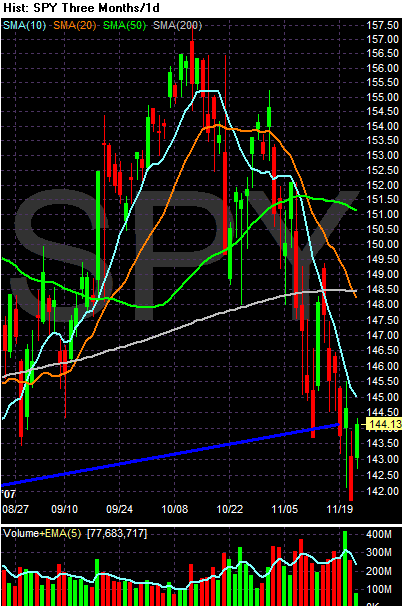
On the daily chart, the SPYs are in a clear downtrend since the beginning of November. The blue line is the upper trend line of a 4-year upward sloping channel. Also note the SPYs are about 3% below the 200 day SMA. The shorter SMAs are headed lower and the 10 day SMA has crossed the 200 day SMA by a wide market and the 20 day SMA has just crossed. This is not a good chart.
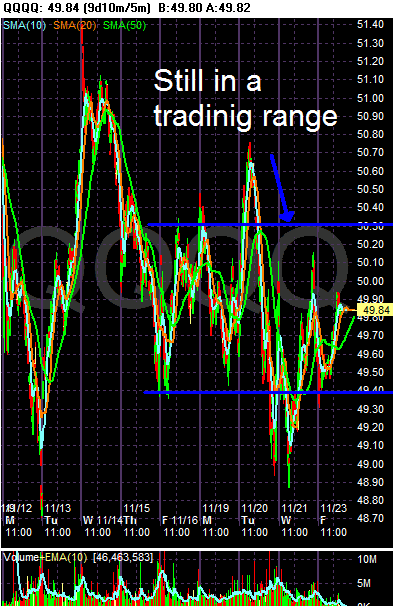
The QQQQs are still in a trading range, which is better seen on the following chart.
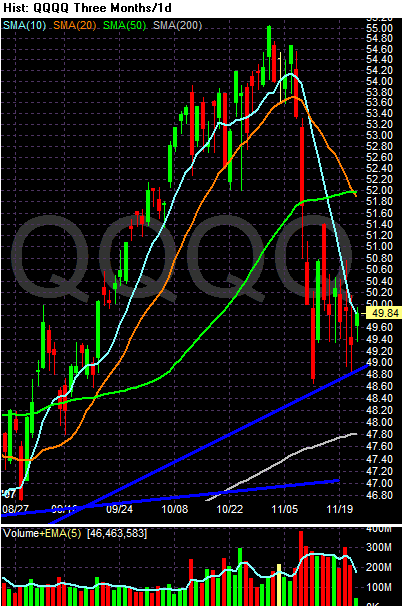
The QQQQs have been consolidating for the last week and a half waiting for something to move them in either direction. The good news about this chart is the QQQQs are still above the 200 day SMA and an upward sloping trendline. The bad news is nothing has happened to drive the index higher.
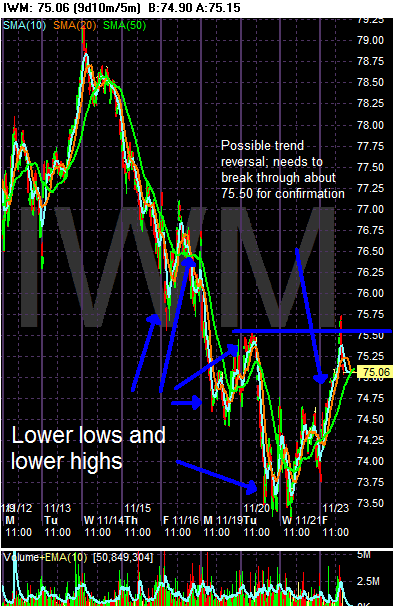
The Russell 2000 -- like the SPYs - was in the middle of a week-long downtrend. However, Friday's action may have given the index a reason for a technical rally. The index will have to move convincingly above about 75.50 for the trend reversal to occur.
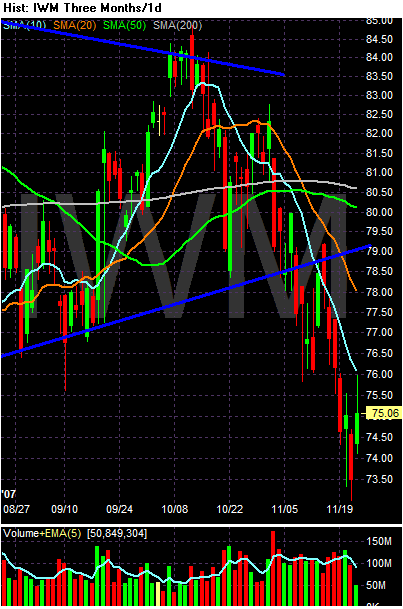
However, the daily chart on the Russell is bearish. This is one of the reasons I am very defensive about the market. The blue line is a 4-year uptrend which the index is now clearly below. In addition, the index is below the 200 day SMA. The 10, 20 and 50 day SMA are below the 200 day SMA. Because of this, I expect any rally will be temporary in nature.